Project Performance Test

Often we have a task to test how much the site of our clients withstands. For ourselves, as a testing tool, we chose yandex-tank. This will be a brief note on how to quickly start working with this tool.
And so, in order. We put the yandex tank on the CentOS 7. I’ll say right away that it didn’t start on the 6th, but on 7 it was launched with a bang. To put it:
yum install libxml2-devel libxslt1-devel python-devel zlib1g-devel python-pip pip install --upgrade pip yum groupinstall 'Development Tools' pip install yandextank After performing these simple actions, we got the working core of the tank. But we still have to put the request generator. We chose phantom as a generator, you can also use jmetr and others. To install phantoma, simply do the following:
yum install perl openssl-devel binutils-devel make git -y git clone https://github.com/mamchits/phantom.git cd phantom make -R all mv ./bin/phantom /usr/bin/ mv ./lib/phantom/ /usr/lib/ Already, almost everything is ready for use, it remains only to prepare a file with the test configuration, here it looks like this:
')
[loadosophia] token=xxxxxxxxxxxxxxxxxxxxxxxxxxxxxxxxxxxxxxxxxxxxxxxxxx project=centos-admin test_title=centos-admin.ru [aggregator] time_periods = 1ms 2 3 4 5 6 7 8 9 10 20 30 40 50 60 70 80 90 100 150 200 250 300 350 400 450 500 600 650 700 750 800 850 900 950 1s 1500 2s 2500 3s 3500 4s 4500 5s 5500 6s 6500 7s 7500 8s 8500 9s 9500 10s 11s 12s 13s 14s 15s 16s 17s 18s 19s 20s 21s 22s 23s 24s 25s 26s 28s 29s 30s 100s 300s [web] port = 80 ; interval = 1 ; manualstop = 1 ; [phantom] address = 176.9.95.100 ;ssl = 1 port = 80 rps_schedule=step(10,100,10, 10s) ;load schemei ; Headers and URIs for GET requests header_http = 1.1 headers = [Host: centos-admin.ru] ; [Authorization: Basic xxxxxxxxxxxxxx] [Connection: close] uris = / /rates [autostop] autostop=time(2s,2s) http(5xx,100%,2s) net(xx,10,30) Now a little about what all this means:
1. [loadosophia] is a section that describes where to put the reports. To configure it, you need to register at loadosophia.org , generate a token there and specify it in the configuration file.
It is also convenient to specify test_title so that when testing multiple sites you can split the reports.
2. [aggregator] intervals for which results will be rounded, list separators - spaces
3. The [web] module launches a local web server displaying online test graphs.
4. [phantom]
address is the server address where the site is located. It can be set in the form of iP or URL
ssl - whether ssl is used, 1 - yes, 0 - no
port - site port
rps_schedule is the most interesting, it shows how the load will be applied. and there are 3 possible options:
step (start rps, stop rps, step, time)
Copy
start rps - with rps start.
stop rps - up to how many rps to perform the test.
step - how many rps to add.
time - the time of each step.
Constant load:
const (rps, time)
Copy
Ascending:
line (star rps, stop rps, time)
Copy
Example: step (10.50, 3, 60s) - in this case, the test will start from 10 rps, and every 60 seconds will add 3 rps until it reaches 50 rps.
headers - headers sent with the request.
Example: [Host: centos-admin.ru] so that you can determine which vhost;
[Authorization: Basic dmd1cnlhbm92Ok1pbGVuaXVtMzIx] - if authorization is needed;
[Connection: close] - so that the server closes the connection immediately, and not by timeout.
uris - a list of uri which will be tested
ammofile - instead of uris, set the name of the file, which contains a list of requests.
instances - the maximum number of testing threads /
5. [autostop] section in which it is determined in which case to stop testing.
time - stop the test if the average response time exceeds the specified threshold for a specified time, exit code 21. For example: time (1s500ms, 30s) time (50,15)
http — stop the test if the number of HTTP codes corresponding to the mask is greater than the specified absolute or relative threshold, exit code 22. Examples: http (404,10,15) http (5xx, 10%, 1m)
net - similar to HTTP codes, but for network response codes, exit code 23. mask xx, meaning "all non-zero"
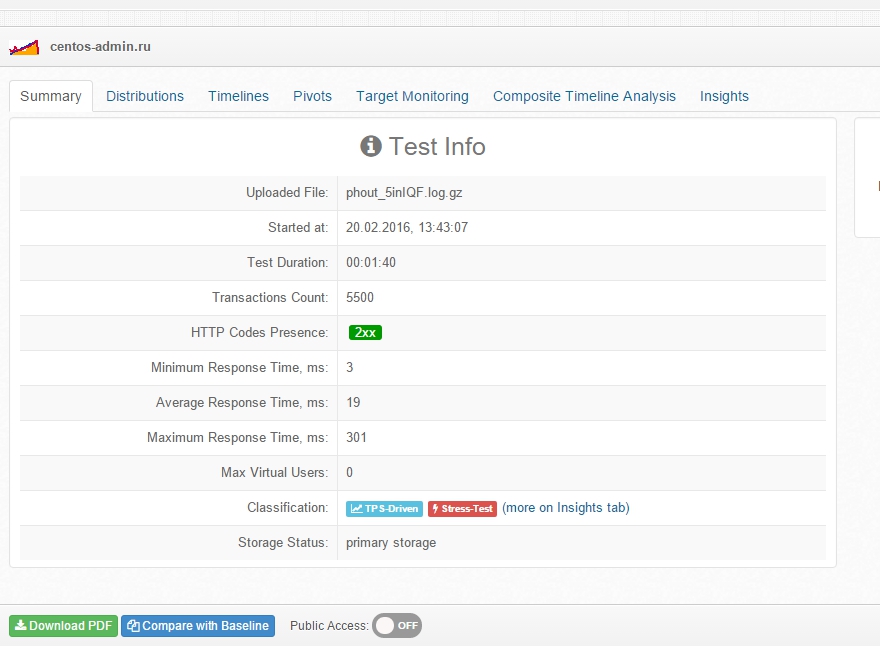
Well, a little bit about how the reports look:
Summary tab: general test data.
Distributions tab: Contains data on the distribution of response time to a request. Simply put, how many requests were received over a period of time n:
The number of responses for 0-100,100-200 ms, etc.
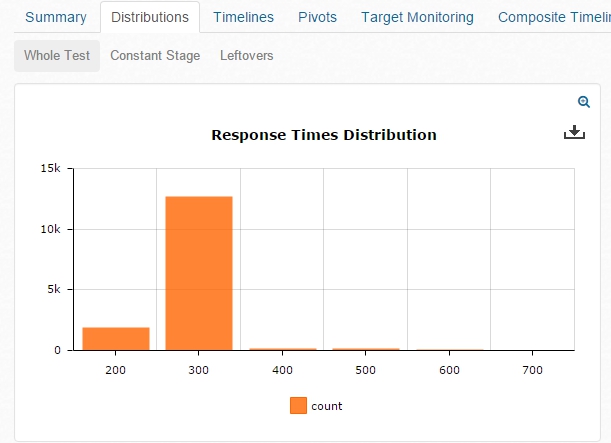 !!!
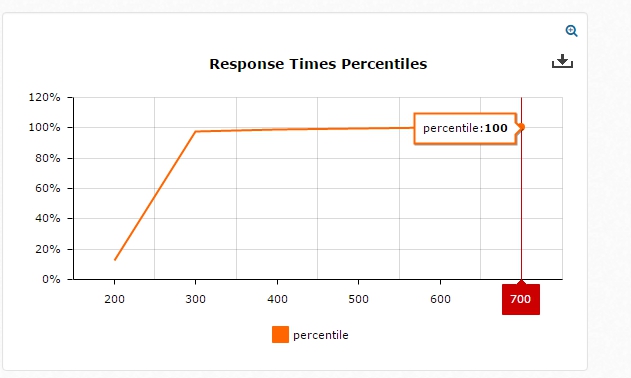
!!!What% of responses were received in time n:
Timelines tab: Allocation of response time depending on the response.
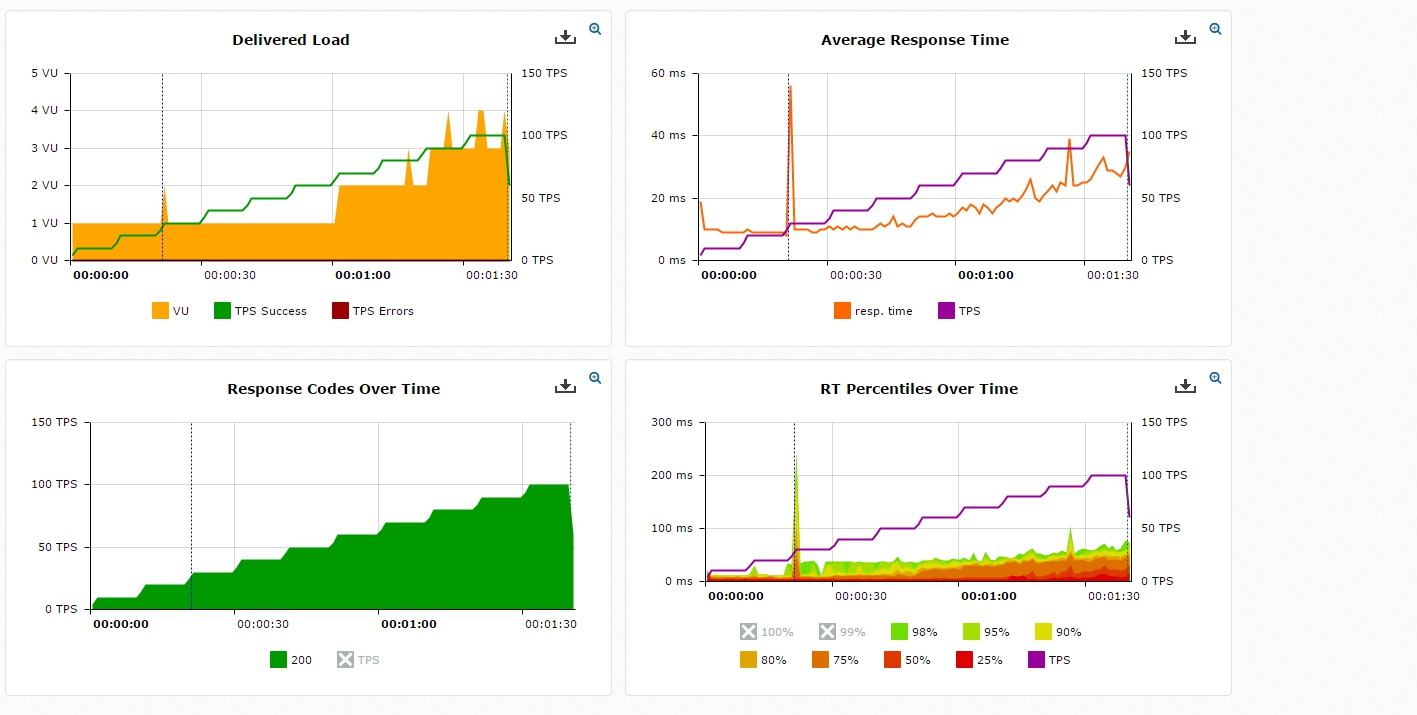
Important indicators:
TPS (transaction per sec) is the same as rps.
VU how many parallel processes were running to provide the specified number of rps.
TPS = (1000 / responce time) * VU.
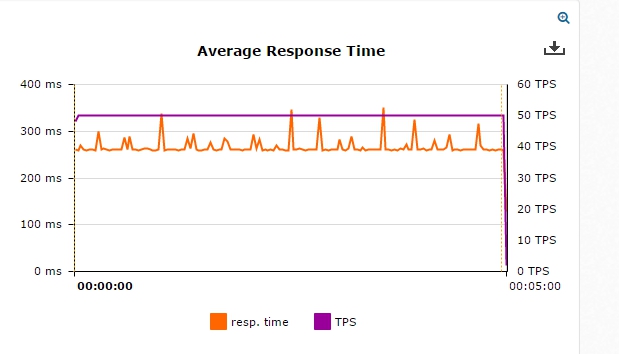
The most interesting schedule:
Average response time for a given amount of rps
Target Monitoring tab:
The parameters of the tested network are displayed here, if an agent is installed on it. Installed automatically by ssh.
The remaining tabs are a variation.
And finally, for those who read to the end) I'll tell you about how we use it. Usually, at the beginning we turn on all sorts of logging on the server, and run a quick test with unlimited rps (~ 10,000). We look how many maintains the server and we remember this number. Next is the process of optimizing the server, viewing logs, searching for slow queries in the database and slow php scripts, c optimizing system settings. And so on until we see that the servers are no longer held due to resources. We carry out a test, compare the resulting figure with the original one and rejoice. Well, in the end we run the test for several hours to make sure that the site can withstand a long load.
In one of the following articles we will try to show with an example how optimization works.
Author: Magvai69 System Administrator
Source: https://habr.com/ru/post/277897/
All Articles