What could be the stack of technologies for trading options on the Moscow Stock Exchange
In a blog on Habré, we write a lot about the hardware and software used to work in the stock market. Not so long ago, we considered a stack of technologies for high-frequency trading, and today we will discuss what tools can be used to trade options on the Moscow Exchange. The material on this topic was written by ITinvest expert Oleg Mubarakshin.
Introduction
This article will describe in detail the technologies I use to trade options on the Moscow Exchange. Immediately, I note that this article is not about trading software (sending applications to the stock exchange, etc.), but about the technological solutions I use for real-time valuation of options and positions.
')
Currently, the option trader has many tools available for analyzing options and portfolios, many of which are immediately integrated into the trading terminals. However, for my tasks they did not fit and do not fit to this day, for various reasons, including because of their high cost (good solutions are quite expensive). Therefore, two years ago, I decided to create my own software that allows me to analyze options and positions as I need it.
I have several strict requirements for my optional software:
- Real-time market data;
- Cheap solution, but better free;
- Flexible in terms of pricing options (very important! But few understand this);
- Simple in terms of writing code and using robust methods (it is desirable that the majority is already done by smart people and experienced developers);
- Convenient in terms of deployment and sharing;
- User-friendly interface;
- Bug and blunder protected (errors in pricing should be visible immediately and with the naked eye).
What was not critical:
- HFT (low latency) is not needed, there is no desire or opportunity to spend resources on it;
- Information security, user rights management, etc. (there is - well, no - and all right);
- Copyright protection
So, let's see what I came for these two years.
The software structure is shown schematically in fig. 1. Its components are described in detail below.

Fig. 1. The general scheme of the organization of software and equipment
Hardware
As a hardware, a laptop with an Intel Core i7 processor, 8 GB of RAM and Windows 7 was used. Shiny Server needs Linux, so with the help of the WMware Player (also free) a virtual machine was created running under Ubuntu Server 14.04.
Market Data
Market data - current quotes (bid, ask, last, volume, etc.) of futures and options - using ODBC exports are shipped from QUIK to the PostgreSQL database. This method of data feed has proven itself well, it works stably and quickly.
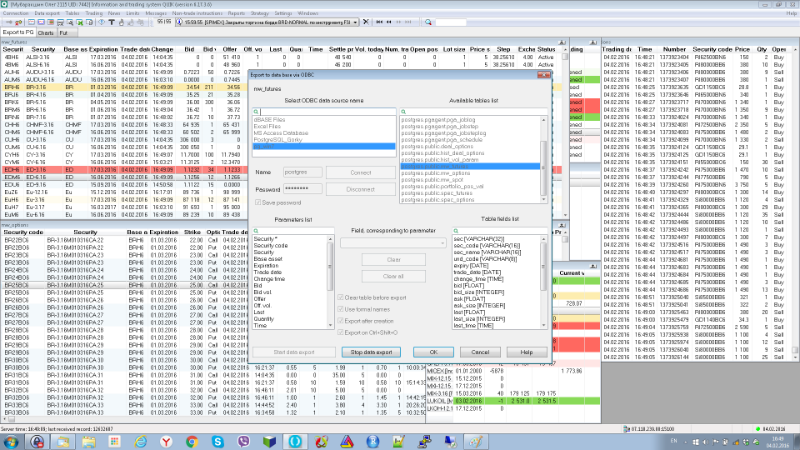
Fig. 2. ODBC export from QUIK to DB
The current position (portfolio) is loaded into the database using the SmartCOM API - the development of an ITinvest broker.
Database
PostgreSQL is installed on Windows 7. Data coming from QUIK using triggers and database functions are processed and stored in special tables. For example, the mw_options table, to which the QUIK table with current market data of options is exported, contains a trigger:
CREATE TRIGGER trig_upsert_spec_options AFTER INSERT OR UPDATE OF sec_code, sec_name, lot, tick, fee ON mw_options FOR EACH ROW EXECUTE PROCEDURE func_upsert_spec_options(); calling function:
CREATE OR REPLACE FUNCTION func_upsert_spec_options() RETURNS trigger AS $BODY$ BEGIN UPDATE spec_options SET sec_name=NEW.sec_name, lot=NEW.lot, tick=NEW.tick, fee=NEW.fee WHERE sec_code=NEW.sec_code; IF NOT found THEN INSERT INTO spec_options(sec_code, sec_name, und_code, expiry, strike, type, lot, tick, fee) VALUES (NEW.sec_code, NEW.sec_name, NEW.und_code, NEW.expiry, NEW.strike, NEW.type, NEW.lot, NEW.tick, NEW.fee); END IF; RETURN NEW; END; $BODY$ LANGUAGE plpgsql VOLATILE COST 100; ALTER FUNCTION func_upsert_spec_options() OWNER TO postgres; which adds / updates data in the spec_options table, where the specification of option contracts is stored:
CREATE TABLE spec_options ( sec_code character varying(16) NOT NULL, sec_name character varying(32), und_code character varying(8), expiry date, strike double precision, type character varying(4), lot integer, tick double precision, fee double precision, CONSTRAINT spec_options_pkey PRIMARY KEY (sec_code) ) WITH ( OIDS=FALSE ); ALTER TABLE spec_options OWNER TO postgres; Shiny server
Shiny Server can not be installed on Windows, so a virtual machine with Ubuntu (trusty) was created.
Next, you need to install the latest version of R. Ubuntu already has a link to R, but as a rule it is outdated, so it’s better to do this:
$ sudo sh -c 'echo "deb http://cran.rstudio.com/bin/linux/ubuntu trusty/" >> /etc/apt/sources.list' $ gpg --keyserver keyserver.ubuntu.com --recv-key E084DAB9 $ gpg -a --export E084DAB9 | sudo apt-key add - $ sudo apt-get update $ sudo apt-get -y install r-base You can check the version by running R:
$ R To exit R, enter the following command in it:
> q(save = "no") Then install the necessary R packages - shiny, devtools, rmarkdown and shinyjs:
$ sudo su - -c "R -e \"install.packages('shiny', repos = 'http://cran.rstudio.com/')\"" $ sudo apt-get -y install libcurl4-gnutls-dev libxml2-dev libssl-dev $ sudo su - -c "R -e \"install.packages('devtools', repos='http://cran.rstudio.com/')\"" $ sudo su - -c "R -e \"install.packages('rmarkdown', repos='http://cran.rstudio.com/')\"" $ sudo su - -c "R -e \"devtools::install_github('daattali/shinyjs')\"" Next, install Shiny Server. Instructions for installing the latest version here, at the time of this writing, the version was 1.4.1.759:
$ sudo apt-get install gdebi-core $ wget https://download3.rstudio.org/ubuntu-12.04/x86_64/shiny-server-1.4.1.759-amd64.deb $ sudo gdebi shiny-server-1.4.1.759-amd64.deb If everything is done correctly, then calling the link (
ip_shiny_server is the IP address of your virtual machine)ip_shiny_server:3838 , you will see the welcome page of your Shiny-server with two active widgets:
Fig. 3. Welcome page of Shiny Server
I also recommend installing a very convenient Rstudio Server development environment. Instructions for installing the latest version here . Example installation commands:
$ sudo apt-get install gdebi-core $ wget https://download2.rstudio.org/rstudio-server-0.99.491-amd64.deb $ sudo gdebi rstudio-server-0.99.491-amd64.deb I also recommend making the following changes to the configuration of the Shiny server - the /etc/shiny-server/shiny-server.conf file:
server { listen 3838; location /users { run_as :HOME_USER:; user_dirs; } location /apps { run_as shiny; site_dir /srv/shiny-server; log_dir /var/log/shiny-server; directory_index on; } } This will make it possible to conveniently launch the shiny applications developed in the Rstudio Server:
- In Rstudio, a ShinyApps folder is created in the root directory;
- Next File / New Project ../ New Directory / Shiny Web Application /;
- Fill in the Directory name, for example, test001;
- Choose ShinyApps as the project root directory.
To run the created application in the browser, just enter the address:
ip_shiny_server:3838/users/ubuntu_user_name/test001/where
ip_shiny_server is the IP address of the virtual machine, ubuntu_user_name is the username of Ubuntu.You also need to install PostgreSQL and the libpq-dev package:
$ apt-get install postgresql-9.4 $ sudo apt-get install libpq-dev You may also need Apach, for example, to share files, quickly view logs, etc .:
$ sudo apt-get install apache2 Now, for example, to get access to the folder001 of the test001 application, run the command:
$ sudo ln -s /home/ubuntu_user_name/ShinyApps/test001/folder001 /var/www/html/shared_folder After that, the contents of the folder will be available at: ip_shiny_server / shared_folder /
Web interface
A huge advantage of Shiny server applications, in my opinion, is: a) their web interface and b) that they are available on any device (PC, laptop, tablet, smartphone) with Internet access. This is an excellent cross-platform solution!
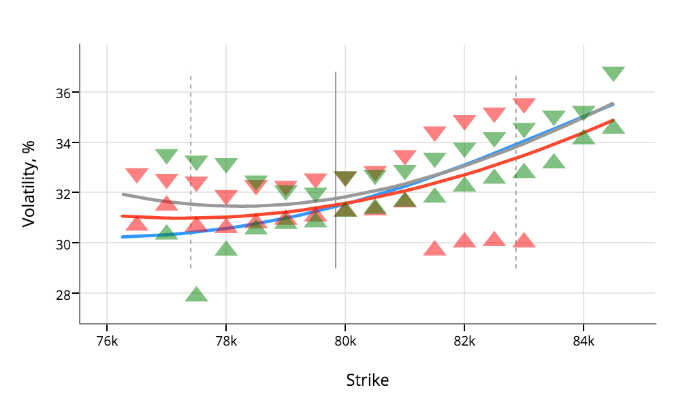
With the Shiny server running, I have the opportunity to analyze volatility, price options and monitor my position in any place where there is Internet access.
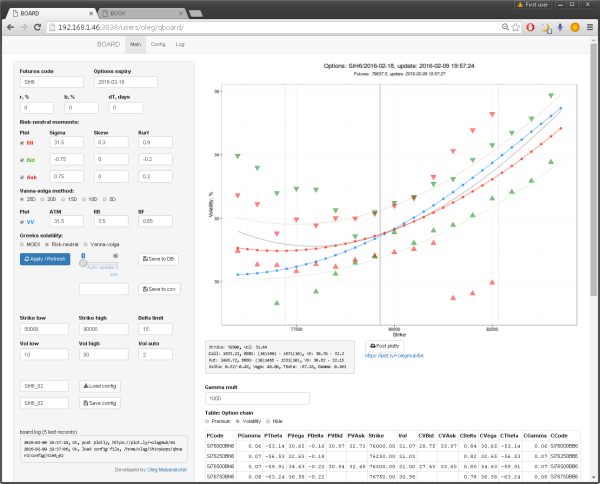
Fig. 4. Shiny interface for analyzing and modeling volatility smiles
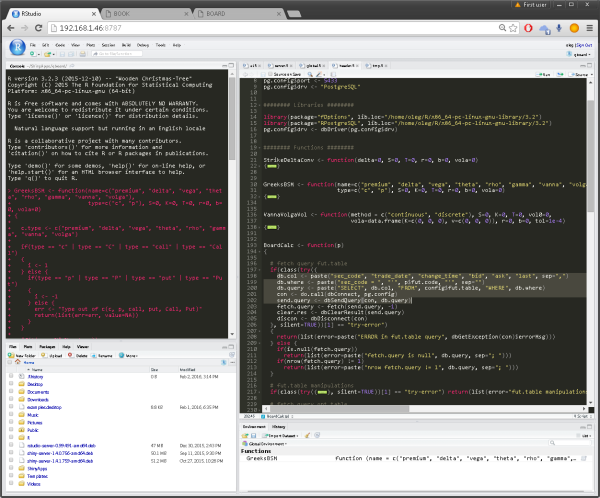
Rstudio Server also has a web interface, it is available on any device with a modern OS and Internet access - develop, fix bugs anywhere from any device.
Fig. 5. Interface of the Rstudio Server development environment
Volatility models
Currently, for pricing and market making, I use two models:
- Vanna-volga
- Risk-neutral moments
You can learn more about them from previous topics on my blog at quant-lab.com . Both models have proven themselves in trading options for USD / RUB.
Option pricing
Shiny provides the ability to build interactive graphics. You can hover the mouse or click on the area of interest graph and get the coordinates of this point. For example, my options pricing application processes the received coordinates and provides: a) market information in the specified strike (best bid / ask in points and volatilities plus their volumes; b) volatility, the theoretical price of call and put options for this volatility, and Greeks.

Fig. 6. Interactive optional calculator
Portfolio Calculations
Another shiny application I use every day is qbook. It allows you to evaluate my option positions and has very flexible settings: you can set the volatility of the option series manually or manually (or choose the exchange one, but I do not recommend you do this), you can adjust the time to expiration, model various scenarios - all this will be displayed in one graph and one label for easy comparison. Plus, a convenient presentation of the book - displays in which strike how many total options are sold / bought and their total Greeks.

Fig. 7. Scenarios of volatility and sensitivity indicators of the book
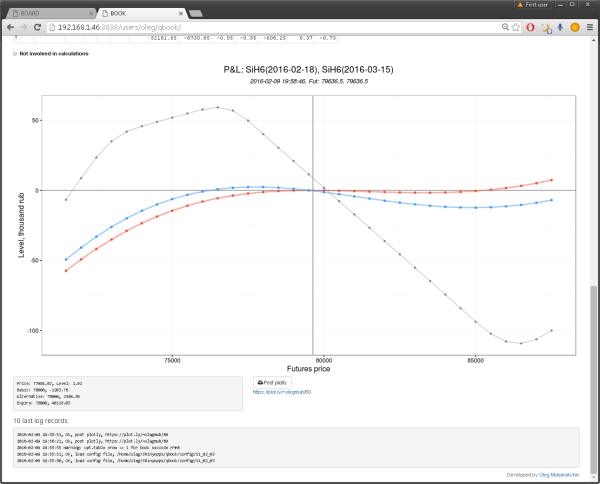
Fig. 8. P & L profile book for two scenarios and on the expiration of the near series
Sharing
Another nice and useful feature of Shiny apps is the simplicity with which you can share them. At least two solutions: share the whole application or only the results. To share the application hosted on the Shiny server, you need to forward port 3838 and give the user a link to the IP address of your router. This is not the best security solution. In my opinion it is much better to share only the results - it is very easy to organize, for example, using the plotly service. You can post the graph to the plotly cloud service directly from the Shiny app:
pp <- plotly_POST(p, filename=plotly.name, fileopt="overwrite") and give the user a link to this graph. Moreover plotly graphics can be embedded in your website or blog:
- As a conclusion I want to once again highlight the main points:
- The created solution is free (Shiny Server, Rstudio Server, VMware - have free versions)
- Shiny cross-platform applications, accessible from any modern device from anywhere in the world where there is Internet
- The numerical methods, models and algorithms used are taken from ready-made packages (out of the box) created by experienced programmers and mathematicians, robust and tested by a large number of experienced users.
- Application development is not a complicated and fast process.
- Interactive graphic data greatly simplifies pricing options and position analysis
Other materials on the development of trading software:
- How-to: Object-Oriented Python Backtesting
- Creating trading robots: 11 development tools
- How-to: a step-by-step guide to the development of a trading system for the stock market
- How-to: how to choose a programming language to create a trading robot
- Back to the Future: Testing a Trading Robot with Historical Data
- How-to: What to consider when developing the first trading robot
- How-to: What to consider when developing a strategy for a trading robot
- Books and educational resources on algorithmic trading
- Algorithmic and automated trading: 13 books on the subject
Source: https://habr.com/ru/post/277845/
All Articles