Work with data: New science
The volume of scientific data is increasing at an astonishing rate, therefore there is a need for new mathematical methods and methods of analysis. Data sets are becoming more and more complex in many disciplines related, for example, to neural networks, astrophysics or medicine.
Physicist from Northeastern University (USA) Alessandro Vespignani (Alessandro Vespignani) is engaged in modeling the stock market behavior, the prediction of election results and other statistical problems. It has several terabytes of data from social networks, and almost all of them are unstructured [data].
')
Vespignani uses a wide range of mathematical tools and methods to process the collected data. He sorts millions of tweets and searches by keywords. Vespignani effectively uses a phased approach to analyzing big data. However, Yale University mathematician Ronald Coifman (Ronald Coifman) argues that it is not enough to simply collect and store huge amounts of information, they need to be properly organized, and for this you need a special structure.
Vertices and edges
The city of Königsberg (now Kaliningrad), which emerged in the 13th century, consisted of three formally independent urban settlements that were located on the islands and banks of the Pregolya River, which divided the city into four main parts. These four plots of land were connected by seven bridges. In the 18th century, mathematician Leonard Euler puzzled over a riddle popular at that time: how to go through all seven bridges of Königsberg and return to the starting point without stepping on each of the bridges twice?
To solve it, Euler built a model of points and lines and found that the problem has a solution only if an even number of bridges lead to each "island of the earth". Since there was an odd number of bridges in Konigsberg, this trip was not possible.
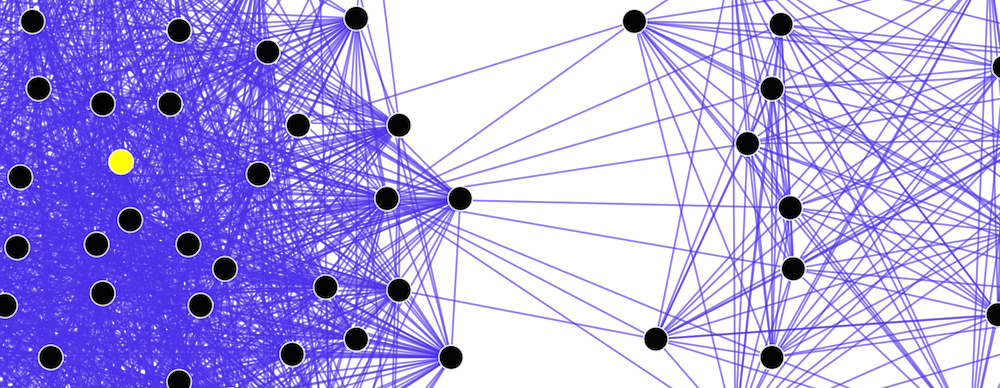
Based on Euler’s idea, Stanford University mathematician Gunnar Carlsson began building data maps, presenting bulky data sets as a network of vertices and edges. The approach is called topological data analysis (TDA - Topological Data Analysis), and, according to Gunnar, “allows you to structure unstructured data in order to later analyze them with machine learning methods”. In the video, Karlsson explains how topological analysis helps researchers interpret large data sets.
As is the case with the problem of bridges, everything is “connected” with connections, pardon the pun. Social networks are a map of relationships between people, where the peaks are names, and the edges are connections. Karlsson believes that this approach can be used in other areas, for example, to work with genomic sequences. “You can compare the sequence and identify the number of differences. The resulting number can be thought of as a function of distance, which will show how much they differ, ”explains Karlsson.
The Ayasdi project of Karlsson was created precisely for this: it allows you to simplify the presentation of high-dimensional data. If your multidimensional dataset has 155 variables, what will the query look like taking into account all of them all at once? Karlsson compares this problem with the search for a hammer in a dark garage. If you have a flashlight, then you will consistently look through the contents of the garage until you stumble upon the tool you need - this process is quite long and can ruffle you. It is much more effective to turn on the light - you will immediately find both a hammer and a box of nails, even though you did not know that you would need them. Ayasdi technology just lights a light bulb.
Using topological methods, we seem to be projecting a complex object onto a plane. The danger lies in the fact that some of the patterns - like illusions in the theater of shadows, and in fact do not exist. Moreover, a number of scientists believe that topological methods are generally not applicable to some data sets. If your data set is distorted or incomplete, then they can give completely incorrect results.
Occam's razor
In February 2004, Stanford University mathematician Emmanuel Candes tried to find a way to improve the blurred image. Kandes applied one of the developed algorithms and expected to see minor improvements, but a clear picture appeared before him. According to Candez, the probability of this was equal to the probability of guessing ten digits of a bank card number, knowing the first three. But that was not an accident. The method worked with other images.
The key to success was, so to speak, the mathematical version of Occam's razor: out of the millions of possible options for reconstructing a specific fuzzy image, the simplest version would be best. This discovery spawned the method Compressed sensing.
Today it is used in video broadcasting over the network. The amount of data when transferring video is so huge that you have to compress it. Usually, in order to compress the data, you must first get all the bits, and then discard the insignificant. The Compressed sensing method allows you to define significant bits without requiring them to be saved in advance.
“If I screen the population for a rare disease, do I need blood tests from all people?” The answer is no. It is enough to carry out only a few tests, since the desired “factor” is very rare, that is, it is rarefied, ”said Candés. Suppose we have one infected in a group of 32 people. We took blood from each of them for analysis. If the test is negative, then there is no infected. But if the result is positive, then how to find the infected?
Kandes believes that you can take half of the samples (16) and re-analyze. If the result is positive, then the infected person is in this group, if not, then in the other. Then the group is again divided in half, and the testing is repeated. Thus, you will receive an answer for 5 tests, instead of 32, if you check each separately. This is the essence of the method Compressed sensing.
Compressed sensing can help with large data sets, some of which have been lost or damaged. A good example would be the processing of medical records, in part of which have typos made by the staff of the polyclinic. Another example is the face recognition system: if a person wears glasses, you can still recognize him.
While Candes praises Compressed sensing, Carlsson takes a topological approach. However, these two methods only complement each other, but do not compete. “In the end, data science is more than just a sum of methodologies,” Vespignani insists. “By combining several methods, we can create something completely new.”
PS Most recently, we published a selection of sources on machine learning for beginners and talked about deep learning. Of course, we share our own experience: a little about the development of a quantum communication system and how advanced programmers are trained from simple students.
Source: https://habr.com/ru/post/277153/
All Articles