What does DEFAULT TRACE conceal in itself?

The first job is often remembered ... Mediocre office, Monique 943N and Pentium D heater underfoot. As Boris appeared out of nowhere (no ... not Boris "Razor") with a ruler in his hands and insistently asked not to hurt the server.
It was in those days when I first met the profiler. User traces turned out to be very useful when debugging applications and searching for slow queries. Then for myself I discovered DMV and XEvents ... and I began to use the profiler less often. The reason for this act is simple - traces are very resource-intensive.
')
However, this functionality should not be given prematurely to anathema. Starting with the 2005 version, when installing SQL Server , a lightweight system trail is created by default, which stores a lot of useful information.
It is located in the folder where SQL Server is installed and consists of five files with a trc extension. Each time you start the server, a new file is automatically created for tracing, and the oldest is overwritten. The recording of new events always goes to the most recent file, the size of which is limited to 20 MB. When the size is exceeded, a new file is created by the machine. Change this behavior is impossible.
It is only allowed to disable or enable this functionality:
EXEC sys.sp_configure 'show advanced options', 1 GO RECONFIGURE WITH OVERRIDE GO EXEC sys.sp_configure 'default trace enabled', 0 GO RECONFIGURE WITH OVERRIDE GO You can check that the default tracing is enabled by the following query:
SELECT name, value FROM sys.configurations WHERE configuration_id = 1568 Path to default trail:
SELECT [path], start_time, last_event_time, event_count FROM sys.traces WHERE is_default = 1 And now we start the most interesting ... Let's see what kind of events can be stored in the default trace:
SELECT e.trace_event_id, e.name, c.category_id, c.name FROM sys.trace_categories c JOIN sys.trace_events e ON c.category_id = e.category_id trace_event_id name category_id name -------------- -------------------------- ----------- ----------------------------------- 196 CLR 20 Assembly Load 92 Database 2 Data File Auto Grow 93 Database 2 Log File Auto Grow 94 Database 2 Data File Auto Shrink 95 Database 2 Log File Auto Shrink 79 Errors and Warnings 3 Missing Column Statistics 80 Errors and Warnings 3 Missing Join Predicate 67 Errors and Warnings 3 Execution Warnings 69 Errors and Warnings 3 Sort Warnings 55 Errors and Warnings 3 Hash Warning 21 Errors and Warnings 3 EventLog 22 Errors and Warnings 3 ErrorLog 213 Errors and Warnings 3 Database Suspect Data Page 214 Errors and Warnings 3 CPU threshold exceeded 46 Objects 5 Object:Created 47 Objects 5 Object:Deleted 164 Objects 5 Object:Altered ... And let's take a look at small examples of the practical benefits of information from the default trace.
1. Auto Grow Events
I hope it is no secret that to perform any transaction requires a certain disk space. In the data file or log. We will not elaborate ... but generally, if there is not enough space, then the file will automatically grow. At this point, the file is locked and SQL Server will wait until the disk subsystem performs the necessary operations to allocate disk space.
By default, SQL Server initializes the new disk space with zeros. For data files, this behavior can be disabled by using Instant File Initialization . But for log files, initialization will still occur and it is definitely slow. Therefore, it is recommended to keep track of Auto Grow events on an ongoing basis:
SELECT StartTime , Duration = Duration / 1000 , DatabaseName = DB_NAME(DatabaseID) , [FileName] , GrowType = CASE WHEN EventClass = 92 THEN 'DATA' ELSE 'LOG' END FROM sys.traces i CROSS APPLY sys.fn_trace_gettable([path], DEFAULT) t WHERE t.EventClass IN ( 92, -- Data File Auto Grow 93 -- Log File Auto Grow ) AND i.is_default = 1 And if their number increases dramatically:
StartTime Duration DatabaseName FileName GrowType -------------------- ----------- ---------------------- -------------------------- -------- 2016-01-16 02:52:48 36 tempdb templog LOG 2016-01-16 02:52:49 50 tempdb tempdev DATA 2016-01-16 02:52:50 216 tempdb tempdev DATA 2016-01-16 02:52:51 43 tempdb tempdev DATA 2016-01-16 02:52:52 760 tempdb tempdev DATA 2016-01-16 02:52:54 270 tempdb tempdev DATA 2016-01-16 02:52:55 273 tempdb tempdev DATA 2016-01-16 02:52:56 286 tempdb tempdev DATA 2016-01-16 02:52:58 206 tempdb tempdev DATA 2016-01-16 02:52:59 513 tempdb tempdev DATA 2016-01-16 02:53:01 363 tempdb tempdev DATA 2016-01-16 02:53:03 300 tempdb tempdev DATA 2016-01-16 02:53:05 303 tempdb tempdev DATA 2016-01-16 02:53:08 200 tempdb tempdev DATA 2016-01-16 02:53:10 60 tempdb tempdev DATA 2016-01-16 02:53:12 350 tempdb tempdev DATA 2016-01-16 02:53:15 370 tempdb tempdev DATA 2016-01-16 02:53:17 243 tempdb tempdev DATA 2016-01-16 02:53:21 446 tempdb tempdev DATA 2016-01-16 02:53:25 163 tempdb tempdev DATA 2016-01-16 02:53:30 286 tempdb tempdev DATA 2016-01-16 02:53:36 426 tempdb tempdev DATA 2016-01-16 02:53:42 376 tempdb tempdev DATA 2016-01-16 02:53:49 120 tempdb tempdev DATA 2016-01-16 02:53:58 200 tempdb tempdev DATA 2016-01-16 02:54:06 186 tempdb tempdev DATA 2016-01-16 02:54:17 43 tempdb tempdev DATA 2016-01-16 02:54:27 6 tempdb tempdev DATA 2016-01-16 02:54:42 3 tempdb tempdev DATA 2016-01-16 02:55:04 30 tempdb tempdev DATA 2016-01-16 14:19:47 63 AdventureWorks2012 AdventureWorks2012_Log LOG 2016-01-16 14:19:47 20 AdventureWorks2012 AdventureWorks2012_Log LOG 2016-01-16 16:51:32 100 tempdb tempdev DATA 2016-02-16 17:31:02 66 tempdb templog LOG ... This can cause not only file fragmentation on the disk, but also significant delays in the execution of queries:
SELECT GrowType = CASE WHEN EventClass = 92 THEN 'DATA' ELSE 'LOG' END , GrowCount = COUNT(1) , Duration = SUM(Duration) / 1000 FROM sys.traces i CROSS APPLY sys.fn_trace_gettable([path], DEFAULT) t WHERE t.EventClass IN (92, 93) AND i.is_default = 1 AND t.DatabaseID = DB_ID('tempdb') GROUP BY EventClass GrowType GrowCount Duration -------- ----------- -------------------- DATA 36 7296 LOG 2 102 Let's look at the settings of the problem database:
USE tempdb GO SELECT d.type_desc , d.name , d.physical_name , current_size_mb = ROUND(d.size * 8. / 1000, 0) , initial_size_mb = ROUND(m.size * 8. / 1000, 0) , auto_grow = CASE WHEN d.is_percent_growth = 1 THEN CAST(d.growth AS VARCHAR(10)) + '%' ELSE CAST(ROUND(d.growth * 8. / 1000, 0) AS VARCHAR(10)) + 'MB' END FROM sys.database_files d JOIN sys.master_files m ON d.[file_id] = m.[file_id] WHERE m.database_id = DB_ID('tempdb') The initial database size is 8 MB for the data file and 1 MB for the log:
type name physical_name current_size_mb initial_size_mb auto_grow ----- ---------- ------------------------------ ------------------ ------------------ --------- ROWS tempdev D:\SQL_2012\DATA\tempdb.mdf 258.000000 8.000000 10% LOG templog D:\SQL_2012\DATA\templog.ldf 3.000000 1.000000 1MB ... which is clearly not enough when compared with the current size. Moreover, it must be remembered that with each restart of SQL Server, tempdb is recreated. In the bottom line, with the next start we will again get a 9 MB file, delays in executing requests and a new batch of messages in the default trace.
What is the way out of this situation? Keep track of file sizes and reserve free space for them:
SELECT s.[file_id] , s.name , size = CAST(s.size * 8. / 1024 AS DECIMAL(18,2)) , space_used = CAST(t.space_used * 8. / 1024 AS DECIMAL(18,2)) , free_space = CAST((s.size - t.space_used) * 8. / 1024 AS DECIMAL(18,2)) , used_percent = CAST(t.space_used * 100. / s.size AS DECIMAL(18,2)) , s.max_size , s.growth , s.is_percent_growth FROM sys.database_files s CROSS APPLY ( SELECT space_used = FILEPROPERTY(s.name, 'SpaceUsed') ) t 2. Auto Shrink Events
Recently I wrote that the AUTO_CLOSE option decreases performance. So AUTO_SHRINK gets even worse ... Every 30 minutes, SQL Server tries to truncate free space in the database files. This process is quite resource-intensive and can lead to disk file fragmentation. When files are truncated, high index fragmentation occurs, which increases logical reads and reduces query performance.
Imagine a simple situation ... Delete the data from the table - truncating the file. We inserted new data - there was not enough space and SQL Server had to increase the file size. Delete the data and again everything in a new way ...
SELECT StartTime , EndTime , Duration = Duration / 1000 , DatabaseName = DB_NAME(DatabaseID) , [FileName] , GrowType = CASE WHEN EventClass = 94 THEN 'DATA' ELSE 'LOG' END , NTDomainName , ApplicationName , LoginName , TextData , IsSystem FROM sys.traces i CROSS APPLY sys.fn_trace_gettable([path], DEFAULT) t WHERE t.EventClass IN ( 94, -- Data File Auto Shrink 95 -- Log File Auto Shrink ) AND i.is_default = 1 StartTime Duration DatabaseName FileName GrowType ------------------- ----------- ------------------------- ------------------------ -------- 2016-02-10 11:57:54 116 AdventureWorks2012 AdventureWorks2012_Log LOG 2016-02-10 14:58:21 113 AdventureWorks2012 AdventureWorks2012_Log LOG 2016-02-10 19:30:02 113 AdventureWorks2012 AdventureWorks2012_Log LOG 2016-02-10 21:00:26 16 AdventureWorks2012 AdventureWorks2012_Log LOG Definitely advise this option to disable:
SELECT 'ALTER DATABASE ' + QUOTENAME(name) + ' SET AUTO_SHRINK OFF WITH NO_WAIT;' FROM sys.databases WHERE is_auto_shrink_on = 1 3. DBCC Events
Another utility of default tracing is the ability to track who and when launched the DBCC commands. You shouldn't usually blame DBCC CHECKDB , but if someone in production is crazy about performing:
DBCC SHRINKDATABASE DBCC FREEPROCCACHE DBCC DROPCLEANBUFFERS then you can easily trace it:
SELECT t.TextData, t.ApplicationName, t.LoginName, t.StartTime FROM sys.traces i CROSS APPLY sys.fn_trace_gettable([path], DEFAULT) t WHERE i.is_default = 1 AND t.EventClass = 116 -- Audit DBCC Event AND t.ApplicationName IS NOT NULL and with whom to conduct a preventive conversation about the benefits of standing in a corner on buckwheat:
TextData ApplicationName LoginName StartTime ----------------------- ------------------ ----------- ----------------------- DBCC SHRINKDATABASE(1) SSMS - Query PC\IgorS 2016-02-10 20:03:46.307 DBCC FREEPROCCACHE SSMS - Query PC\IgorS 2016-02-10 20:03:43.430 DBCC DROPCLEANBUFFERS SSMS - Query PC\IgorS 2016-02-10 20:03:44.767 4. Errors and Warnings Events
In a situation where SQL Server does not have enough free memory that is required to execute a query, the processing of the results of some statements will occur in tempdb . The same behavior will be when the optimizer has made an incorrect estimate of the expected number of rows.
Let's try to write a request that will call spills in tempdb :
SELECT * FROM Sales.SalesOrderHeader WHERE DueDate > ShipDate ORDER BY OrderDate DESC 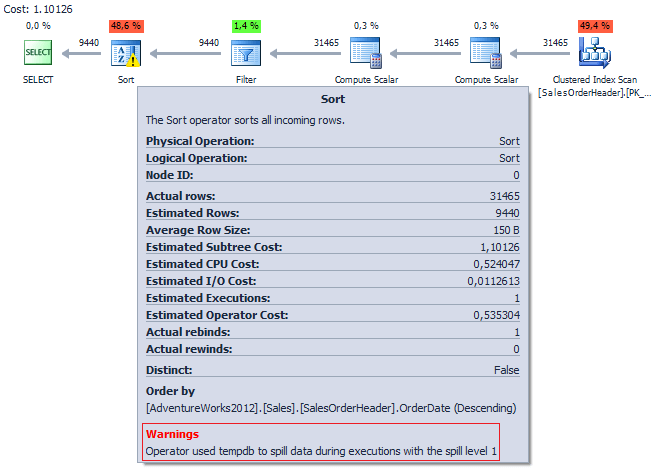
Thanks to the message from the default we can track such requests:
SELECT TOP(10) EventName = e.name , t.TextData , t.ApplicationName , t.LoginName , t.StartTime , DatabaseName = DB_NAME(t.DatabaseID) FROM sys.traces i CROSS APPLY sys.fn_trace_gettable([path], DEFAULT) t JOIN sys.trace_events e ON e.trace_event_id = t.EventClass WHERE i.is_default = 1 AND e.category_id = 3 ORDER BY t.StartTime DESC EventName ApplicationName LoginName StartTime DatabaseName ------------------ ----------------- ------------- ----------------------- --------------------- Sort Warnings SSMS - Query PC\SergeyS 2016-02-11 13:06:44.867 AdventureWorks2012 Find their execution plan and try to optimize the query:
USE AdventureWorks2012 GO SELECT TOP(5) p.query_plan , e.[text] , qyery_cost = p.query_plan.value( '(/*:ShowPlanXML/*:BatchSequence/*:Batch/*:Statements/*:StmtSimple/@StatementSubTreeCost)[1]', 'FLOAT' ) , s.last_execution_time , last_exec_ms = s.last_worker_time / 1000 , s.execution_count FROM sys.dm_exec_query_stats s CROSS APPLY sys.dm_exec_query_plan(s.plan_handle) p CROSS APPLY sys.dm_exec_sql_text(s.plan_handle) e WHERE e.[text] NOT LIKE '%sys%' AND s.last_execution_time >= DATEADD(MS, -2500, '2016-02-10 19:41:45.983') AND e.[dbid] = DB_ID() ORDER BY s.last_execution_time query_plan text qyery_cost execution_time last_exec_ms ----------------- -------------------------------- ----------- ------------------- -------------- <ShowPlanXML ... SELECT * FROM Sales.SalesOrde... 1,10126 2016-02-11 13:06:44 1538 By the way, the current execution plans are not available through the DMV . They can be obtained only at the Post Query Execution Showplan stage , through the corresponding Trace event , or by using the SET STATISTICS XML ON command. Starting with SQL Server 2012 , a new XEvent has been added specifically for this purpose - post_query_execution_showplan .
I am personally pleased that you can track all sorts of warnings:
SELECT DISTINCT d.SalesOrderID, d.UnitPrice, h.OrderDate FROM Sales.SalesOrderHeader h JOIN Sales.SalesOrderDetail d ON h.SalesOrderID = d.SalesOrderID WHERE h.DueDate > h.ShipDate 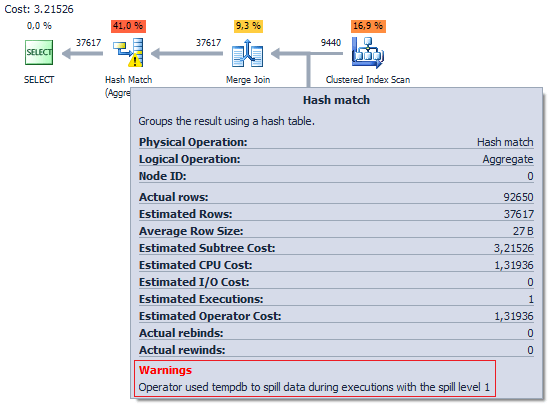
EventName ApplicationName LoginName StartTime DatabaseName ---------------- ----------------- ------------- ----------------------- --------------------- Hash Warning SSMS - Query PC\SergeyS 2016-02-11 13:14:44.433 AdventureWorks2012 For example, when you mistakenly forgot to specify the fields for which the connection is:
SELECT * FROM Sales.Currency c, Sales.CountryRegionCurrency r --WHERE c.CurrencyCode = r.CurrencyCode 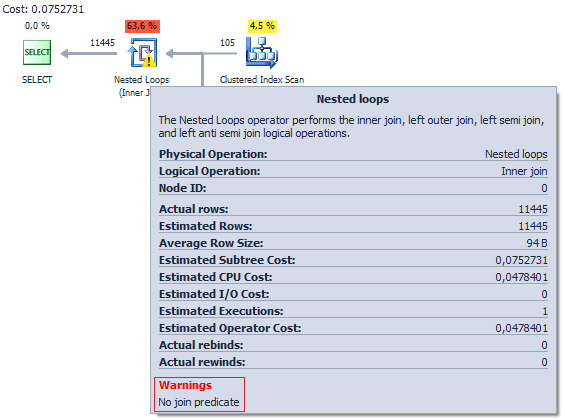
EventName ApplicationName LoginName StartTime DatabaseName ----------------------- ----------------- ------------- ------------------- --------------------- Missing Join Predicate SSMS - Query PC\SergeyS 2016-02-11 13:18:20 AdventureWorks2012 or, when there is no statistics on the column that is filtered:
SELECT DatabaseLogID FROM dbo.DatabaseLog WHERE PostTime = '2012-03-14 13:14:18.847' 
EventName TextData DatabaseName --------------------------- ------------------------------------------ -------------------- Missing Column Statistics NO STATS:([dbo].[DatabaseLog].[PostTime]) AdventureWorks2012 5. Object Events
In the default trace, you can track the creation and deletion of objects:
USE [master] GO IF DB_ID('test') IS NOT NULL DROP DATABASE [test] GO CREATE DATABASE [test] GO USE [test] GO CREATE TABLE dbo.tbl (ID INT) GO ALTER TABLE dbo.tbl ADD Col VARCHAR(20) GO CREATE UNIQUE CLUSTERED INDEX ix ON dbo.tbl (ID) GO USE [master] GO IF DB_ID('test') IS NOT NULL DROP DATABASE [test] GO SELECT EventType = e.name , t.DatabaseName , t.ApplicationName , t.LoginName , t.StartTime , t.ObjectName , ObjectType = CASE t.ObjectType WHEN 8259 THEN 'Check Constraint' WHEN 8260 THEN 'Default Constraint' WHEN 8262 THEN 'Foreign Key' WHEN 8272 THEN 'Stored Procedure' WHEN 8274 THEN 'Rule' WHEN 8275 THEN 'System Table' WHEN 8276 THEN 'Server Trigger' WHEN 8277 THEN 'Table' WHEN 8278 THEN 'View' WHEN 8280 THEN 'Extended Stored Procedure' WHEN 16724 THEN 'CLR Trigger' WHEN 16964 THEN 'Database' WHEN 17222 THEN 'FullText Catalog' WHEN 17232 THEN 'CLR Stored Procedure' WHEN 17235 THEN 'Schema' WHEN 17985 THEN 'CLR Aggregate Function' WHEN 17993 THEN 'Inline Table-valued SQL Function' WHEN 18000 THEN 'Partition Function' WHEN 18004 THEN 'Table-valued SQL Function' WHEN 19280 THEN 'Primary Key' WHEN 19539 THEN 'SQL Login' WHEN 19543 THEN 'Windows Login' WHEN 20038 THEN 'Scalar SQL Function' WHEN 20051 THEN 'Synonym' WHEN 20821 THEN 'Unique Constraint' WHEN 21075 THEN 'Server' WHEN 21076 THEN 'Transact-SQL Trigger' WHEN 21313 THEN 'Assembly' WHEN 21318 THEN 'CLR Scalar Function' WHEN 21321 THEN 'Inline scalar SQL Function' WHEN 21328 THEN 'Partition Scheme' WHEN 21333 THEN 'User' WHEN 21572 THEN 'Database Trigger' WHEN 21574 THEN 'CLR Table-valued Function' WHEN 21587 THEN 'Statistics' WHEN 21825 THEN 'User' WHEN 21827 THEN 'User' WHEN 21831 THEN 'User' WHEN 21843 THEN 'User' WHEN 21847 THEN 'User' WHEN 22601 THEN 'Index' WHEN 22611 THEN 'XMLSchema' WHEN 22868 THEN 'Type' END FROM sys.traces i CROSS APPLY sys.fn_trace_gettable([path], DEFAULT) t JOIN sys.trace_events e ON t.EventClass = e.trace_event_id WHERE e.name IN ('Object:Created', 'Object:Deleted', 'Object:Altered') AND t.ObjectType != 21587 AND t.DatabaseID != 2 AND i.is_default = 1 AND t.EventSubClass = 1 EventType DatabaseName ApplicationName StartTime ObjectName ObjectType ---------------- -------------- ---------------- ----------------------- ------------- ------------ Object:Created test SSMS - Query 2016-02-11 13:36:46.727 NULL Database Object:Created test SSMS - Query 2016-02-11 13:36:46.760 tbl Table Object:Altered test SSMS - Query 2016-02-11 13:36:46.803 tbl Table Object:Created test SSMS - Query 2016-02-11 13:36:46.837 ix Index Object:Deleted test SSMS - Query 2016-02-11 13:36:56.347 NULL Database 6. Server Events
Also, through the default trace, there is an opportunity to keep track of who made backups and restores the bases when it was done:
SELECT CASE WHEN t.EventSubClass = 1 THEN 'BACKUP' ELSE 'RESTORE' END, t.TextData, t.ApplicationName, t.LoginName, t.StartTime FROM sys.traces i CROSS APPLY sys.fn_trace_gettable([path], DEFAULT) t WHERE i.is_default = 1 AND t.EventClass = 115 -- Audit Backup/Restore Event TextData ApplicationName LoginName StartTime -------------------- ------------------------------- ----------- ------------------------- BACKUP DATABASE SSMS - Query PC\SergeyS 2016-01-21 13:05:26.390 RESTORE DATABASE dbForge Studio for SQL Server PC\SergeyS 2016-01-22 12:46:45.717 BACKUP DATABASE SQLCMD sa 2016-01-24 10:16:40.317 Or track the memory usage of SQL Server nd:
SELECT t.StartTime , [Type] = CASE WHEN EventSubClass = 1 THEN 'UP' ELSE 'DOWN' END , t.IntegerData FROM sys.traces i CROSS APPLY sys.fn_trace_gettable([path], DEFAULT) t WHERE t.EventClass = 81 -- Server Memory Change AND i.is_default = 1 StartTime Type IntegerData ------------------------ ----- ----------- 2016-02-10 02:52:42.887 UP 191 2016-02-10 02:53:00.640 UP 371 2016-02-10 02:53:34.917 UP 734 2016-02-10 02:53:52.140 UP 916 2016-02-10 10:05:00.027 DOWN 736 2016-02-10 10:17:17.417 UP 921 2016-02-10 11:52:14.930 DOWN 735 2016-02-10 12:00:32.577 DOWN 553 2016-02-10 13:06:11.540 UP 751 2016-02-10 15:11:10.487 UP 936 2016-02-10 15:15:26.107 DOWN 714 Small afterword
Default tracing is powerful enough to track server status. Of course, it has many drawbacks, for example, the mentioned 20 MB limit and the statement from Microsoft that this functionality has been deprecated since SQL Server 2008 . But nevertheless, sometimes the default trace can be very useful at the stage of initial diagnostics of problems with SQL Server . I hope my examples could show it clearly.
Everything was tested on Microsoft SQL Server 2012 (SP3) (KB3072779) - 11.0.6020.0 (X64) .
If you want to share this article with an English-speaking audience:
Hidden gems of DEFAULT TRACE in SQL Server
Source: https://habr.com/ru/post/277053/
All Articles