Log server Elasticsearch + Logstash + Kibana4 + Beats (windows / linux). Installation and Setup
There was a question of centralized storage and processing of logs from servers based on Linux and Windows. My choice fell on products from Elastic.
Most of the articles I read on installing Elastic applications seemed rather vague and incomplete to me.
The main and only source of information that I used: www.elastic.co/guide/index.html .
This manual is of course not exhaustive, but is sufficient for the initial installation and configuration of the working log server elasticsearch + logtash + kibana4 + beats (windows \ linux-agents).
Detailed information, additional features, and also “real kung-fu” are available in the official documentation .
')
From words to deeds.
I will not describe the installation of Ubuntu Server; comprehensive information is available on the web .
Updating:
Edit hosts and hostname:
Install Java 8:
We create catalogs that we need for packing packages:
Most of the articles I read on installing Elastic applications seemed rather vague and incomplete to me.
The main and only source of information that I used: www.elastic.co/guide/index.html .
This manual is of course not exhaustive, but is sufficient for the initial installation and configuration of the working log server elasticsearch + logtash + kibana4 + beats (windows \ linux-agents).
Detailed information, additional features, and also “real kung-fu” are available in the official documentation .
')
From words to deeds.
We will collect and glue
- Logstash-2.2.0 - processing incoming logs
- Elasticsearch-2.2.0 - log storage
- Kibana-4.2.2 - web interface
- Topbeat 1.1.0 - Getting information about the infrastructure of Linux-systems
- Filebeat 1.1.0 - Display logs in real-time Linux-systems
- Packetbeat 1.1.0 - Analysis of packet data in a network of Linux-systems
- Winlogbeat 1.1.0 - Analysis of Windows logs.
- Operating System - Ubuntu Server 14.04 (trusty) x86_x64
I will not describe the installation of Ubuntu Server; comprehensive information is available on the web .
Training
Updating:
sudo apt-get update && apt-get upgrade Edit hosts and hostname:
sudo vi /etc/hosts 127.0.0.1 localhost 10.0.10.33 elk-server.ss.lu elk-server sudo echo “elk-server.ss.lu” > /etc/hostname sudo service hostname restart && /etc/init.d/networking restart Install Java 8:
sudo add-apt-repository -y ppa:webupd8team/java sudo apt-get update sudo apt-get -y install oracle-java8-installer We create catalogs that we need for packing packages:
sudo mkdir -p ~/ELK/releases/beats/filebeat/ sudo mkdir -p ~/ELK/releases/beats/packetbeat/ sudo mkdir -p ~/ELK/releases/beats/topbeat/ sudo mkdir -p ~/ELK/releases/beats/winlogbeat Install Elasticsearch:
Go to the website www.elastic.co/downloads/elasticsearch and download the current (2.2.0) version:
Install:
We edit the configuration /etc/elasticsearch/elasticsearch.yml:
Uncomment and edit the cluster.name and node.name sinks:
(instead of "elk-server.ss.lu" and "mynodename" you can insert your own values)
It should work like this:
Add to autoload:
Run:
Checking:
The correct conclusion:
sudo cd ~/ELK/releases/ sudo wget https://download.elasticsearch.org/elasticsearch/release/org/elasticsearch/distribution/deb/elasticsearch/2.2.0/elasticsearch-2.2.0.deb Install:
sudo dpkg –i elasticsearch-2.2.0.deb We edit the configuration /etc/elasticsearch/elasticsearch.yml:
Uncomment and edit the cluster.name and node.name sinks:
sudo sed -i "s|# cluster.name: my-application|cluster.name: elk-server.ss.lu|" /etc/elasticsearch/elasticsearch.yml sudo sed -i "s|# node.name: node-1| node.name: mynodename|" /etc/elasticsearch/elasticsearch.yml (instead of "elk-server.ss.lu" and "mynodename" you can insert your own values)
It should work like this:
cluster.name: elk-server.ss.lu
node.name: mynodename
Add to autoload:
sudo update-rc.d elasticsearch defaults 95 10 Run:
sudo /etc/init.d/elasticsearch start Checking:
sudo curl http://localhost:9200 The correct conclusion:
{ "name" : "qq", "cluster_name" : "elk-server.qq.qu", "version" : { "number" : "2.2.0", "build_hash" : "8ff36d139e16f8720f2947ef62c8167a888992fe", "build_timestamp" : "2016-01-27T13:32:39Z", "build_snapshot" : false, "lucene_version" : "5.4.1" }, "tagline" : "You Know, for Search" Install Logstash:
Download the current (2.2.0) version of Logstash www.elastic.co/downloads/logstash and install:
Create an INPUT file for “bits” ...
... and copy the code there:
This will mean that logstash will start listening to port 5044. This port is the default for this version and will be spelled out in bits. You can ask any other.
Creating an OUTPUT file ...
... and copy the code there to communicate with elasticsearch:
We check the config for errors, run it, and enter it into autorun:
Check port:
Example of successful work:
sudo cd ~/ELK/releases/ sudo wget https://download.elastic.co/logstash/logstash/packages/debian/logstash_2.2.0-1_all.deb sudo dpkg –i logstash_2.2.0-1_all.deb Create an INPUT file for “bits” ...
sudo vi /etc/logstash/conf.d/input-beats.conf ... and copy the code there:
input { beats { port => 5044 } } This will mean that logstash will start listening to port 5044. This port is the default for this version and will be spelled out in bits. You can ask any other.
Creating an OUTPUT file ...
sudo vi /etc/logstash/conf.d/output-elasticsearch.conf ... and copy the code there to communicate with elasticsearch:
output { elasticsearch { hosts => ["localhost:9200"] sniffing => true manage_template => false index => "%{[@metadata][beat]}-%{+YYYY.MM.dd}" document_type => "%{[@metadata][type]}" } } We check the config for errors, run it, and enter it into autorun:
sudo service logstash configtest sudo service logstash restart sudo update-rc.d logstash defaults 96 9 Check port:
netstat -a | grep 5044 Example of successful work:
tcp6 0 0 [::]:5044 [::]:* LISTEN Install Kibana
Download and install the public key:
Add a repository:
Update the repository and install:
Run:
Connect:

We are asked to create the first index, but for now we leave everything as it is and move on to setting up clients.
sudo wget -qO - https://packages.elastic.co/GPG-KEY-elasticsearch | sudo apt-key add - Add a repository:
sudo echo "deb http://packages.elastic.co/kibana/4.4/debian stable main" | sudo tee -a /etc/apt/sources.list Update the repository and install:
sudo apt-get update && sudo apt-get install kibana sudo update-rc.d kibana defaults 95 10 Run:
sudo service kibana start Connect:
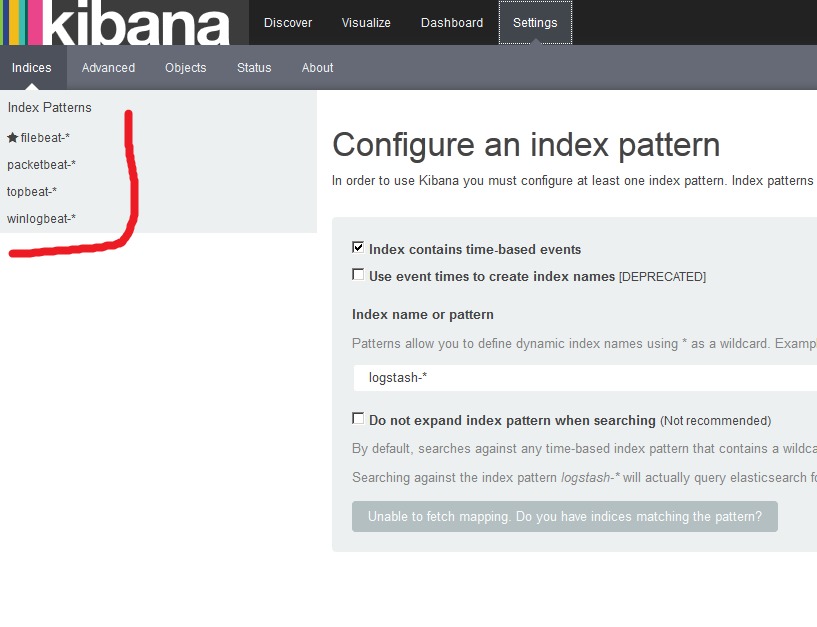
http://ip_elk-server.ss.lu:5601 We are asked to create the first index, but for now we leave everything as it is and move on to setting up clients.
Beats
We put on customers. To begin with, download and install several ready-made Kibana dashboards with Beats indices:
Go to the web:
And we see that Kibana dashboards with Beats indices were added:
cd ~/ELK/releases/beats/ sudo curl -L -O http://download.elastic.co/beats/dashboards/beats-dashboards-1.1.0.zip sudo unzip beats-dashboards-1.1.0.zip cd beats-dashboards-1.1.0/ ./load.sh Go to the web:
http://ip_elk-server.ss.lu:5601 And we see that Kibana dashboards with Beats indices were added:
Topbeat 1.1.0 (Linux)
Retrieving server infrastructure data.
Transmits information about the processor, memory usage. For each process, information about parents, pid, status, etc. is displayed. Also Topbeat allows you to view information about the file system - the state of the disks, the amount of free space, etc.
Installation (on client):
You need to add Topbeat index templates to the server so that Elasticsearch can correctly analyze input information:
With a successful download, we should see:
The topbeat.template.json file is created when you install Topbeat and has a default location of /etc/topbeat/topbeat.template.json. Therefore, if for some reason we will not install Beats clients on the ELK server, we will need to copy this template from the client to the server, or create this file on the server and copy its contents there (from the client). And then download it curl -XPUT 'eel_server_server: 9200 / _template / topbeat' -d@/PATH/topbeat.template.json .
But we will assume that the Bits are installed on the server and have the following location /etc/topbeat/topbeat.template.json .
We edit the config (on the client):
In the output block, you need to comment on the appeal to elasticsearch, because we will use logstash:
Uncomment the block with Logstash, specify its IP address and port:
Important: do not use tabs to move the cursor in the config! Only spaces. Otherwise, you get an error:
If the Logstash server is located on the external network, then the forward server of the port must be configured on the remote server's firewall, in this case 5044 (tcp / udp).
Additional logging options are well described in configs.
We start the service:
Open the Kibana interface and observe the incoming information:
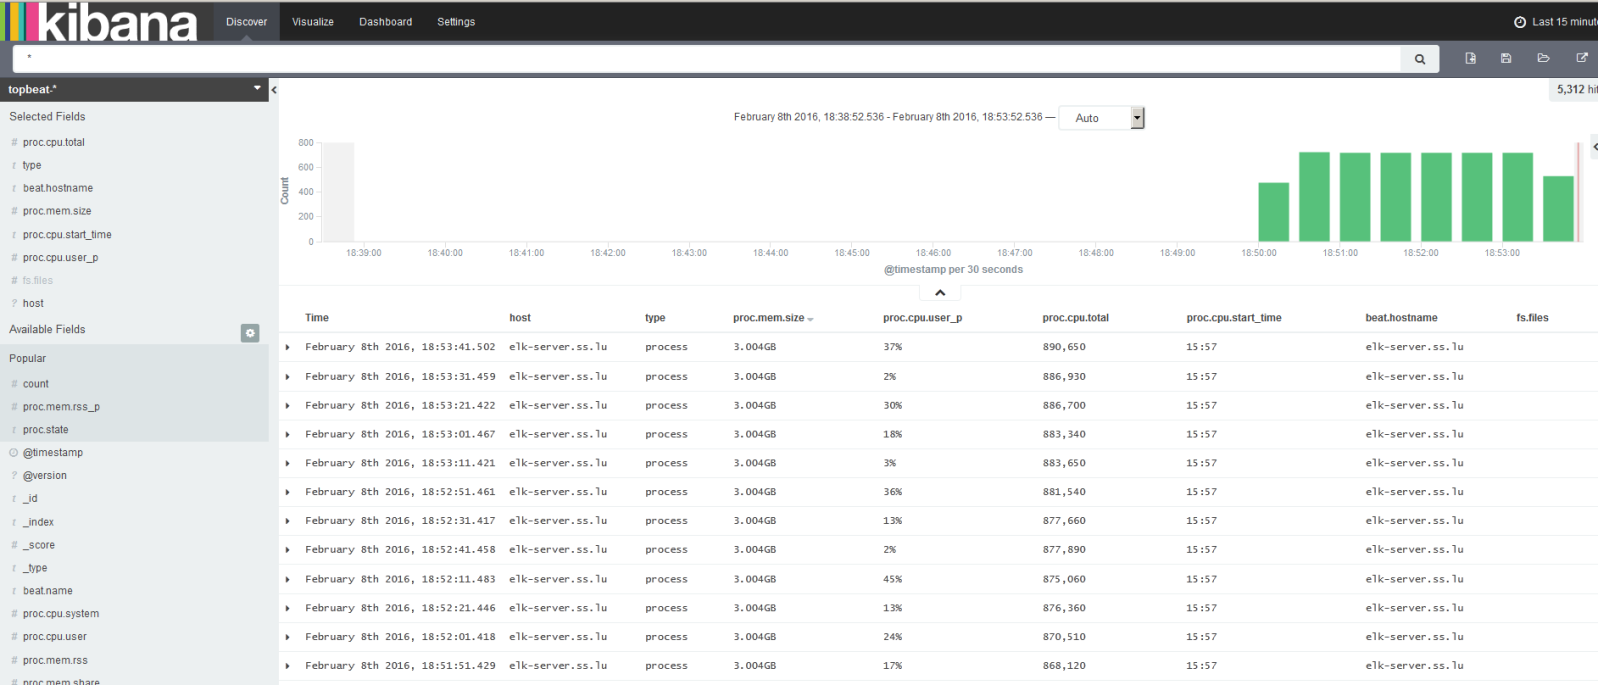
Transmits information about the processor, memory usage. For each process, information about parents, pid, status, etc. is displayed. Also Topbeat allows you to view information about the file system - the state of the disks, the amount of free space, etc.
Installation (on client):
cd ~/ELK/releases/beats/topbeat/ sudo curl -L -O https://download.elastic.co/beats/topbeat/topbeat_1.1.0_amd64.deb sudo dpkg -i topbeat_1.1.0_amd64.deb You need to add Topbeat index templates to the server so that Elasticsearch can correctly analyze input information:
sudo curl -XPUT 'http://localhost:9200/_template/topbeat' -d@/etc/topbeat/topbeat.template.json With a successful download, we should see:
{"acknowledged":true}
The topbeat.template.json file is created when you install Topbeat and has a default location of /etc/topbeat/topbeat.template.json. Therefore, if for some reason we will not install Beats clients on the ELK server, we will need to copy this template from the client to the server, or create this file on the server and copy its contents there (from the client). And then download it curl -XPUT 'eel_server_server: 9200 / _template / topbeat' -d@/PATH/topbeat.template.json .
But we will assume that the Bits are installed on the server and have the following location /etc/topbeat/topbeat.template.json .
We edit the config (on the client):
sudo vi /etc/topbeat/topbeat.yml In the output block, you need to comment on the appeal to elasticsearch, because we will use logstash:
### Elasticsearch as output #elasticsearch: #hosts: ["localhost:9200"] Uncomment the block with Logstash, specify its IP address and port:
logstash: hosts: ["ip_elk-server.ss.lu:5044"] Important: do not use tabs to move the cursor in the config! Only spaces. Otherwise, you get an error:
Loading config file error: YAML config parsing failed on /etc/topbeat /topbeat.yml: yaml: line 14: found character that cannot start any token. Exiting. If the Logstash server is located on the external network, then the forward server of the port must be configured on the remote server's firewall, in this case 5044 (tcp / udp).
Additional logging options are well described in configs.
We start the service:
sudo /etc/ini.d/topbeat start Open the Kibana interface and observe the incoming information:
Filebeat 1.1.0 (LINUX)
Transmits information from dynamic files to the server, which we will specify:
Setting:
Add indexes on the server (by analogy with how we set up Topbeat. Ie, if there is no template on the server, we create it):
Open the config:
Specify from which files we will take information (by default, all files from / var / log are with the .log extension):
We specify what we need on this client, for example:
Remember about the lack of tabs in the code!
We will also use logstash to handle indexes:
Run:
We look the information from Filebeat:

Setting:
cd ~/ELK/releases/beats/filebeat/ sudo curl -L -O https://download.elastic.co/beats/filebeat/filebeat_1.1.0_amd64.deb sudo dpkg -i filebeat_1.1.0_amd64.deb Add indexes on the server (by analogy with how we set up Topbeat. Ie, if there is no template on the server, we create it):
sudo curl -XPUT 'http://localhost:9200/_template/filebeat?pretty' -d@/etc/filebeat/filebeat.template.json Open the config:
sudo vi /etc/filebeat/filebeat.yml Specify from which files we will take information (by default, all files from / var / log are with the .log extension):
prospectors: paths: - /var/log/*.log We specify what we need on this client, for example:
paths: # - /var/log/*.log - /var/log/elasticsearch/*.log - /var/log/syslog - /var/log/nginx/*.log # - c:\programdata\elasticsearch\logs\* Remember about the lack of tabs in the code!
We will also use logstash to handle indexes:
### Elasticsearch as output #elasticsearch: # Array of hosts to connect to. # Scheme and port can be left out and will be set to the default (http and 9200) # In case you specify and additional path, the scheme is required: http://localhost:9200/path # IPv6 addresses should always be defined as: https://[2001:db8::1]:9200 #hosts: ["localhost:9200"] ... ### Logstash as output logstash: # The Logstash hosts hosts: ["ip_elk-server.ss.lu:5044"] Run:
sudo /etc/init.d/filebeat start We look the information from Filebeat:
Packetbeat 1.1.0 (Linux)
Very useful tool. Analyzes traffic between servers. Instantly detects errors. Analyzes protocols DNS, HTTP, MySQL, PostgreSQL, GLC, Memcache and others.
It is configured in the same way as Topbeat / Filebeat:
Edit the cofig (comment on Elasticsearch and set up Logstash)
output:
Go to the server and add an index for Packetbeat:
Run:
It is configured in the same way as Topbeat / Filebeat:
sudo apt-get install libpcap0.8 sudo curl -L -O https://download.elastic.co/beats/packetbeat/packetbeat_1.1.0_amd64.deb sudo dpkg -i packetbeat_1.1.0_amd64.deb Edit the cofig (comment on Elasticsearch and set up Logstash)
output:
#elasticsearch: #hosts: ["localhost:9200"] logstash: hosts: ["ip_elk-server.ss.lu:5044""] Go to the server and add an index for Packetbeat:
sudo curl -XPUT 'http://localhost:9200/_template/packetbeat' -d@/etc/packetbeat/packetbeat.template.json Run:
sudo /etc/ini.d/packetbeat start Winlogbeat (Windows)
Download www.elastic.co/downloads/beats/winlogbeat . Unpack in C: \ and rename to Winlogbeat. Start PowerShell from admin and install the service:
If we see a message stating that scripts are disabled on the system by default (and it will be so), then we simply create a policy for Winlogbeat:
Before starting the service, we rule in the config - C: \ Winlogbeat \ winlogbeat.yml.
The event_logs block lists the main system logs that need to be transported to Logstash:
In event_logs, you can add other magazines, a list of which can be viewed as:
If the system is higher than Vista, then you can specify the channels:
Next we need to upload the indexes for winlogbeat to the server as we did for topbeat, filebeat, packetbeat. This can be done remotely:
There are problems with this method, you can do the following:
Create an index file on the server winlogbeat.template.json
sudo vi ~ / ELK / releases / beats / winlogbeat / winlogbeat.template.json. On the Windows client, open the file C: \ winlogbeat \ winlogbeat.template.json and copy its contents into the file ~ / ELK / releases / beats / winlogbeat / winlogbeat.template.json .
Then (on the server) we load this index on elasticsearch so that it can correctly analyze the information and provide it with the usual format:
Go to the directory where we have created the file winlogbeat.template.json .
The output should be:
We go to the client and run the service winlogbeat. After this, we begin to monitor the data through Kibana, defining the view from the loaded indexes:
We look at dashboards:

PS C:\Users\Administrator> cd 'C:\Winlogbeat' PS C:\Winlogbeat> .\install-service-winlogbeat.ps1 If we see a message stating that scripts are disabled on the system by default (and it will be so), then we simply create a policy for Winlogbeat:
PowerShell.exe -ExecutionPolicy UnRestricted -File .\install-service-winlogbeat.ps1 Security warning Run only scripts that you trust. While scripts from the internet can be useful, this script can potentially harm your computer. If you trust this script, use the Unblock-File cmdlet to allow the script to run without this warning message. Do you want to run C:\Program Files\Winlogbeat\install-service-winlogbeat.ps1? [D] Do not run [R] Run once [S] Suspend [?] Help (default is "D"): R Status Name DisplayName ------ ---- ----------- Stopped winlogbeat winlogbeat Before starting the service, we rule in the config - C: \ Winlogbeat \ winlogbeat.yml.
output: #elasticsearch: # hosts: localhost:9200 logstash: hosts: ["ip_elk-server.ss.lu:5044"] The event_logs block lists the main system logs that need to be transported to Logstash:
winlogbeat: registry_file: C:/ProgramData/winlogbeat/.winlogbeat.yml event_logs: - name: Application - name: Security - name: System logging: to_files: true files: path: C:/winlogbeat/winlogbeat/Logs level: info In event_logs, you can add other magazines, a list of which can be viewed as:
PS C:\Users\Administrator> Get-EventLog * If the system is higher than Vista, then you can specify the channels:
PS C:\Users\Administrator> Get-WinEvent -ListLog * | Format-List -Property LogName Next we need to upload the indexes for winlogbeat to the server as we did for topbeat, filebeat, packetbeat. This can be done remotely:
PS C:\Winlogbeat> Invoke-WebRequest -Method Put -InFile winlogbeat.template.json -Uri http://IP_address_elk-server:9200/_template/winlogbeat?pretty There are problems with this method, you can do the following:
Create an index file on the server winlogbeat.template.json
sudo vi ~ / ELK / releases / beats / winlogbeat / winlogbeat.template.json. On the Windows client, open the file C: \ winlogbeat \ winlogbeat.template.json and copy its contents into the file ~ / ELK / releases / beats / winlogbeat / winlogbeat.template.json .
{ "mappings": { "_default_": { "_all": { "enabled": true, "norms": { "enabled": false } }, "dynamic_templates": [ { "template1": { "mapping": { "doc_values": true, "ignore_above": 1024, "index": "not_analyzed", "type": "{dynamic_type}" }, "match": "*" } } ], "properties": { "@timestamp": { "type": "date" }, "message": { "index": "analyzed", "type": "string" } } } }, "settings": { "index.refresh_interval": "5s" }, "template": "winlogbeat-*" } Then (on the server) we load this index on elasticsearch so that it can correctly analyze the information and provide it with the usual format:
Go to the directory where we have created the file winlogbeat.template.json .
cd ~/ELK/releases/beats/winlogbeat ll 12 drwxr-xr-x 2 root root 4096 . 8 23:10 ./ drwxr-xr-x 7 root root 4096 . 8 16:00 ../ -rw-r--r-- 1 root root 729 . 8 23:10 winlogbeat.template.json # sudo curl -XPUT 'http://localhost:9200/_template/winlogbeat' -d@winlogbeat.template.json The output should be:
{"acknowledged":true}
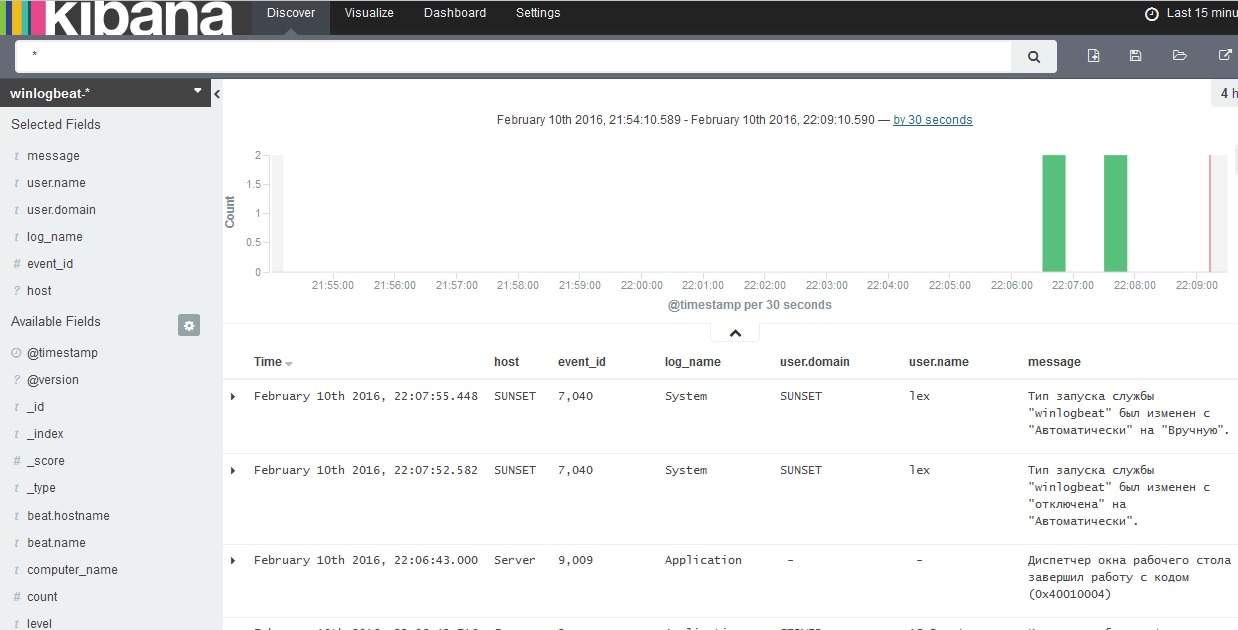
We go to the client and run the service winlogbeat. After this, we begin to monitor the data through Kibana, defining the view from the loaded indexes:
We look at dashboards:
Logs and logs
View indexes:
Delete all indexes:
Instead of * you can specify an unwanted index, for example:
curl -XDELETE 'localhost: 9200 / winlogbeat-2016.02.10'
To delete old logs, you need to install the "Python" module:
If pip is not installed, then install:
Configure Cron:
View nodes:
View Elasticsearch job status:
That's all.
This is enough to run a full-fledged log server, scatter conveyors to customers and understand the principles.
Additional settings (optimization, geoip settings, etc.) are described in the official documentation and configs.
curl 'localhost:9200/_cat/indices?v' Delete all indexes:
curl -XDELETE 'localhost:9200/*' Instead of * you can specify an unwanted index, for example:
curl -XDELETE 'localhost: 9200 / winlogbeat-2016.02.10'
To delete old logs, you need to install the "Python" module:
pip install elasticsearch-curator If pip is not installed, then install:
apt-get install python-pip Configure Cron:
crontab -e # 5 : 20 0 20 0 * * * root /usr/local/bin/curator --host localhost delete --disk-space 5 >/dev/null # , , 30 : 20 0 * * * root /usr/local/bin/curator --host localhost delete --older-than 30 >/dev/null View nodes:
curl 'localhost:9200/_cat/nodes?v' View Elasticsearch job status:
curl 'localhost:9200/_cat/health?v' That's all.
This is enough to run a full-fledged log server, scatter conveyors to customers and understand the principles.
Additional settings (optimization, geoip settings, etc.) are described in the official documentation and configs.
Source: https://habr.com/ru/post/277029/
All Articles