Remote debugging javascript with VS2015. Part 2
I propose a translation of the article "VS2015 Remote Debugging JavaScript - Part 2" .
Earlier, we discussed how to remotely debug JS code running in IE. The same case is not fundamentally different; all we need is to select another target process for connecting the debugger.
Here is the code for the page that I will use for debugging - simple. I saved it as TestLeak.html.
')
Remote debugging of JS running inside Web Browser Control
Earlier, we discussed how to remotely debug JS code running in IE. The same case is not fundamentally different; all we need is to select another target process for connecting the debugger.
HTML demo page
Here is the code for the page that I will use for debugging - simple. I saved it as TestLeak.html.
<!DOCTYPE html> <html> <head> <style> body.segoe { font-family: "Segoe UI", Verdana, serif; } </style> <script type="text/javascript"> function throwError() { document.getElementById("leakedDiv").appendChild("<p>It worked!</p>"); // Misspelled LeakedDiv (L is upper case) } </script> </head> <body class="segoe" id="leakedDiv"> <div> <input id="btnThrowError" type="button" value="Throw an error"onclick="throwError()" /> </div> </body> </html> ')
WinForms demo application with Web Browser Control
- Launch Visual Studio
- Create a new WinForms application.
- For example, call the project TestApp and, if necessary, further configure
- Create a simple form with 2 buttons, 1 input field and 1 WebBrowserControl control, set names and text
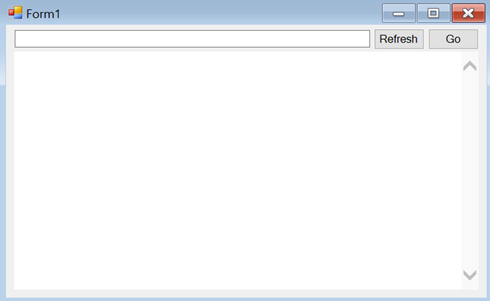
- Add the following code as click event handlers for the Refresh and OK buttons:
private void button1_Click(object sender, EventArgs e) { if (!String.IsNullOrWhiteSpace(textBox1.Text)) webBrowser1.Navigate(textBox1.Text); } private void button2_Click(object sender, EventArgs e) { webBrowser1.Refresh(WebBrowserRefreshOption.Completely); } - Now compile the application and copy it to the target remote machine.
We connect VS 2015 to VS 2015 Remote Debugger on the target machine
- Run the application on the target machine, where VS 2015 Remote Debugger is also installed
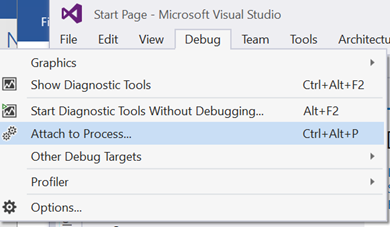
- On the developer's machine, open VS 2015. Click Debug -> Attach to Process ...
- In the Attach to Process window, enter the name of the target machine in the Qualifier field. Or click on Find ... to search for the machine in the domain. In our case, the name ContosoDev2
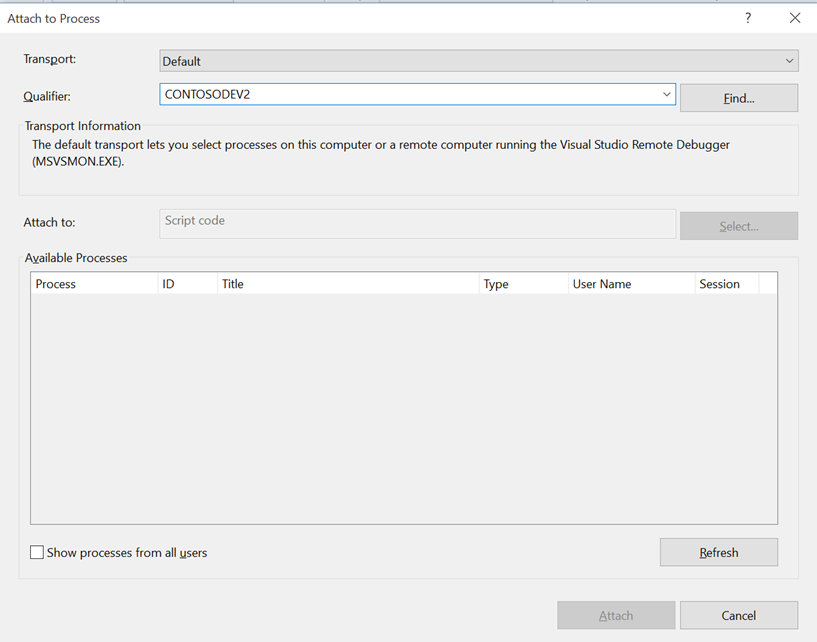
- By default, the list will not be updated, therefore click Refresh to see a list of running processes. If necessary, debug the application. Launched by another user, select the check box for the Show processes from all users option.
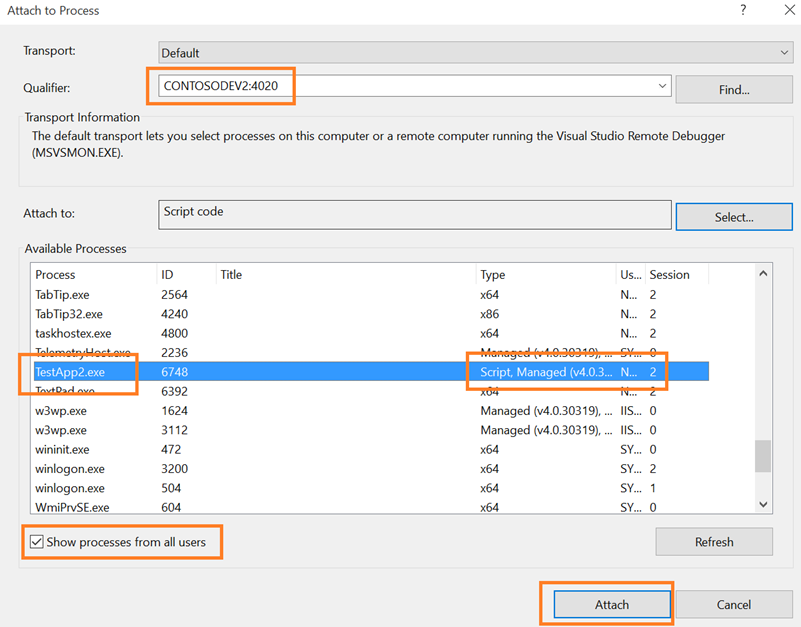
- Select the target process and click the Attach button. Make sure that the “Script” is displayed in the Type column for the process. By default, the Script and Managed Code Debugging options will be selected VS 2015
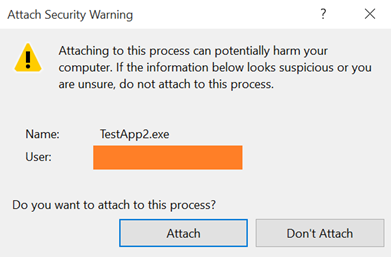
- Visual Studio will warn us about possible security risks when connecting to a remote process. Click Attach
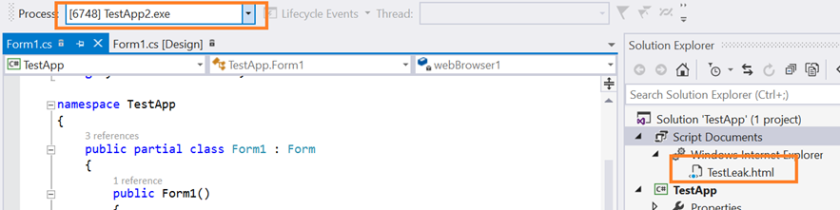
- After a successful connection, we should see the TestLeak page . html in the VS 2015 Solution Explorer
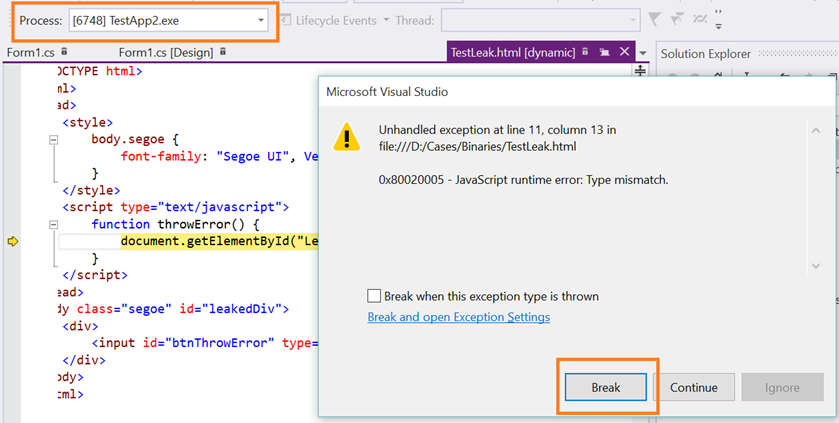
- Now press the “Throw an error” button on the page.
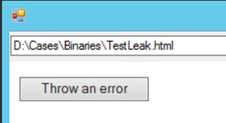
- And we observe the suspension of execution in the debugger. What we needed!
Source codes of the demo project
Source: https://habr.com/ru/post/276897/
All Articles