Compare prices in online bookstores using python, pandas and matplotlib
Today we will try to find the cheapest and most expensive online book store.
We will compare paper books that are in stock. In different stores a very different number of books. Somewhere less than 1000, and somewhere more than 200,000 books.
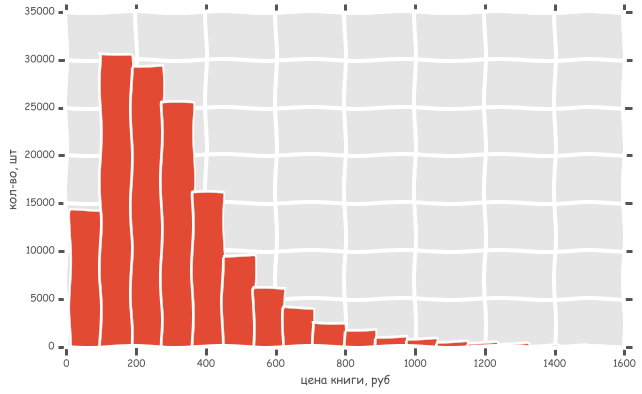
By the way, the histogram is real. How it is built and other interesting patterns under the cut.
First you need to find a list of books that are in all stores.
')
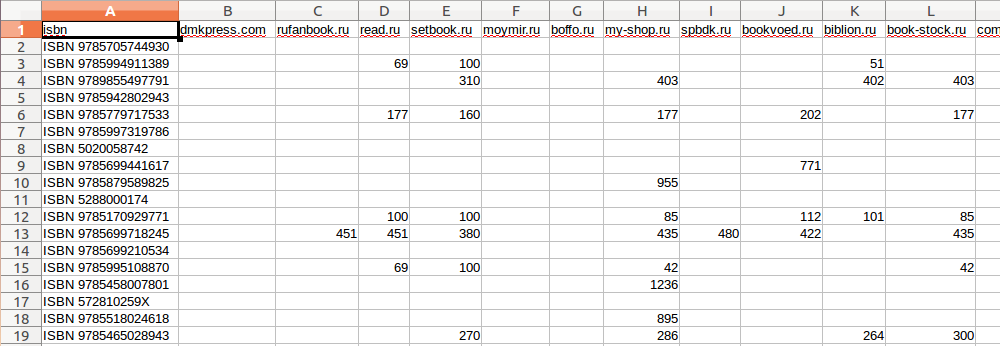
I unloaded the database from the site bookradar.org , in the form of a csv file. Of course, I didn’t just unload it, but I specially processed it using Python to make it convenient to analyze. Our columns are shops, lines are books, cell lines are prices for this book in a particular shop. If there is no book in the store, then an empty value (NaN).
Only paper books that have an ISBN listed are unloaded. Books for which ISBN is not specified there is no possibility to understand that this is the same book. Even books that are called the same and look the same can differ in price if for example these are editions of different years. Therefore, to simplify the analysis we use only those books that can be easily compared.
When drawing graphics for the first time, the scale was completely unreadable, since there are some instances that cost 30-50 thousand rubles. Therefore, when unloading, I deleted books that cost more than 1,500 rubles.
Let's make the necessary imports and load the file into the DataFrame:
This is the first few lines of our DataFrame.
We calculate the number of books for each store:
Very small shops make no sense, because overlapping books will be very little or no zero. Choose stores from about 100 thousand books or a little less
Received a summary of the table:
Books, which are in all stores, we found 17834.
Some explanations:
According to this data, it is already possible to draw any conclusions. If you look at the median, then the best price is offered by setbook.ru with 240, then go my-shop.ru and book-stock.ru with median 248.
Let's build a histogram and see which range has the most books. This histogram is similar to the picture at the beginning of the post, only there are more bars.
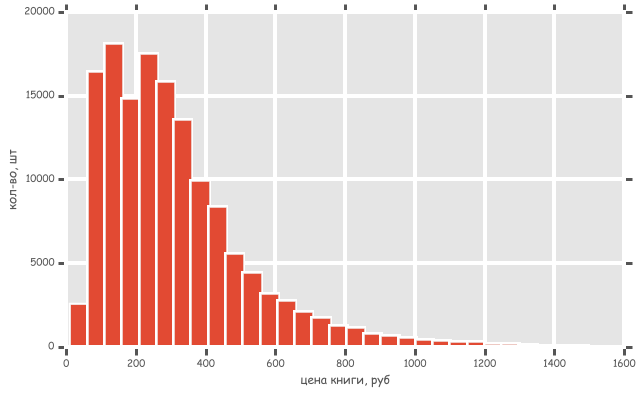
Interestingly, it turned out two peaks, about 75 rubles and 215 rubles.
And I got the distorted view by adding a couple of lines at the beginning of the previous piece of code:
Now let's look at the correlation of prices in stores:
Visible is a good correlation between the prices of all stores. And if you look at a couple of my-shop.ru and book-stock.ru, then the correlation is as much as 0.996946, i.e. prices are almost the same.
We construct a histogram of the price distribution for books in each store and a scatter diagram for each pair of stores:

From the scatter diagrams, we again see the same picture as in the correlation table. The correlation is clearly there, it can be clearly seen. Increase the pair of stores for clarity.

And now look at our pair of stores with very similar prices:

It turned out almost perfect straight. But still there are points that are located outside of it, i.e. not 100% of the prices are the same.
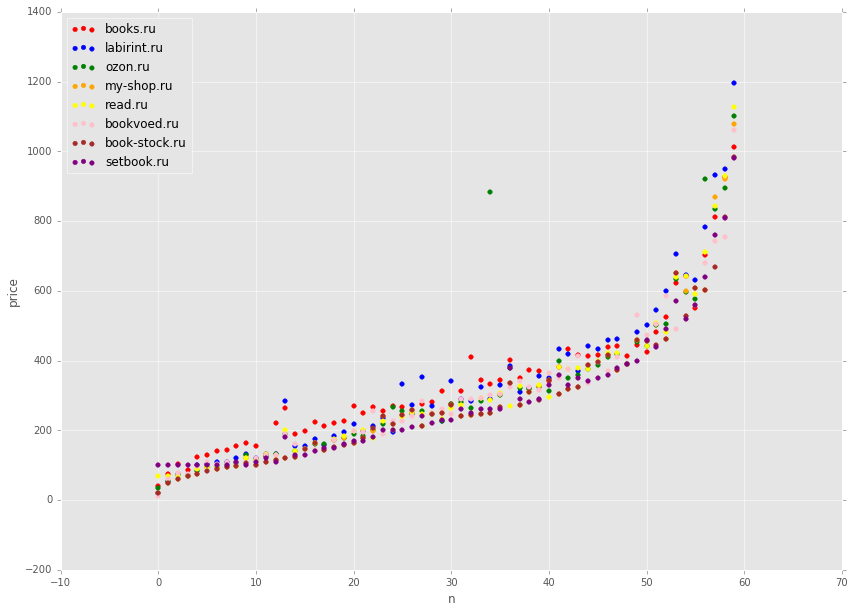
Let's try to draw our table graphically.
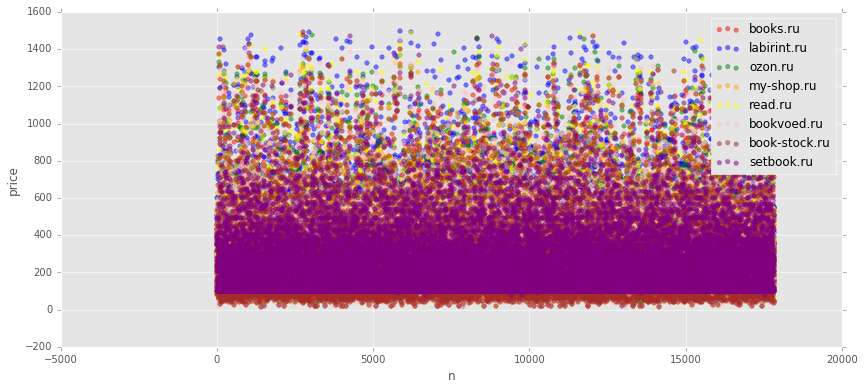
The chart is beautiful, but useless. The points just overlap. The last layer is purple, clearly painted over all the previous ones.
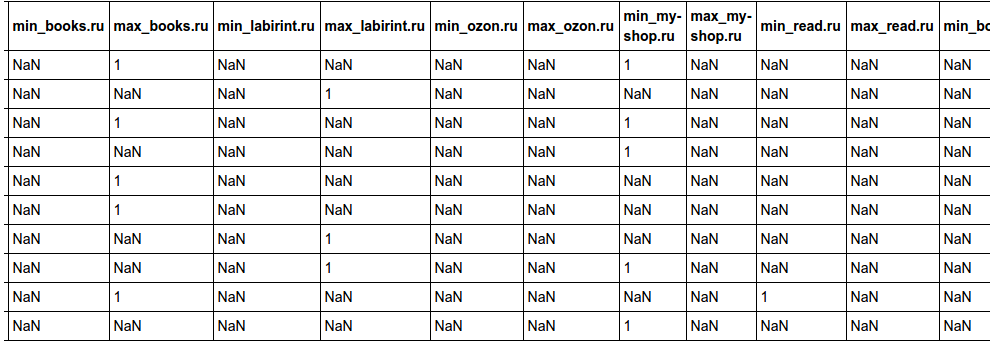
Let's now determine the number of books at the lowest price in each store. It should be noted that the minimum price for a particular book can be in several stores at once. Therefore, we add columns like “min_ozon.ru” - if in this store this book has a minimum price set among all stores, set 1 otherwise NaN. Such values are selected for convenience of counting.
It turned out such a table
Now we will display the number of books at the minimum and maximum prices in each store:
By the number of books with the lowest price, book-stock.ru, my-shop.ru, setbook.ru are leading. This is similar to what we have already seen from the medians, but the order has changed.
And at the maximum prices lead books.ru, labirint.ru and bookvoed.ru.
In order for the dots not to overwrite each other, we restrict ourselves to a small number of books.
The chart displays prices for ~ 60 books taken from a sorted set at equal intervals. It can be seen that prices on average are quite similar. However, if you look at a separate green point, then the price there is clearly prohibitively high. If we had shown not 60 points, but all 17 thousand. Then there would be clearly more such emissions.
It turns out that, on average, the price of books in stores is not very different, roughly speaking from the last graph in the range of 100-150 rubles. On the other hand, it’s like the average temperature in a hospital. Prices seem almost the same, but for a particular book, they should be 3 times more expensive. Actual information on the price of a different book, you can always look at the site .
We also did not take into account the terms of delivery (price and convenience) and personal discounts.
We will compare paper books that are in stock. In different stores a very different number of books. Somewhere less than 1000, and somewhere more than 200,000 books.
By the way, the histogram is real. How it is built and other interesting patterns under the cut.
First you need to find a list of books that are in all stores.
')
I unloaded the database from the site bookradar.org , in the form of a csv file. Of course, I didn’t just unload it, but I specially processed it using Python to make it convenient to analyze. Our columns are shops, lines are books, cell lines are prices for this book in a particular shop. If there is no book in the store, then an empty value (NaN).
Only paper books that have an ISBN listed are unloaded. Books for which ISBN is not specified there is no possibility to understand that this is the same book. Even books that are called the same and look the same can differ in price if for example these are editions of different years. Therefore, to simplify the analysis we use only those books that can be easily compared.
When drawing graphics for the first time, the scale was completely unreadable, since there are some instances that cost 30-50 thousand rubles. Therefore, when unloading, I deleted books that cost more than 1,500 rubles.
Choosing stores for analysis
Let's make the necessary imports and load the file into the DataFrame:
import numpy as np import pandas as pd import matplotlib.pyplot as plt from IPython.display import HTML plt.style.use('ggplot') %matplotlib inline filename = 'books.csv' data = pd.read_csv(filename, header=0, na_values=None, low_memory=False) data.head() This is the first few lines of our DataFrame.
| isbn | dmkpress.com | rufanbook.ru | read.ru | setbook.ru | moymir.ru | boffo.ru | my-shop.ru | ... | |
|---|---|---|---|---|---|---|---|---|---|
| one | 9785994911389 | NaN | NaN | 69 | 100 | NaN | NaN | NaN | ... |
| 2 | 9789855497791 | NaN | NaN | NaN | 310 | NaN | NaN | 403 | ... |
| 3 | 9785942802943 | NaN | NaN | NaN | NaN | NaN | NaN | NaN | ... |
| four | 9785779717533 | NaN | NaN | 177 | 160 | NaN | NaN | 177 | ... |
We calculate the number of books for each store:
desc = data.describe() l = [] for colname in desc: count = desc[colname][0] l.append((count, colname)) for t in sorted(l, reverse=True): print("{:16} {}".format(t[1], int(t[0]))) shop number of books ozon.ru 220962 setbook.ru 208039 my-shop.ru 203200 books.ru 181817 book-stock.ru 124308 bookvoed.ru 117494 labirint.ru 114803 read.ru 93720 spbdk.ru 43714 chaconne.ru 42993 biblion.ru 41898 eksmo.ru 40582 knigosvet.com 34645 rufanbook.ru 6071 combook.ru 4716 bookmail.ru 2356 boffo.ru 2341 moymir.ru 740 dmkpress.com 722
Very small shops make no sense, because overlapping books will be very little or no zero. Choose stores from about 100 thousand books or a little less
# stores = ['books.ru', 'labirint.ru', 'ozon.ru', 'my-shop.ru', 'read.ru', 'bookvoed.ru', 'book-stock.ru', 'setbook.ru'] data = data[stores] # . # .. , . data = data.dropna(axis=0) # , data.describe() Received a summary of the table:
| books.ru | labirint.ru | ozon.ru | my-shop.ru | read.ru | bookvoed.ru | book-stock.ru | setbook.ru | |
|---|---|---|---|---|---|---|---|---|
| count | 17834.000000 | 17834.000000 | 17834.000000 | 17834.000000 | 17834.000000 | 17834.000000 | 17834.000000 | 17834.000000 |
| mean | 340.154312 | 343.349333 | 308.639677 | 294.602108 | 309.796400 | 315.771504 | 291.266794 | 286.433722 |
| std | 189.347516 | 235.526318 | 209.594445 | 206.383899 | 208.093532 | 208.651959 | 204.553104 | 191.038253 |
| min | 40.000000 | 17.000000 | 26.000000 | 14.000000 | 69.000000 | 13.000000 | 14.000000 | 77.000000 |
| 25% | 210.000000 | 169.250000 | 153.000000 | 142.000000 | 155.000000 | 162.000000 | 142.000000 | 140.000000 |
| 50% | 308.000000 | 293.500000 | 264.000000 | 248.000000 | 267.000000 | 271.000000 | 248.000000 | 240.000000 |
| 75% | 429.000000 | 435.000000 | 391.000000 | 380.750000 | 391.000000 | 402.000000 | 373.000000 | 360.000000 |
| max | 1460.000000 | 1497.000000 | 1478.000000 | 1474.000000 | 1485.000000 | 1456.000000 | 1474.000000 | 1490.000000 |
Books, which are in all stores, we found 17834.
Some explanations:
- mean - average
- std - standard deviation
- 50%, 25% and 75% of the medians of the middle, lower and upper quantiles
According to this data, it is already possible to draw any conclusions. If you look at the median, then the best price is offered by setbook.ru with 240, then go my-shop.ru and book-stock.ru with median 248.
Price distribution
Let's build a histogram and see which range has the most books. This histogram is similar to the picture at the beginning of the post, only there are more bars.
plt.figure(figsize=(10, 6)) plt.xlabel(' , ') plt.ylabel('-, ') data3 = data[stores] x = data3.as_matrix().reshape(data3.size) # count, bins, ignored = plt.hist(x, bins=30) Interestingly, it turned out two peaks, about 75 rubles and 215 rubles.
And I got the distorted view by adding a couple of lines at the beginning of the previous piece of code:
plt.xkcd() # plt.style.use('ggplot') # xkcd, .. xkcd Price correlation
Now let's look at the correlation of prices in stores:
data.corr() | books.ru | labirint.ru | ozon.ru | my-shop.ru | read.ru | bookvoed.ru | book-stock.ru | setbook.ru | |
|---|---|---|---|---|---|---|---|---|
| books.ru | 1.000000 | 0.971108 | 0.969906 | 0.965291 | 0.978453 | 0.970747 | 0.965809 | 0.966226 |
| labirint.ru | 0.971108 | 1.000000 | 0.973731 | 0.968637 | 0.979923 | 0.970600 | 0.969971 | 0.965970 |
| ozon.ru | 0.969906 | 0.973731 | 1.000000 | 0.973783 | 0.979620 | 0.967151 | 0.974792 | 0.971946 |
| my-shop.ru | 0.965291 | 0.968637 | 0.973783 | 1.000000 | 0.976491 | 0.956980 | 0.996946 | 0.970588 |
| read.ru | 0.978453 | 0.979923 | 0.979620 | 0.976491 | 1.000000 | 0.974892 | 0.976164 | 0.974129 |
| bookvoed.ru | 0.970747 | 0.970600 | 0.967151 | 0.956980 | 0.974892 | 1.000000 | 0.958787 | 0.961217 |
| book-stock.ru | 0.965809 | 0.969971 | 0.974792 | 0.996946 | 0.976164 | 0.958787 | 1.000000 | 0.972701 |
| setbook.ru | 0.966226 | 0.965970 | 0.971946 | 0.970588 | 0.974129 | 0.961217 | 0.972701 | 1.000000 |
Visible is a good correlation between the prices of all stores. And if you look at a couple of my-shop.ru and book-stock.ru, then the correlation is as much as 0.996946, i.e. prices are almost the same.
We construct a histogram of the price distribution for books in each store and a scatter diagram for each pair of stores:
from pandas.tools.plotting import scatter_matrix scatter_matrix(data, alpha=0.05, figsize=(14, 14)); From the scatter diagrams, we again see the same picture as in the correlation table. The correlation is clearly there, it can be clearly seen. Increase the pair of stores for clarity.
scatter_matrix(data[['ozon.ru', 'labirint.ru']], alpha=0.05, figsize=(14, 14)); And now look at our pair of stores with very similar prices:
scatter_matrix(data[['my-shop.ru', 'book-stock.ru']], alpha=0.05, figsize=(14, 14)); It turned out almost perfect straight. But still there are points that are located outside of it, i.e. not 100% of the prices are the same.
Chart with all prices
Let's try to draw our table graphically.
plt.figure(figsize=(14, 6)) # x = list(range(data['books.ru'].count())) colors = ['red', 'blue', 'green', 'orange', 'yellow', 'pink', 'brown', 'purple'] for index,store in enumerate(stores): plt.scatter(x, data[store], alpha=0.5, color=colors[index], label=store) plt.xlabel('n') plt.ylabel('price') plt.legend(loc='best'); The chart is beautiful, but useless. The points just overlap. The last layer is purple, clearly painted over all the previous ones.
Number of books at the lowest price
Let's now determine the number of books at the lowest price in each store. It should be noted that the minimum price for a particular book can be in several stores at once. Therefore, we add columns like “min_ozon.ru” - if in this store this book has a minimum price set among all stores, set 1 otherwise NaN. Such values are selected for convenience of counting.
import random def has_min_price(store): def inner(row): prices = list(row[:len(stores)]) min_price = min(prices) store_price = prices[stores.index(store)] return 1 if store_price == min_price else np.nan return inner # ;) def has_max_price(store): def inner(row): prices = list(row[:len(stores)]) max_price = max(prices) store_price = prices[stores.index(store)] return 1 if store_price == max_price else np.nan return inner for store in stores: data['min_' + store] = data.apply(has_min_price(store), axis=1) data['max_' + store] = data.apply(has_max_price(store), axis=1) HTML(data.head(10).to_html()) It turned out such a table
Now we will display the number of books at the minimum and maximum prices in each store:
desc = data.describe() def show_count(prefix): l = [] for column_name in desc: if prefix in column_name: cnt = desc[column_name][0] l.append((cnt, column_name)) for t in sorted(l, reverse=True): print(t[1].replace(prefix, ''), int(t[0])) print(' :', desc[stores[0]][0]) print() print(' :') show_count('min_') print() print(' :') show_count('max_') Total books: 17834.0 Number of books at the lowest price: book-stock.ru 8411 my-shop.ru 7735 setbook.ru 6359 bookvoed.ru 1884 ozon.ru 1015 read.ru 914 books.ru 379 labirint.ru 335 Number of books at the maximum price: books.ru 10323 labirint.ru 4383 bookvoed.ru 1143 setbook.ru 1052 ozon.ru 676 book-stock.ru 372 my-shop.ru 351 read.ru 265
By the number of books with the lowest price, book-stock.ru, my-shop.ru, setbook.ru are leading. This is similar to what we have already seen from the medians, but the order has changed.
And at the maximum prices lead books.ru, labirint.ru and bookvoed.ru.
Sort at the lowest price.
In order for the dots not to overwrite each other, we restrict ourselves to a small number of books.
def get_min(row): prices = list(row[:len(stores)]) return min(prices) # data['min'] = data.apply(get_min, axis=1) # , # 300- , data2 = data.sort_values(['min'])[::300] # plt.figure(figsize=(14, 10)) colors = ['red', 'blue', 'green', 'orange', 'yellow', 'pink', 'brown', 'purple'] for index,store in enumerate(stores): plt.scatter(x[:len(data2)], data2[store], alpha=1.0, color=colors[index], label=store) plt.xlabel('n') plt.ylabel('price') plt.legend(loc='upper left'); The chart displays prices for ~ 60 books taken from a sorted set at equal intervals. It can be seen that prices on average are quite similar. However, if you look at a separate green point, then the price there is clearly prohibitively high. If we had shown not 60 points, but all 17 thousand. Then there would be clearly more such emissions.
findings
It turns out that, on average, the price of books in stores is not very different, roughly speaking from the last graph in the range of 100-150 rubles. On the other hand, it’s like the average temperature in a hospital. Prices seem almost the same, but for a particular book, they should be 3 times more expensive. Actual information on the price of a different book, you can always look at the site .
We also did not take into account the terms of delivery (price and convenience) and personal discounts.
Source: https://habr.com/ru/post/276745/
All Articles