Building a glass of quotes (FullOrderBook) based on historical data
Most recently, I solved the problem of building a glass of quotes based on historical data of the Moscow Exchange. I did not find anything like this in open sources, I had to start from scratch and dig myself. There are some nuances that you need to know. I will mention about them in the course.
IT Invest has written and written a lot about stock trading, infrastructure and algorithms testing on historical data, thanks to him. From myself I will add that we analyze the market depth, liquidity, spreads and much more on the OrderLogs data. We use the results in our trading algorithms.
')
Specially chose the stock market, because there are most questions. The currency and derivatives markets have their own characteristics, but there it is easier. The implementation of the algorithm in Java, the code on GitHub .
Objective: Get a glass of quotes at any given time.
What is at the entrance?
File with all orders / transactions (Full Order Log) received from the Exchange in 1 day, simple CSV format, volume ~ 1 GB. Format description and data examples are on the Exchange website. Here is a fragment of the file:
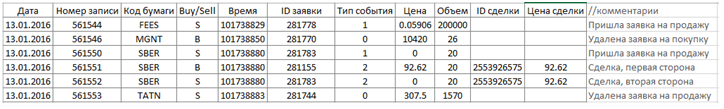
- Paper Code - Trading Instrument Code
- Buy / Sell - the direction of the order to buy or sell
- Time - in the format HHMMSSZZZ (101738829 = 10 h 17 min 38 sec 829 ms)
- Application ID - we track application life by it
- Event type - {1 - order has arrived, 0 - order has been deleted, 2 - deal}
- Price - price in rubles. for 1 paper
- Volume - the volume of the order / transaction in the number of securities
- Transaction ID - filled if event type = 2
- Transaction price - filled if the event type = 2
Since the data is obtained directly from the trading system, the “Time” field is the time of recording events in the trading system. This must be taken into account. Who gets the marketer through FAST , the data comes with a delay (latency ~ 0.1 ms in the collocation zone). It is to me that if you test algorithms on the Exchange data, then there are no delays in time that are in our realities. So if such times are not critical, you can “score” on latency.
The stock market starts at 9:50 and closes at 18:50, going through 3 phases:
09:50 - 10:00 - Opening auction (Opening price is being formed)
10:00 - 18:40 - Main Trading
18:40 - 18:50 - Closing auction (closing price is formed)
The file contains only "Main Trading" + non-executed bids from the opening auction.
Assembly algorithm
It will take 2 types of object “Orders” and “OrderBook”. Orders are discrete orders (a line in a file). And the OrderBook object is an application that is aggregated by price and has 2 fields: price and volume, i.e. we add all volumes with the same price.
Let's collect the glass for the tool “XXXX” at the time AABBCCDDD. From the first line we start to collect orders (Orders objects) concerning the paper “XXXX” in the collection. Buy applications in one, Sell in another. And we will go through all the applications until time <= AABBCCDDD.
If the event type = 1 (to place an order), add the order to the Buy or Sell collection depending on the direction of the order.
If the event type = 0 (delete the application), then by the application number we find it in the collection and delete it. It certainly should be there, for logically, it is impossible to remove what is not. If you did not find the necessary application, you need to sound the alarm (either an error in the data itself, or we were mistaken).
If the event type = 2 (deal), then by the order number we find it in the collection and look at its volume:
- If V1 = V2 (V1 is the volume of the application in the collection, V2 is the volume of the transaction), then the application is removed from the collection. This means that the application has been completely fulfilled;
- If V1> V2, then in the collection we change the volume of V1 to V1-V2. This means that the application was partially executed. And the part remained in the glass;
- If V1 <V2 (yes, and this can be, that is, the volume of the application is 10, and the transaction took place at 20) this is a sign of the “iceberg” of the application. In this case, the application is removed from the collection.
Types of events = 2 always go in pairs - two sides of the transaction. As soon as the condition time <= AABBCCDDD is violated, we exit the loop. At this point, our collections contain all active applications at the time of AABBCCDDD. Sort items of collections by price. Now it’s time to create OrderBook objects, let me remind you, these are price levels (aggregate price-volume indicators), i.e. what used to see in the glass of quotations. We cycle through all applications and add up the volume of applications with the same price. That's the whole algorithm.
Applications By Market
For market orders, the price in the field is “0”. Such applications are also processed as usual. They are executed in the moment.
Applications like "Iceberg"
Iceberg applications are also found in orderlogs. As shown, it is impossible to identify them for sure. When generating data, the Exchange applies its own algorithm, which hides icebergs. But still, in some cases they flash, for example, a bid with a volume of 10 hangs, and when it turns into a deal, the volume is already 100.
Knowledge of this information is enough to collect glasses, analyze spreads and market depth.
And now the most delicious: let's test our algorithm in practice. February 2, 2016 specially made screenshots from the Bloomberg terminal with a glass, fixing the time. I took the tools that were not the most liquid: Yandex (YNDX), Kamaz (KMAZ) ... in order to avoid the difficulty of time synchronization. In parallel, I collected a glass on the Exchange data by the algorithm described above. Here is the result at 4:56:21 PM:
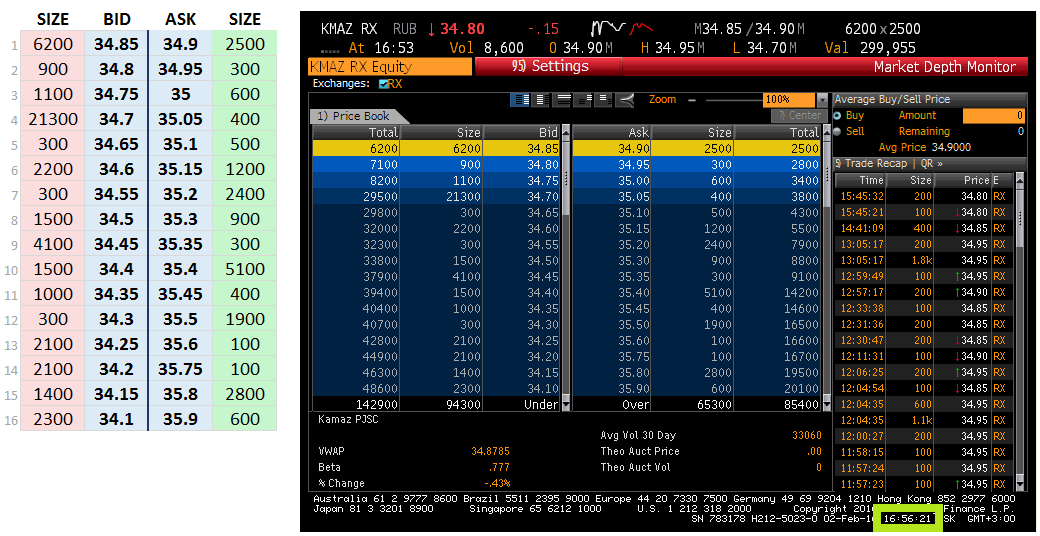
The data is identical.
A few words about speed
In the stream of about 15 million records, which contains about 300 tools. The most liquid SBER tool for the whole trading day drives off in 20 seconds. For SBER, the depth of glass in one direction or the other is 500-600 price levels. If after each “hour” to keep the state of the glass, the processing time is reduced to a second, which suits me perfectly. And if you also write down the necessary tool in a separate stream, the time will be reduced to tenths of a second.
Thus, the glass on any instrument at any time is obtained in less than 1 second. I'm sure someone will be able to offer a more efficient algorithm, I will be glad.
PS: A piece of historical data can be taken on the Exchange website for free. If you need the data for February 2, I will upload to Ya.Disk (~ 1Gb). Let me know.
Source: https://habr.com/ru/post/276635/
All Articles