Performance and memory profiling from multiple viewing angles
Tool selection

The problem of profiling sooner or later confronts any project that claims to be the best in its field. Which tool to choose is always a big question. Some tools show one part of the picture, others the other. And sooner or later you begin to write your tool (English tool - tool \ tool), which answers the urgent problems of this particular project. However, the time to write your own “instrument” always has to be deducted from the time allotted for the project itself.
Therefore, a serious profiler cannot be written ...
But how to get everything at once? (Here for some reason I remember the song Queen "I want it all")
And what if there was such an API that allows you to use the power of already existing profilers and expands their scope to our needs?
')
So, there is such an API. And, moreover, it is free and open source. Called the Intel® Single Event API , abbreviated as Intel® SEAPI.
Let's see what it is and how difficult it is to use it.
What does he give us?
Judging by the official website wiki , this API runs on Windows, Linux, MAC OS X, Yocto and Android. And allows you to visualize your tracks in Systrace, chrome: // tracing, Windows Performance Analyzer, X Code Instruments, QT Creator profiler, Trace Compass. He also knows how to convert traces in two ways of displaying diagrams: DGML and GraphViz. Choose from this what is most familiar to you and go!
How to use it?
First you have to download and compile it. It’s not hard if you already have cmake, python, and “build environment” (compilation environment). On Windows, this is Studio 2013, below is impossible, because C ++ 11 is already used there. There is support for 2015 th studio. On other platforms, everyone knows all the standard tools for the assembly.
The build is very simple: run “python buildall.py -i” in the root directory; this will not only compile the project, but also build the installer.
For the lazy (like me) a ready-to-have installer was posted recently : github.com/01org/IntelSEAPI/releases
After installation, you can find an example of using “TestIntelSEAPI” in the bin folder - it shows all the features currently available.
Then it’s easier to add itt_notify.hpp to our project and place macros from it in our code.
The simplest and most useful macro is ITT_FUNCTION_TASK () - just leave it at the beginning of the functions that concern us most. The entire lifetime of the function will be measured every time it is called.
If you suddenly need to measure something less than a function, there is a macro ITT_SCOPE_TASK (name).
Arguments can be added to both macros: ITT_ARG (name, value).
You can also trace ITT_COUNTER (name, value) “counters”.
For linking you will need to include in the project “ittnotify * .lib” from the bin folder.
However, if our project is written in pure "C" - these macros will not work. But the good news is that these macros are nothing more than a wrapper over a lower-level trace API - itt_notify.
Examples of the use of both can be found in InstrumentationExample.cpp
There is good news for fans (and even professionals) of scripting languages: more recently, support for Python and Java has been added. Examples are given directly in the wrappers themselves.
Run, run off and ...
Here is what we get, for example, in the Windows Performance Analyzer:

WPA is good because he already knows a lot. A lot of things. Our task is only to add our events and counters to it - then it will be possible to use all its might for the benefit of our project.
Let's look at the same route using GraphViz (a run-time call-graph came out of the route):

And of course XCode Instruments :

About him, by the way, there is an excellent post on Habré: habrahabr.ru/post/168491
“What about memory?”
- Oh, yes, memory!
Memory profiling is to add memory.cpp to your project. All CRT allocations will be presented in the form of counters - for each size of allocation there is a separate counter. This will allow you to see the overall picture of the time, find the accumulation of memory and its leakage.
Here, for example, how it will look in chrome: // tracing:

In addition, there is an attribution of memory operations to functions . To understand how this works, let's analyze an example. The test application that comes with Intel® SEAPI starts threads mercilessly attacking itt_notify. So, the creation of a stream, for some reason, is much slower for the first time than at other times.
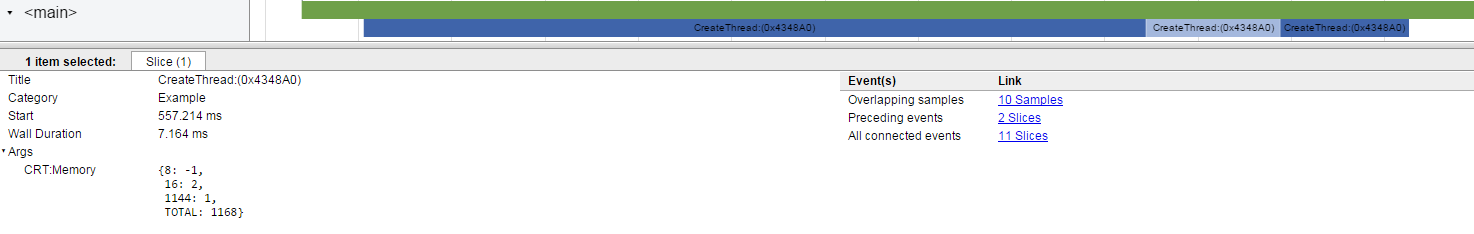
Pay attention - in the picture you can see the blocks of what sizes and how many times they were allocated (released). This is the attribution. For example, it is clear that in the process of performing this task, a block of size 8 has been removed. The rest stood out and in total gave 1168 bytes.
Attribution is based on a simple principle: all memory operations that are in the task execution interval (on the same thread) are tied to this task.
So why was the first time the CreateThread task was so slow?

Wow! She allocated memory ... and a lot of memory! As many as 154 kilobytes. To understand what the memory went, let's see the fattest unit. A block of size 32776 was allocated as many as three times. And who did it? And here we can get help from the stacks that are collected for every call to itt_notify (if they are of course included).
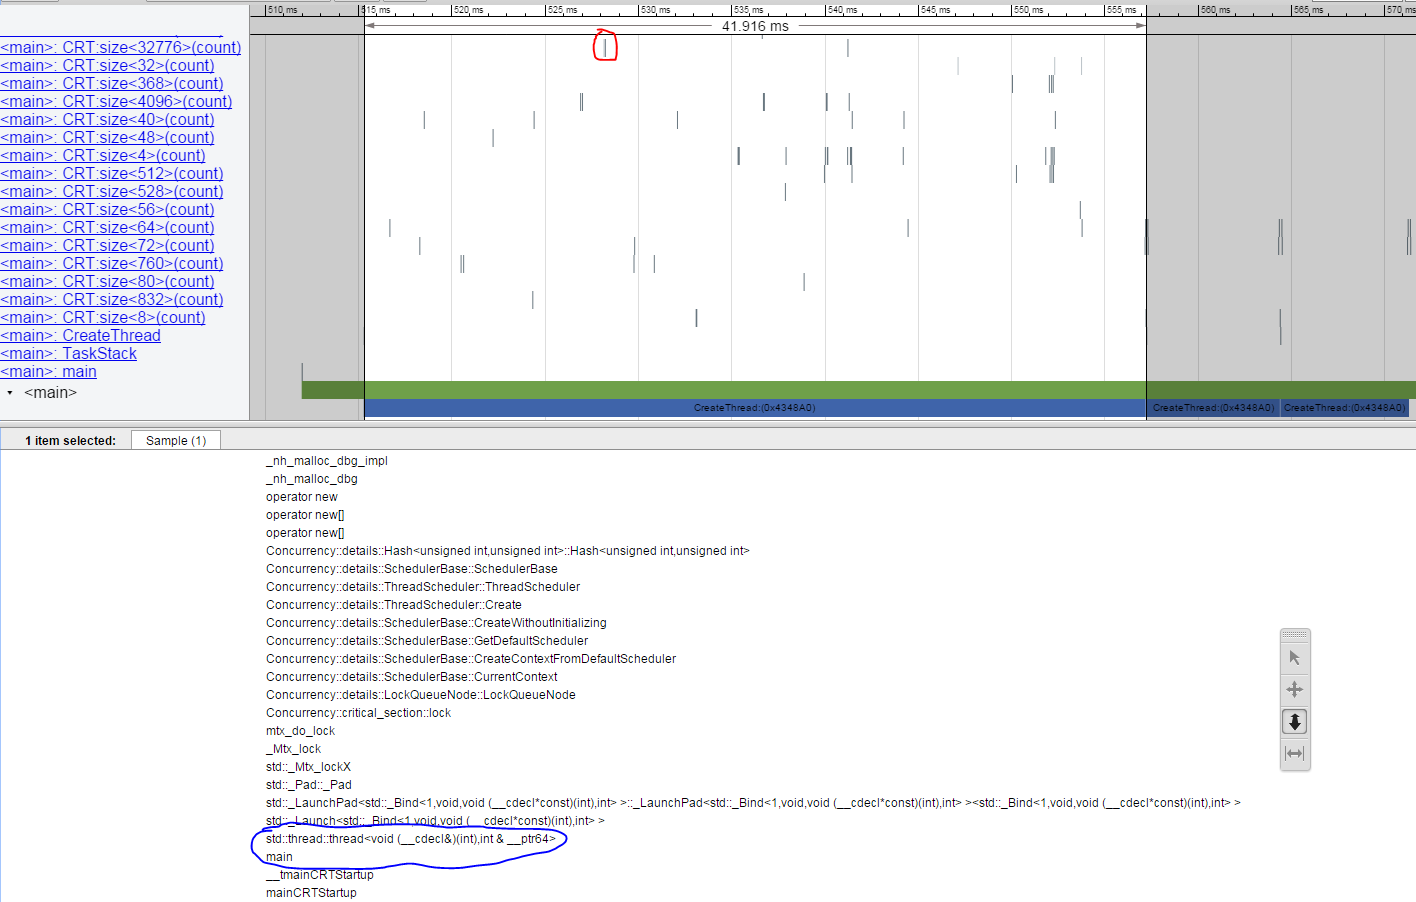
Find the first of the three “samples” (circled in red) on the track belonging to this location and watch the stack.
This is so unexpected ... an ordinary capture of a critical section leads to a whole whistle with a tambourine - very similar to initialization at the first call. The same shows research and other numerous allocations - the initialization of everything and everything. This explains the lengthy first call to std :: thread, which is circled in blue in the picture.
chrome: // tracing is a unique thing - a profiler built directly into the browser. It is available everywhere, and the ability to display data does not take it. These features, in my opinion, make it the main favorite of Intel® SEAPI.

The best part of Intel® SEAPI is its easy expandability. Want to add a new language - 150 lines of code in a new language. Want to add a new format or viewer - 100 lines of python code. Do you want to use in the test infrastructure for night control of performance - run the tests, adding two environment variables and there will be tracks. It's lazy to open the tracks every time - convert the main statistics into your format and insert it into the test reprot.
In general, in my opinion the thing is arch-useful. It is only necessary to spend some time and deal with it.
Please write your reviews, they will help me improve the article.
Source: https://habr.com/ru/post/276607/
All Articles