Query Performance Insight: Who Eats Your Database Resources?
We are happy to share with you another article from the Microsoft Azure cloud services series. This time, Andrei Antyufeev, Microsoft program manager from the SQL Server team and the Azure SQL Database, will continue his story about working with optimization and monitoring tools when working with the Azure SQL Database cloud database. - Vladimir YunevThis post is about Query Performance Insight. SQL Azure tool that helps you identify the most demanding queries of your database,
Query Performance Insights was announced at the beginning of October and today it reached the GA mark. In order to understand what it is, let's imagine that your database has become slow: how do you know about it? Perhaps your clients started to flood you with letters, the weekly report began to run an hour instead of the usual 3 minutes, your application started throwing exceptions.
Getting Started - New Azure Portal
You go to portal.azure.com and find your database in the list of resources, look at the Monitoring chart:
')
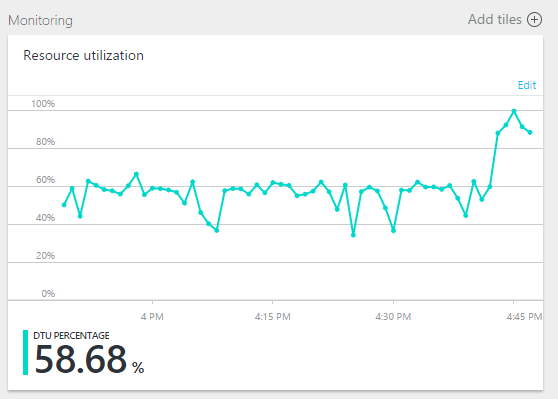
Yes, something happened, the DTU jumped to 90%, what's next?
To look deeper and find the culprit, let's download Query Performance Insight.
Query Performance Insight

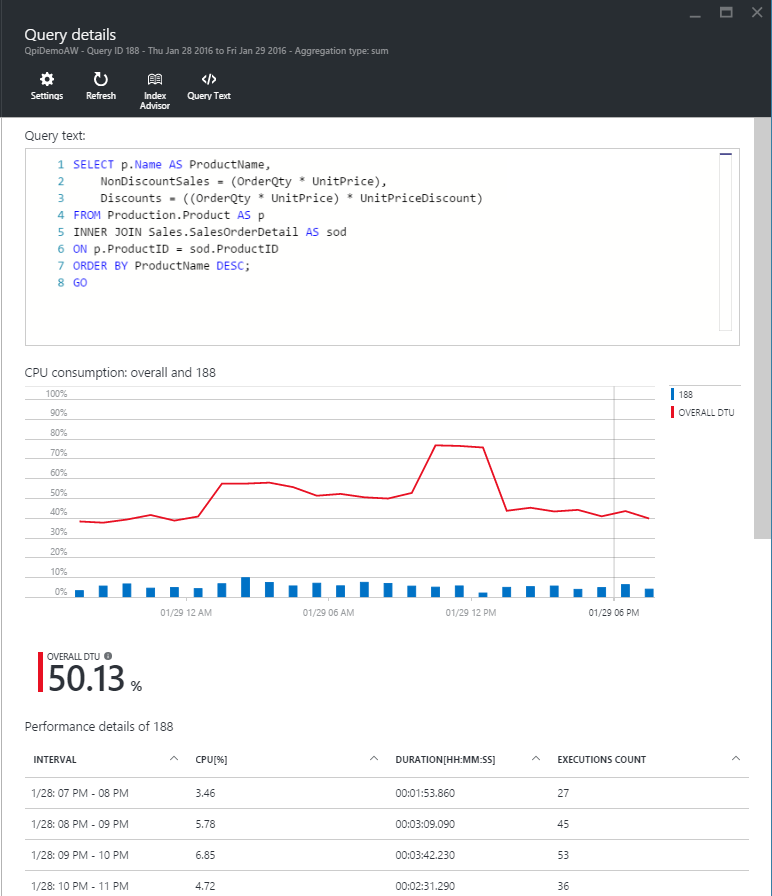
The graph shows the TOP-5 requests for CPU consumption for the last day or any other period of time. The main thing is that the data were in the Query Store, but more on that later. Each column shows the sum of 5 requests in% CPU per hour. The DTU consumption line is marked in red.
Below we see a table where data is collected for each query:
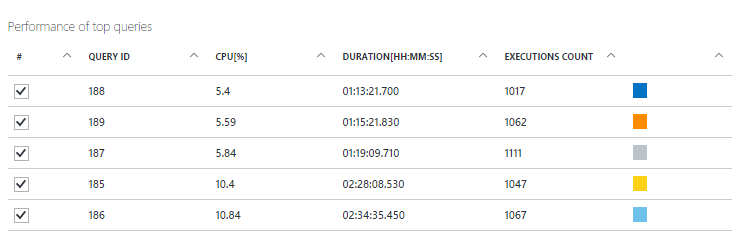
- Average CPU consumption over the entire time period
- Total lead time
- Number of requests completed
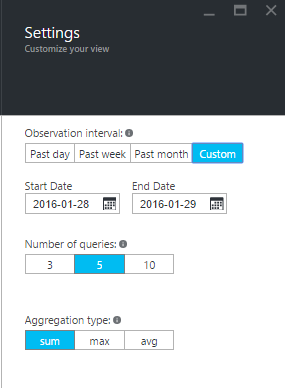
You can change the display settings in the settings by choosing:
- other time period
- number of requests
- time aggregation function
Let's open the query that, on average, used the most CPUs. Clicking on a row in the table will open a page with the text of the query and all the intervals.
Here, I think it will be useful to tell a little about how Query Performance Insight works.
Query Store
Query Performance Insight works as an information / telemetry visualizer that is already in your database, producing simple aggregations and manipulations outside your database.
It is likely that when you open the QPI for the first time, you will not see anything other than the suggestion to enable the Query Store for your database. After your consent, you need to wait a little (15-30 minutes) until a sufficient amount of data is collected.
Query Store appeared in SQL Server 2016 and SQL Azure. When it is turned on, data collection about all requests begins. Typical usage scenarios can be:
- Identifying and troubleshooting Query Plan regression
- Identifying the most voracious requests, as well as the most frequently performed
- A / B testing
- Tweaking ad-hoc requests
More information about the Query Store here https://azure.microsoft.com/en-us/blog/query-store-a-flight-data-recorder-for-your-database/
Total
For a first-time user, Query Performance Insight should be enough for an ordinary user to quickly find the culprit for poor performance and take action.
More advanced users may want to familiarize themselves with the Query Store.
Please leave comments and suggestions for the following versions of Query Performance Insight.
about the author
Andrey Antyufeev

SQL Server & Azure SQL Database Program Manager, Microsoft
sitox
Source: https://habr.com/ru/post/276549/
All Articles