Census Analyzer 1.0: A New Data Analysis Tool
Hi, Habr!
We at JetBrains have just released Census Analyzer , a new web-based application for data visualization and analysis. Try it and tell us what you think!
Census Analyzer is a prototype, “preview” version, designed to acquaint users with the principles of a more global data analysis product, which is still in development. But now, with the help of Census Analyzer, you can analyze data from the US Census Bureau in the cloud, work with graphs and pivot tables, create graphical reports, publish them and share them online.
')
Let's see what makes Census Analyzer interesting.

UPDATE: Census Analyzer is now called Datalore and is located at datalore.io. If you want to participate in a private beta, write to contact@datalore.io :)
Cloud application
Census Analyzer is a web application, so you do not need to install anything on your computer. To start working with the application, you just need to go to censusanalyzer.com , where you can enter “one click” using your Google account.

All inclusive
Our goal is to create such a tool where the user in one place can both conduct data analysis and visualize the results, creating reports based on them. Now analysts mainly use different applications for these purposes.
Three main components of the Census Analyzer web application:
The possibility of joint editing
Quite often, several people work on analytical projects at the same time, so there is a need for joint editing of documents. In Census Analyzer, we have implemented the possibility of joint editing and working on documents and reports. To do this, simply click the “Share” button and enter the email address of the recipient.
Code editor
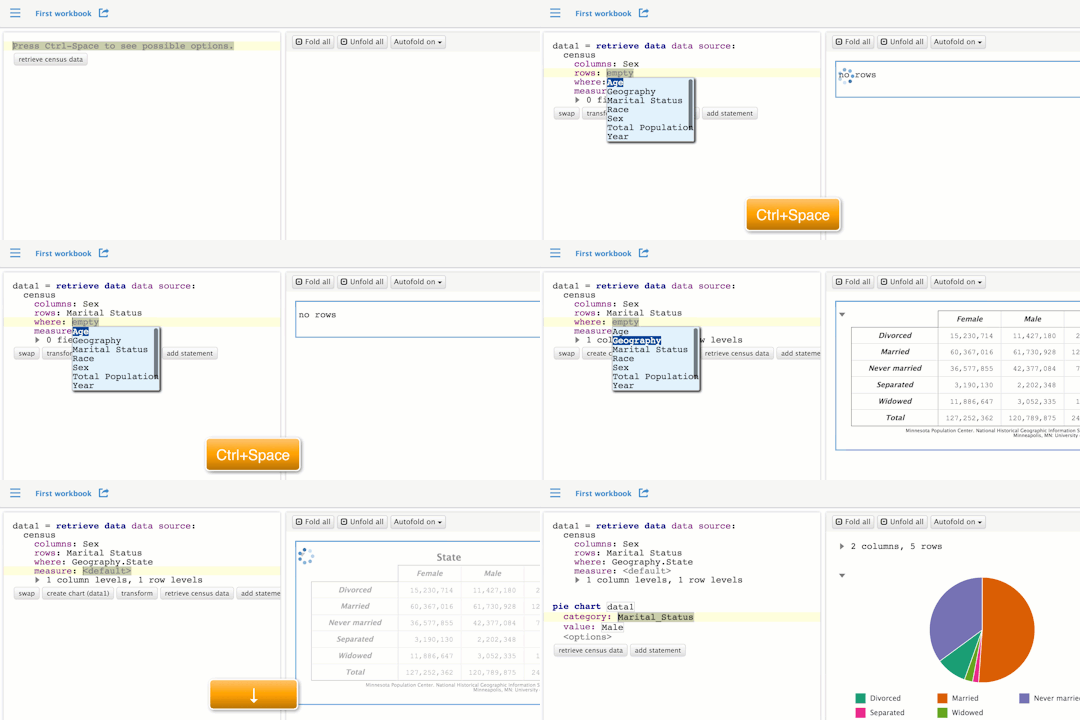
Anyone can use our code reactor! Thanks to autocompletion and suggestion of available actions, you practically do not need to enter text. Just press Ctrl + Space and use the arrows to choose from the options.
Requests are created automatically in an easy to read language.

Visualization and maps
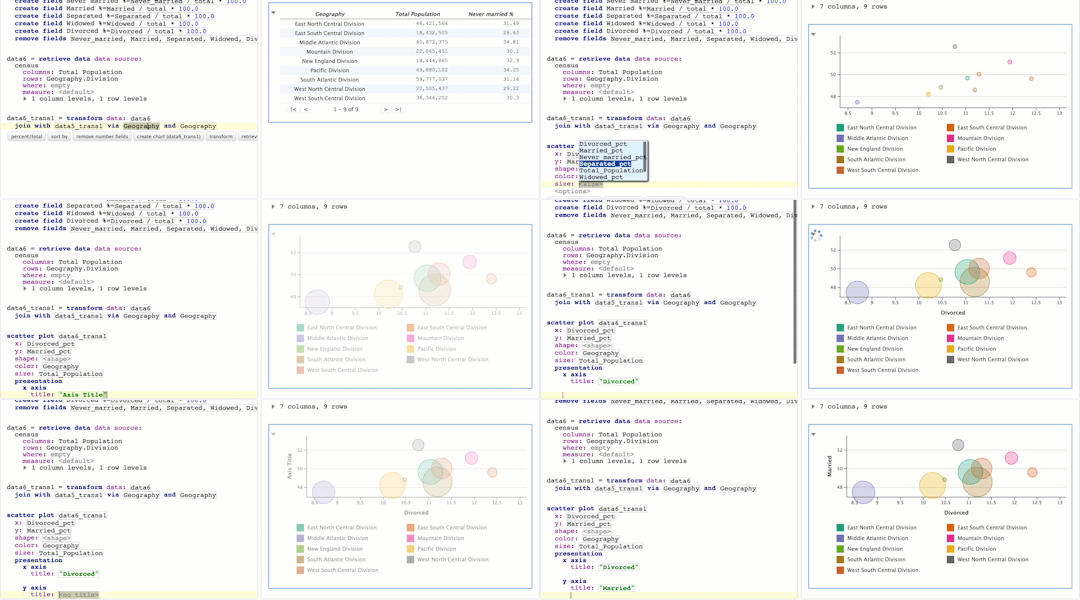
We have prepared for you beautiful graphics for data visualization. Version 1.0 includes basic graphics: scatter plots, bar / line / area graphics, age pyramids, and two types of maps.

Drag-and-drop report writer
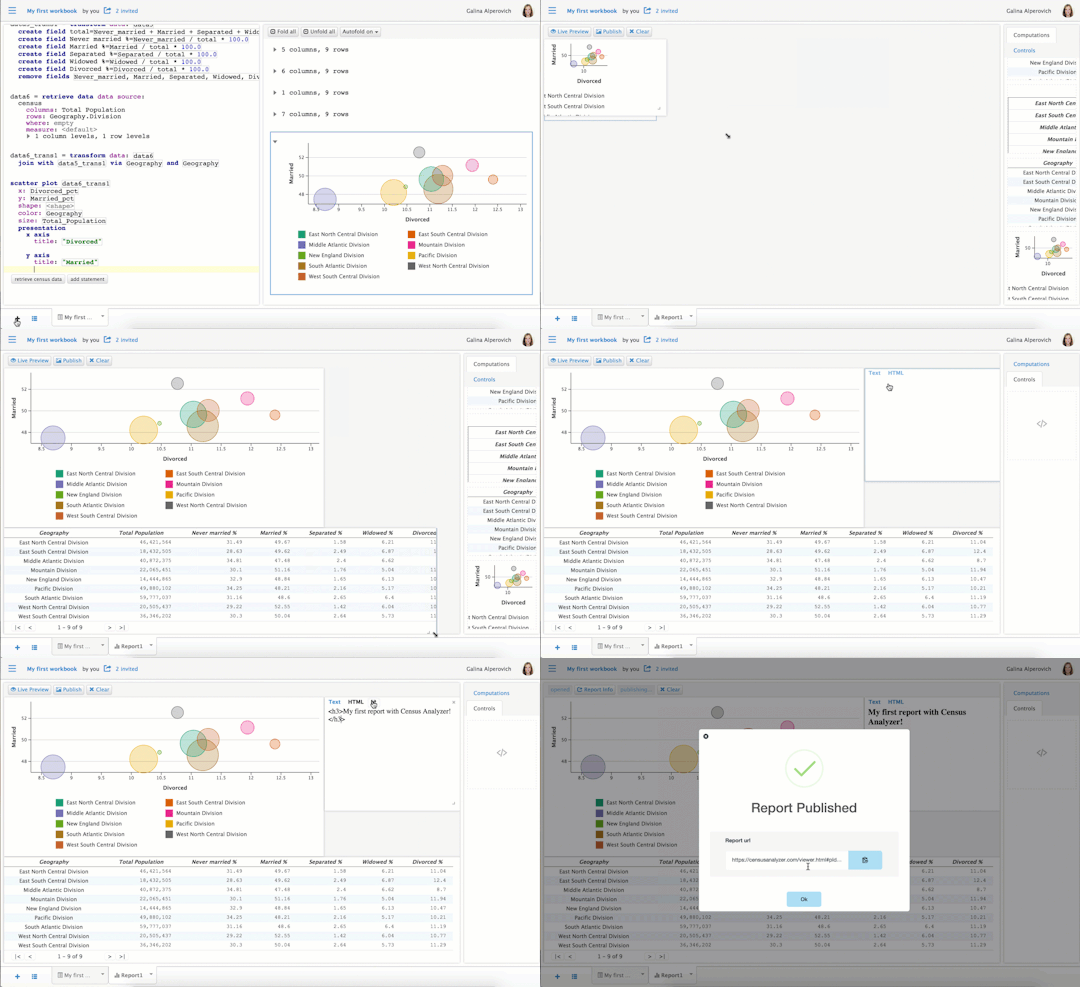
When you finish the analysis and build all the necessary graphs and tables, you probably want to create a report where all the results are beautifully arranged and signed. Using the reporting tool, you can create a report with maps, tables, and charts in minutes. During the report creation, the Live Preview feature is available, showing in real time how the finished report will look. You can also choose your own style and customize the report design to suit your preferences.

We invite you to try Census Analyzer! At this stage, any feedback is very important to us, therefore:
Your team Census Analyzer
We at JetBrains have just released Census Analyzer , a new web-based application for data visualization and analysis. Try it and tell us what you think!
Census Analyzer is a prototype, “preview” version, designed to acquaint users with the principles of a more global data analysis product, which is still in development. But now, with the help of Census Analyzer, you can analyze data from the US Census Bureau in the cloud, work with graphs and pivot tables, create graphical reports, publish them and share them online.
')
Let's see what makes Census Analyzer interesting.

UPDATE: Census Analyzer is now called Datalore and is located at datalore.io. If you want to participate in a private beta, write to contact@datalore.io :)
Cloud application
Census Analyzer is a web application, so you do not need to install anything on your computer. To start working with the application, you just need to go to censusanalyzer.com , where you can enter “one click” using your Google account.

All inclusive
Our goal is to create such a tool where the user in one place can both conduct data analysis and visualize the results, creating reports based on them. Now analysts mainly use different applications for these purposes.
Three main components of the Census Analyzer web application:
- a file system where you can create folders and documents (workbooks);
- projection code editor, where you can compose queries and analyze data. The editor practically does not assume that you will type the code: all requests are made automatically, and you just need to press Ctrl + Space to autocomplete and select the actions proposed by the editor. Immediately in the editor, you can build graphs, tables and maps;
- convenient drag-and-drop report writer for creating and publishing interactive reports. You can publish a report with graphs and tables from your workbook, and then share the link with colleagues or friends.
The possibility of joint editing
Quite often, several people work on analytical projects at the same time, so there is a need for joint editing of documents. In Census Analyzer, we have implemented the possibility of joint editing and working on documents and reports. To do this, simply click the “Share” button and enter the email address of the recipient.
Code editor
Anyone can use our code reactor! Thanks to autocompletion and suggestion of available actions, you practically do not need to enter text. Just press Ctrl + Space and use the arrows to choose from the options.
Requests are created automatically in an easy to read language.

Visualization and maps
We have prepared for you beautiful graphics for data visualization. Version 1.0 includes basic graphics: scatter plots, bar / line / area graphics, age pyramids, and two types of maps.

Drag-and-drop report writer
When you finish the analysis and build all the necessary graphs and tables, you probably want to create a report where all the results are beautifully arranged and signed. Using the reporting tool, you can create a report with maps, tables, and charts in minutes. During the report creation, the Live Preview feature is available, showing in real time how the finished report will look. You can also choose your own style and customize the report design to suit your preferences.

We invite you to try Census Analyzer! At this stage, any feedback is very important to us, therefore:
- Share your opinion on the forum forum.censusanalyzer.com
- Create tasks for us in censusanalyzer.myjetbrains.com bug tracker
- Or just email us at support@censusanalyzer.com
Your team Census Analyzer
Source: https://habr.com/ru/post/276361/
All Articles