Debugging and Profiling in Visual Studio 2015

In Visual Studio 2015, tools for debugging and diagnosing .NET applications have been significantly improved. Perhaps the most significant innovation was the Diagnostic Tools Hub, which allows profiling during debugging. Let's see what new features appeared in VS 2015.
Here is a list of new tools:
- Perftip
- Edit & Continue mode for x64 systems
- Lambda Expression Evaluation in Watch and Immediate Window
- Diagnostic Tools Window
- Live Visual Tree and Live Property Explorer
- Diagnostic Tools Hub
Perftip
Debugging tips are small hints that pop up during the debug session and display the values of variables. They have long been present in VS, and I think everyone is familiar with them. Now instead of them, PerfTip performs the same goal: it makes debugging easier and increases its productivity. In contrast to the Debugging tips, in PerfTip, when navigating through the code, information about timing is displayed. Previously, we had to collect timings line by line, inserting code for measurements, like the class
System.Diagnostics.Stopwatch . But now there is no need for this: PerfTip can measure the time elapsed between two debugger stops. And it does not matter whether you use Step Into, Step Over or Run to Cursor to measure only one instruction or a whole block of code. Timings are displayed both in PerfTip and as a list in the Diagnostic Tools Window).')
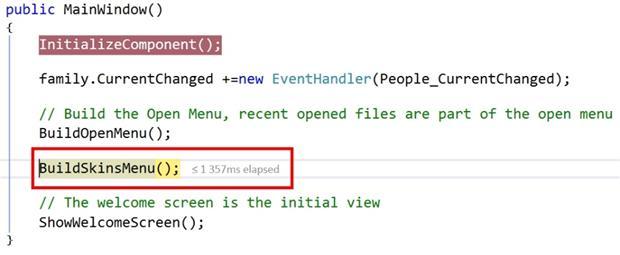
PerfTip shows that it took 1.357 seconds to execute the
BuildOpenMenu () method.Edit & Continue mode for x64 systems
The “edit and continue” functionality appeared in VS several years ago, but earlier it could only be used for debugging 32-bit processes. In this mode, you can modify the code without leaving the debugging session. At the same time, it is recompiled in the background and immediately ready for use. The advantages are obvious: you can execute the code line by line, analyze the result, modify, move the cursor of the transition operator to the position in front of the modified line and execute it again. And you don't even need to restart the debugger.
As follows from the title, now this mode is also available for 64-bit processes. However, this requires .NET Framework 4.5.1 or higher.
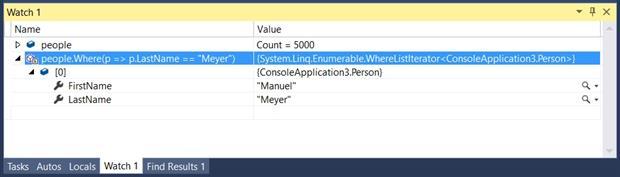
Calculating lambda expressions in the Watch and Immediate Window
VS 2015 now supports lambda expression evaluation in debug windows. This is convenient, for example, when analyzing collections. Suppose you have a list of people with 50,000 entries, and you need to find a person with the last name Meyer. Previously, this could only be done in one way: by adding a collection to the watch window (by opening the window), expanding it and scrolling through the entire list manually. Not too exciting and effective process, especially if the list is long. Now you can find the desired entry with a simple LINQ expression:
Diagnostic Tools Window
During debugging in this window, you can use tools for profiling. To open it, select Show Diagnostic Tools from the Debug menu. By default, it will display graphs of CPU and memory usage. Yellow markers indicate the work of the garbage collector. In previous versions of VC, all this data could only be obtained during a profiling session. Now, instead of a multiple recording and analysis procedure, you can monitor the system behavior in real time during the debugging process. You will immediately find outbursts in the use of resources, including when collecting garbage, and will be able to compare them with a debugged code fragment or action performed in the interface.
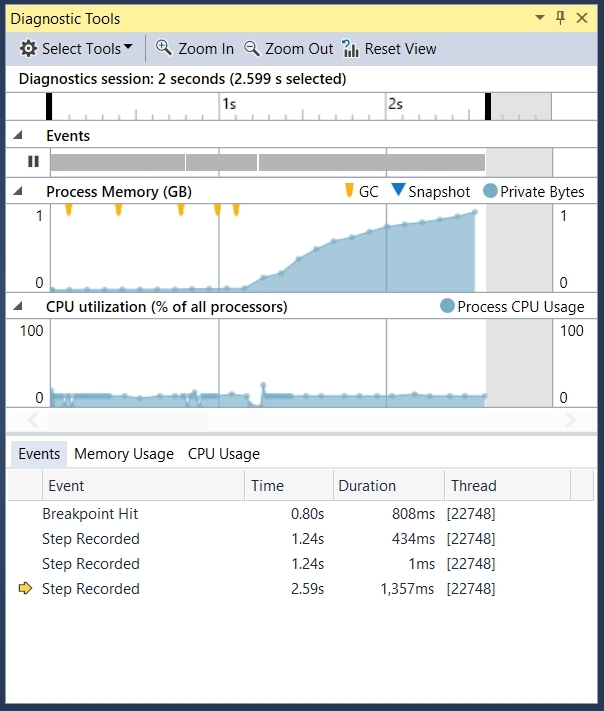
Another important innovation was the list of all PerfTip. Each time the debugger stops and displays PerfTip, it adds a new dimension to the Diagnostic Tools Window. Thanks to this list you can watch the time measurements and quickly move to the corresponding lines.
The diagnostics window allows you not only to estimate the CPU and memory load, but also to record an impression of managed memory with one click. In this case, the system automatically calculates and displays the number of objects in the heap, as well as their total size in bytes. These values can be clicked and see a detailed list of all objects present in the memory. All this allows you to quickly find the causes of any memory problems, such as leaks. Please note that this tool is fully integrated into the debugger and does not require its restart.
Live Visual Tree and Live Property Explorer
These are two tools designed specifically for WPF applications (Windows Presentation Foundation) and universal applications. With their help, you can analyze a running program by displaying it as a “visual tree” (visual tree). A visual tree is an internal representation of the user interface that contains all the visible elements of the application. It turns out very similar to the tools for web developers, launched in browsers with the command "explore the element." The visual tree allows you to select a user interface element with one click, view and change both the element itself and its properties. All changes will be immediately applied in the running application. Previously, this could be done only with the help of third-party applications, for example, Snoop or WPF Inspector.
The illustration below shows an example of a visual WPF application tree. The Family.Show program is presented on the left, its reference WPF implementation was created by Vertigo and is available for download on Codeplex. The illustration shows a picture of Prince Charles, and its properties are displayed on the right in Live Visual Tree. The tree starts with the MainWindow class and is expanded up to the selected object. And in the column on the right, the number of child objects for each visual element is displayed.

If you right-click on an object inside the tree, the context menu appears. It has useful items Go to source and Show Properties. The first opens a XAML file containing the definition of the item. And the second item launches Live Property Explorer.
Here are the properties of the element and their values. At the same time, Live Property Explorer allows you to group properties by the origin of their values. From the illustration it is clear that the values are default, calculated, inherited and local. They can also be obtained from the XAML style definition file. All values can be changed directly in the Live Property Explorer and immediately see what effect it has on a running application.

Diagnostic Tools Hub
This tool appeared in Visual Studio 2013. You can run it through Debug -> Start Diagnostic Tools without Debugging , it is the launch point for all tools related to performance and diagnostics. Diagnostic Tools Hub is a collection of numerous small tools, each of which measures, records, calculates and displays only one parameter in the Visual Studio window. All tools use a single structure of data visualization in the form of a timeline with details for each record. The scale is a histogram of the main dimension, which can display custom markers for special events or values. You can view the data in more detail, with the display form will be different for all tools. So, if you wish, you can study in more detail the parameters of any measurement and display general information in the form of a pie chart. Since the output format of all instruments is common, during the same session you can simultaneously launch several instruments by viewing the results of their measurements in a compact form. For example, you can combine a user interface activity indicator and a processor load level. Previously, these tools were sharpened, mainly for Windows Store applications. Due to its simplicity and unified design, the toolkit is very often updated, and in VS 2015 many of them support other technologies, such as the Windows Presentation Foundation.
The old profiler in Visual Studio, which was able to measure CPU and memory usage, did not fit into the concept of small diagnostic tools with a standard output format. Therefore, for backward compatibility, it was integrated into Diagnostic Tools Hub. The creators of VS plan to gradually distribute the profiler functionality into several separate tools available from the hub.
So, what is the set of tools presented in the Diagnostic Tools Hub in Visual Studio 2015:
- Application Timeline : allows you to monitor the activity of UI-flow of applications based on XAML
- CPU Usage : CPU Usage ()
- GPU Usage : displays graphics card instructions for DirectX applications.
- Memory Usage : displays memory consumption for leak detection
- Performance Wizard : Old Visual Studio Profiler
- Energy Consumption : displays estimated power consumption for mobile devices
- HTML UI Responsiveness : allows you to monitor the activity of the UI flow of applications based on HTML
- JavaScript Memory : analyzes memory usage in HTML applications
- Network : profiles network traffic
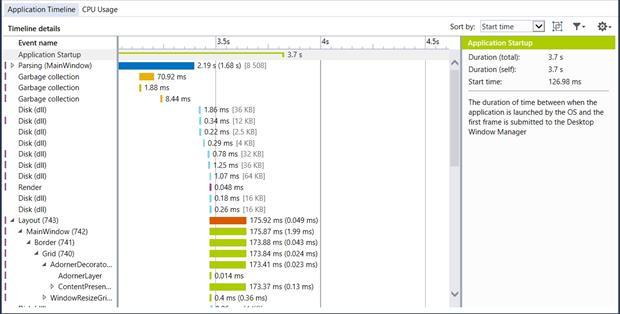
The following illustration shows the graphs of a number of system parameters when running a WPF application. In this case, Application Timeline and CPU Usage are used. The scale shows the activity of the UI and the frame rate in the FPS. Separately, XAML parsing, layout output, rendering, input / output operations, application code and other activities are shown. Color differentiation allows you to quickly navigate the graph. The CPU utilization graph reflects the processor load, in this example it is involved at 12.5%. That is, on the eight-core machine, one core is fully occupied by the UI thread. If necessary, you can adjust the scale of the scale and explore some intervals in more detail.

The following is an example of detailed detailing of the same session. Events are divided into categories and displayed in the form of strips, the length of which corresponds to the duration of each event. This makes it very easy to estimate how much time it took you to parse, display the layout, read and write from disk, or garbage collection. Some events can be expanded as a tree for even more detailed study.
Conclusion
In Visual Studio 2015, there are many great debugging, diagnostic, and profiling features that can help improve developer productivity. All mentioned tools are in each VS edition, up to the free Visual Studio Community Edition. Here you will find everything you need. In this case, for the first time in the history of VS, profiling can be performed directly during debugging. In Visual Studio 2015, application profiling is combined with a convenient daily debugging process used by developers.
Useful links:
- Family.Show, WPF application: https://familyshow.codeplex.com/
- Snoop - The WPF Spy: https://snoopwpf.codeplex.com/
- WPF Inspector: http://www.wpftutorial.net/Inspector.html
- Visual Studio Community: https://www.visualstudio.com/en-us/products/visual-studio-community-vs.aspx
Source: https://habr.com/ru/post/276027/
All Articles