Machine learning techniques for predicting stock prices: indicator functions and news analysis
In our blog, we have already covered the topic of predicting stock prices using an adaptive filtering algorithm . A New York-based financier, Vatsal Shah, in his work considered the possibility of using machine learning algorithms for this purpose. We bring to your attention the main thoughts of this document.
Introduction
There are two methods for predicting stock prices:
')
- Fundamental analysis - in this case, analysts evaluate information that is more relevant to the company, whose shares are traded on the stock exchange, rather than to the shares themselves. Decisions on certain actions on the market are made based on an analysis of the company's previous activities, revenue and profit forecasts, and so on.
- Technical analysis - in this case, the behavior of the stock price is examined and its various patterns are identified (time series analysis is used).
In the case of the use of machine learning methods for processing trade data, it is often the technical analysis method that is used - the goal is to understand whether the algorithm can accurately determine the patterns of stock behavior over time. However, machine learning can also be used to evaluate and predict the results of a company’s operations for further use in fundamental analysis. In the end, the most effective method of automated stock price prediction and generating investment recommendations is a hybrid approach that combines the approaches of fundamental and technical analysis.
The efficient market hypothesis
The Efficient Market Hypothesis (EMH) hypothesis assumes that all relevant information immediately and fully affects the market value of securities. There are three forms of market efficiency: weak, medium and strong. The weak form implies that the value of a market asset fully reflects past information, and strong - that value reflects all information, both past and public or internal.
Hypothesis of random walk
The mathematical model of random walk (Random Walk Hypothesis) suggests that changes in the price of shares at each step do not depend on the previous ones and on time. Thus, it is impossible to identify any patterns of price behavior and use them.
Indicator Functions
For technical analysis of market prices, various attributes and indicators are used. The latter include, for example:
- Moving Average (MA) - displays the average n past values up to the current moment;
- Exponential Moving Average (EMA) - gives more weight to the most recent values, but does not discard the old values completely;
- Momentum or rate of change (Rate of Change, RoC) is one of the simplest technical indicators, calculated as the ratio or difference between the current price and the price n periods ago.
- The relative strength index (Relative Strength Index, RSI) - determines the strength of the trend and the probability of its change during a certain time (usually, 9-14 days).
For the described project, EMA was chosen as the main indicator - it allows you to process a virtually unlimited amount of historical data, which is very important for analysis using time series. However, it is worth noting that the use of other indicators can also bring greater accuracy of forecasts of the analyzed shares.
EMA (t) = EMA (t-1) + alpha * (Price (t) - EMA (t-1))where, alpha = 2 / (N + 1), thus, for N = 9, alpha = 0.20
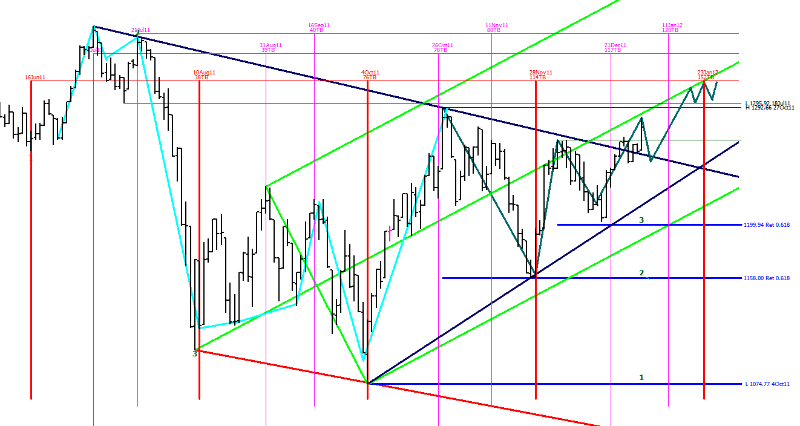
In theory, the problem of predicting the stock price can be considered as an estimate of the function F in time T based on the previous values of F at time t-1, t-2 ... tn, assigning the appropriate weight function w to at each moment F:
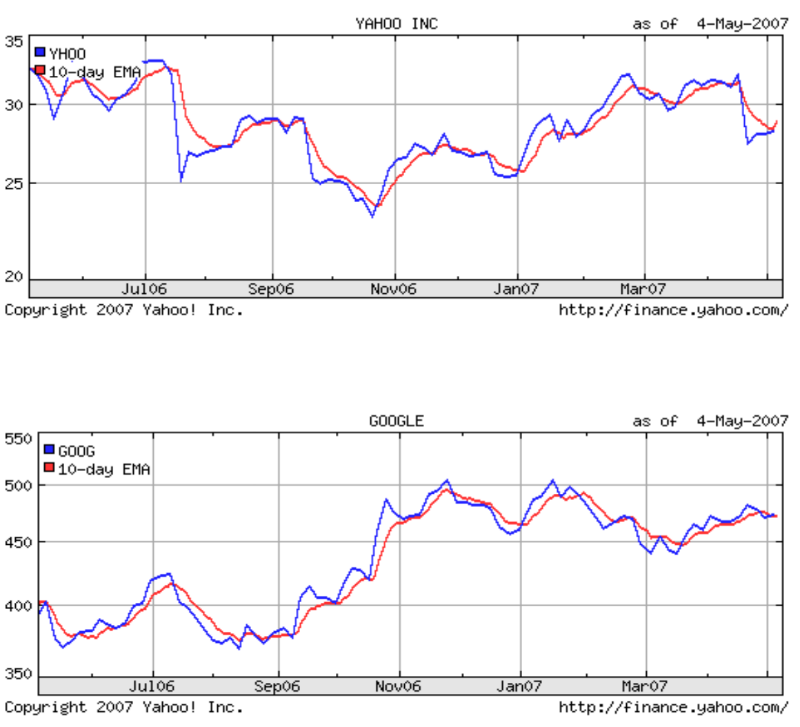
F (t) = w1*F (t-1) + w2*F (t-2) + … + w*F (tn)The chart below shows how EMA models the current stock price:
Learning environment
During the project, Weka and YALE data mining environments were used. The configuration looked like this:

The attribute selection step for some machine learning methods was skipped because their total number was less than 10.
Pre-processing of historical data
For the experiment, Yahoo Finance has uploaded historical data on the stock prices of Google Inc. (GOOG ticker) and Yahoo Inc. (YHOO). The data set had the following attributes: Date Open High Low Close Adj. Close.
The EMA indicator assumes that the stock price on the previous trading day will have the highest value at the current price. Thus, the closer the time point is to the current moment, the more value it has on the price of the current day. In the course of time analysis, the researcher took the Date as the X axis - each date represented an integer value. Another attribute has been added to the existing attributes - Indicator, in this particular case EMA.
Machine learning techniques
In this section, the research presents the results of applying various machine learning algorithms.
Decision Stump Algorithm
The application of a simple algorithm for predicting EMA has achieved the following results:
- Correlation coefficient 0.8597
- Mean absolute error 46.665
- The root mean square error 57.8192
- Relative absolute error of 46.8704%
- Root mean square relative error 50.9763%
- Total number of periods 681
Linear regression
Using simple linear regression (using only numerical attributes) to predict EMA yielded the following results:
- Correlation Coefficient 0.9591
- Mean absolute error 12.9115
- The root mean square error is 32.0499
- Relative absolute error 12.9684%
- Root RMS relative error 28.2568%
- Total number of periods 681
Support Vector Machine
Using the support vector method (C-Class) with the application of the radial basis function of the kernel with the C parameter in the range from 512 to 65536, allowed us to obtain the following accuracy for predicting the price movement:
Root RMS error: 0.486 ± 0.012
Accuracy: 60.20 ± 0.49%
Busing
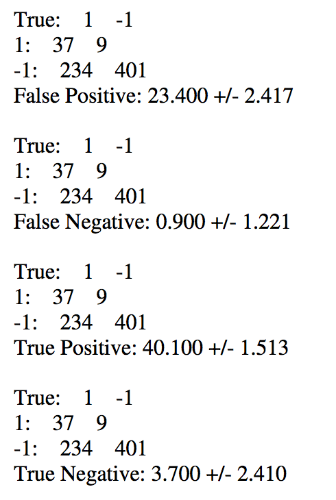
After using the C-SVC algorithm, the AdaBoostM1 boosting algorithm was applied to the dataset to achieve a significant improvement in accuracy.
Root RMS error: 0.467 ± 0.008
Accuracy: 64.32% ± 3.99%
From the output of YALE, the following inaccuracy matrix was extracted:
Share price prediction based on textual analysis of financial news
Currently, a large amount of valuable data that may affect the situation on the market is available online (we wrote about this effect in our article ). Most of this information is contained in financial news, company reports and expert recommendations (for example, a blog of insiders and analysts, for example, can serve as a source of such recommendations). Most of this data is presented in text format, which makes it difficult to use it. Thus, a new problem is the need to analyze text documents simultaneously with the analysis of time series.
The researcher used a method that involves determining the degree of influence of news on a specific stock: it can be positive (Positive), negative (Negative) or neutral (Neutral).
It is believed that the news has a positive effect (or negative) if the price of the stock rises seriously (or falls) in the period immediately after its publication. If the stock price does not seriously change after the news is published, then its effect is considered neutral.
Another method used involves the definition of patterns in news articles that directly correspond to an increase or decrease in the price of shares. It works as follows:
A special search robot passes through news articles and indexes them for a specific portfolio of stocks. The learning environment requests news for the period T minutes from the moment of indexing. This environment consists of several training modules that search for the necessary information in the text of a news note or materials from expert blogs (for example, “the price of oil will decrease”). The dictionary for analysis includes words and phrases that affect the conditions of positive (Positive Prediction Terms) or negative movement (Negative Prediction). Each time a phrase from the set of Positive Prediction Terms appears in the text of the article, it is assigned a positive Vote.
The diagram below shows the architecture of such a system:

As it is easy to see, this method allows you to make only rather rough assumptions. To increase their accuracy, it is necessary to add more weights to the articles - for example, based on the ranking of information sources for publication. In addition, text header formats containing phrases from the Positive or Negative Prediction Terms sets should be considered.
Use as weight news authoritativeness experts
The researcher also describes the use of an assessment of the authority of experts who express a particular point of view for additional weighting of text materials. For example, for Google shares, he picked up a list of analysts who have been writing about this company for a long time, and he noted the quality of their predictions with asterisks:

At the entrance of the system, the opinions of stock market experts are presented (just their opinion, which is not necessarily true), and then, based on their forecasts, predictions of possible price movements are made time after time. At each iteration, the weight of the expert, whose prediction turned out to be true, rises, while for those who made a mistake, on the contrary, it decreases. Another type of method involves the complete removal from the list of those experts who made a mistake, but it is not the most effective - after all, even the best and most respected financial analysts are mistaken.
The expert weighting algorithm can be described as follows:
Given: vector E = {e1, e2,… .eN} of financial experts and their forecasts.
Assign a weight W (e (i)) = 1 for each expert e (i).
For the round t in 1 ... T
Make a prediction based on a weighted majority algorithm .
For experts who made the correct prediction W (e (i)) (t) = 2 * W (e (i)) (t-1)
For experts who made an incorrect prediction W (e (i)) (t) = ½ * W (e (i)) (t-1)
Save expert rating (Expert Rating) for subsequent weighing.
Such a weighing technique based on expert opinions can be viewed as a hybrid approach combining fundamental and technical analysis — experts make predictions based on fundamental analysis, and the algorithm subsequently uses them to generate their own forecasts using technical analysis methods.
Conclusion
Of all the algorithms used, only a combination of the support vector method and the boosting algorithm made it possible to achieve any satisfactory prediction accuracy results.
Another promising method of analysis is the weighting of experts. However, at present, the effectiveness of linguistic analysis methods for generating forecasts of stock price movements is a subject of further study and no definite conclusions can be drawn about its applicability in practice.
Source: https://habr.com/ru/post/275825/
All Articles