How we prepared Elasticsearch, or How to process 36 thousand logs per second
At one fine moment for one of the projects there was a need for storing, processing and visualizing a large number of logs. It was necessary to index about 10-20 thousand requests per second with peaks up to hundreds of thousands, which, as it turned out, is a nontrivial task. To solve this problem, we decided to use the ELK stack already familiar to many. The only question was - “will he pull?” As it turned out, pull, but not immediately.
The brief description of the task was as follows: there are a bunch of nodes, they send a bunch of logs to the server, where they need to be processed and saved in a certain way. The number of logs seemed to us about 10-20 thousand logs per second with short-term peaks of up to 100-150 thousand per second.
We had the following configuration: three servers, on each Logstash + ElasticSearch. They also wrote a simple java program on the same server, which generates and sends logs in the form of strings to one address via TCP. Servers are average, 16 cores, 32 GB of RAM and no ssd.
We started ES by changing only the parameter indices.memory.index_buffer_size (which sets the size of the buffer for indexing) by 30% (according to the standard 10%). After looking at this manual, we created a configuration file for the logstash:
')
We started the generator and got ... 11 thousand logs per second. And this is without any processing logs! Inadmissibly little, we won't even survive a normal job, let alone the "explosions" of the logs. We started to read, started to look, came across an article about the performance of ES, where it was said that the number of shards and replicas greatly influenced the speed of indexing. For such settings in ElasticSearch meet the index-templates, which configure the newly created indexes. Said and done, created a template:
Change the number of shards to 9 and the number of replicas to 0 (according to the standard 5 shards and 1 replica) and run the test. 16 thousand per second! Acceleration and a half times: not bad, but still not enough. By experiments, we found the optimal number: 18 shards, 18 thousand logs per second. Further it did not leave. Still a little. Having looked at the server load schedule during operation, we saw that the processor is 20% loaded, load is even less, and we don’t rest on io either. So there is still room for optimization! We decided to go to the settings of Logstash. In the output, we set workers => 8, which shows that to send logs to ES, use 8 “workers”, after which the speed increased to 20 thousand \ sec. Still a little.
Somehow, in a strange way, someone from our team came to discuss the LS error associated with OOM, to solve it, we recommended manually setting the environment variable LS_HEAP_SIZE, which controls the amount of memory for the LS process (putting -Xmx when launching the application). Although the Kopf plugin showed only 40% heap usage (200 mb out of 512) tried to put it out, more out of interest. And it worked! On the same settings, on which with the default LS_HEAP_SIZE there were 20 thousand with LS_HEAP_SIZE = 8gb, 38 thousand logs per second were obtained.
The attentive reader must have noticed a mismatch: the ES cluster consists of 3 servers, and the generating application is one. Indeed, for the previous tests, the application wrote logs to one of the three servers. For the full test, we copied the LS settings to all three servers, set LS_HEAP_SIZE = 8gb to them all, launched three generating applications and hoped to get a three-fold increase in productivity (38 * 3 = 114 thousand logs per second), but it turned out "only" 95 thousand. Do not forget: there is no log processing yet.
Further studies of the ES and LS settings did not improve the situation, and the current performance did not suit us, because clients cannot write more than 32 thousand logs per second to a single server, “stopping” when sending network packets to Logstash. We thought, read, and decided to use a buffer between the generating application and Logstash. Redis could act as such, but first we decided to try to implement a simpler thing.
And that's what we did: instead of sending logs directly to Logstash, we take them to Rsyslog and add them to a file. According to our tests, the performance of Rsyslog in receiving and recording logs reaches about 570,000 logs per second, which covered our needs several times. From the file, these logs are then read by logstash, which processes them and sends them to ES.
As a result, the LS configuration was as follows:
We tested it on three servers at once, got 66 thousand \ sec. But now we are able to experience peaks of any size (most importantly, not too often, so that the average flow of logs does not exceed 66,000 logs / s).
Having stopped on it, added processing of logs. The processing was purely symbolic, just parsing logs through the Grok filter and 5 if conditions:
We tested it immediately on 3 servers, got the figure 46 206 logs \ sec, which is already enough for the normal operation of the application, and for processing data from the file - the buffer after the peaks.
There is, however, one BUT: one of the developers had the idea that the performance of ES could degrade over time. We decided to check - we set the system to work for 9 hours without stopping. The results were not pleased: for the first couple of hours everything was fine, then the performance began to sag a lot: a total of about 30 thousand per second came with second drops to zero.
5 hours after this, we launched the generation again and received already familiar 46 thousand. For 9 hours, we collected 1,203,453,573 log files, which is 37143 logs per second. Since the normal operation of the system will be designed for a much smaller volume, we decided that it suits us perfectly. It was suggested that this behavior of ES is related to the fact that it needs to rebuild the index on the fly every 30 seconds (specified in the settings), and since its volume with this amount of information tends to half a byte, it does he is long. The study of server logs indirectly confirmed the conjecture: the server rested on iowait, with a large number of reads from the disk.
If someone knows in more detail what it is connected with and how to solve it - we are waiting for your comments.
The brief description of the task was as follows: there are a bunch of nodes, they send a bunch of logs to the server, where they need to be processed and saved in a certain way. The number of logs seemed to us about 10-20 thousand logs per second with short-term peaks of up to 100-150 thousand per second.
We had the following configuration: three servers, on each Logstash + ElasticSearch. They also wrote a simple java program on the same server, which generates and sends logs in the form of strings to one address via TCP. Servers are average, 16 cores, 32 GB of RAM and no ssd.
We started ES by changing only the parameter indices.memory.index_buffer_size (which sets the size of the buffer for indexing) by 30% (according to the standard 10%). After looking at this manual, we created a configuration file for the logstash:
')
Initial settings
input { tcp { port => "1515" } } output { elasticsearch { cluster => "elasticsearch" embedded => false host => "localhost" index => "performance_test" } } We started the generator and got ... 11 thousand logs per second. And this is without any processing logs! Inadmissibly little, we won't even survive a normal job, let alone the "explosions" of the logs. We started to read, started to look, came across an article about the performance of ES, where it was said that the number of shards and replicas greatly influenced the speed of indexing. For such settings in ElasticSearch meet the index-templates, which configure the newly created indexes. Said and done, created a template:
template
template" : "performance*", "settings" : { "index.number_of_shards" : "9", "index.refresh.interval" : "30s", "index.number_of_replicas" : "0" }, "mappings" : { }, "aliases" : { } Change the number of shards to 9 and the number of replicas to 0 (according to the standard 5 shards and 1 replica) and run the test. 16 thousand per second! Acceleration and a half times: not bad, but still not enough. By experiments, we found the optimal number: 18 shards, 18 thousand logs per second. Further it did not leave. Still a little. Having looked at the server load schedule during operation, we saw that the processor is 20% loaded, load is even less, and we don’t rest on io either. So there is still room for optimization! We decided to go to the settings of Logstash. In the output, we set workers => 8, which shows that to send logs to ES, use 8 “workers”, after which the speed increased to 20 thousand \ sec. Still a little.
Somehow, in a strange way, someone from our team came to discuss the LS error associated with OOM, to solve it, we recommended manually setting the environment variable LS_HEAP_SIZE, which controls the amount of memory for the LS process (putting -Xmx when launching the application). Although the Kopf plugin showed only 40% heap usage (200 mb out of 512) tried to put it out, more out of interest. And it worked! On the same settings, on which with the default LS_HEAP_SIZE there were 20 thousand with LS_HEAP_SIZE = 8gb, 38 thousand logs per second were obtained.
The attentive reader must have noticed a mismatch: the ES cluster consists of 3 servers, and the generating application is one. Indeed, for the previous tests, the application wrote logs to one of the three servers. For the full test, we copied the LS settings to all three servers, set LS_HEAP_SIZE = 8gb to them all, launched three generating applications and hoped to get a three-fold increase in productivity (38 * 3 = 114 thousand logs per second), but it turned out "only" 95 thousand. Do not forget: there is no log processing yet.
Further studies of the ES and LS settings did not improve the situation, and the current performance did not suit us, because clients cannot write more than 32 thousand logs per second to a single server, “stopping” when sending network packets to Logstash. We thought, read, and decided to use a buffer between the generating application and Logstash. Redis could act as such, but first we decided to try to implement a simpler thing.
And that's what we did: instead of sending logs directly to Logstash, we take them to Rsyslog and add them to a file. According to our tests, the performance of Rsyslog in receiving and recording logs reaches about 570,000 logs per second, which covered our needs several times. From the file, these logs are then read by logstash, which processes them and sends them to ES.
As a result, the LS configuration was as follows:
final configuration
input { file { path => "/root/logs/log.log" start_position => "end" } } output { elasticsearch { cluster => "elasticsearch" embedded => false host => "localhost" index => "performance_testing" workers => "8" } } We tested it on three servers at once, got 66 thousand \ sec. But now we are able to experience peaks of any size (most importantly, not too often, so that the average flow of logs does not exceed 66,000 logs / s).
Having stopped on it, added processing of logs. The processing was purely symbolic, just parsing logs through the Grok filter and 5 if conditions:
Grok filters
filter { grok{ match => {"message" => "%{MONTH:month} %{NUMBER:date} %{TIME:time} %{URIHOST:sender} %{WORD:grokanchor} %{NUMBER:mstatus} %{WORD:salt}"} remove_field => ["grokanchor"] } if [mstatus]{ if [mstatus] > "90"{ mutate { add_tag => ["morethanninety"] } } else if [mstatus] > "80"{ mutate { add_tag => ["morethaneighty"] } } else if [mstatus] > "70"{ mutate { add_tag => ["morethanseventy"] } } else if [mstatus] > "60"{ mutate { add_tag => ["morethansixty"] } } else if [mstatus] > "50"{ ate { add_tag => ["morethanfifty"] } } } } We tested it immediately on 3 servers, got the figure 46 206 logs \ sec, which is already enough for the normal operation of the application, and for processing data from the file - the buffer after the peaks.
There is, however, one BUT: one of the developers had the idea that the performance of ES could degrade over time. We decided to check - we set the system to work for 9 hours without stopping. The results were not pleased: for the first couple of hours everything was fine, then the performance began to sag a lot: a total of about 30 thousand per second came with second drops to zero.
Number of logs per hour
5 hours after this, we launched the generation again and received already familiar 46 thousand. For 9 hours, we collected 1,203,453,573 log files, which is 37143 logs per second. Since the normal operation of the system will be designed for a much smaller volume, we decided that it suits us perfectly. It was suggested that this behavior of ES is related to the fact that it needs to rebuild the index on the fly every 30 seconds (specified in the settings), and since its volume with this amount of information tends to half a byte, it does he is long. The study of server logs indirectly confirmed the conjecture: the server rested on iowait, with a large number of reads from the disk.
Server load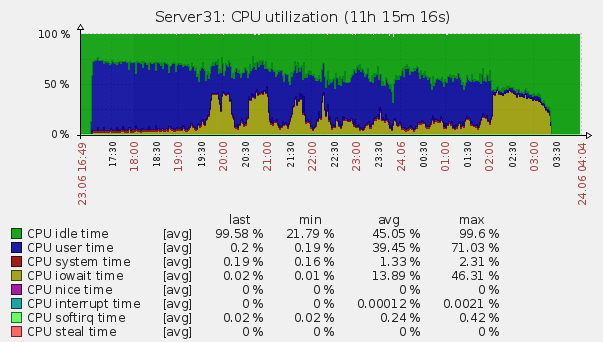
If someone knows in more detail what it is connected with and how to solve it - we are waiting for your comments.
Source: https://habr.com/ru/post/275815/
All Articles