Zabbix vs graphics
Zabbix allows you to easily and conveniently configure monitoring of a large number of different meters from multiple devices. It was opened under the GPL in 2001, and over the past 15 years, a lot of improvements have certainly been made to even better collect even more data.
But why all the improvements have bypassed the navigation on such a large number of collected graphs and their display?
What is now
The main task for which Zabbix is used in our company is an assessment of trends, and not current alerts and triggers. Those. basically, we need to quickly open all the charts for one server, or the same chart for a group of servers.
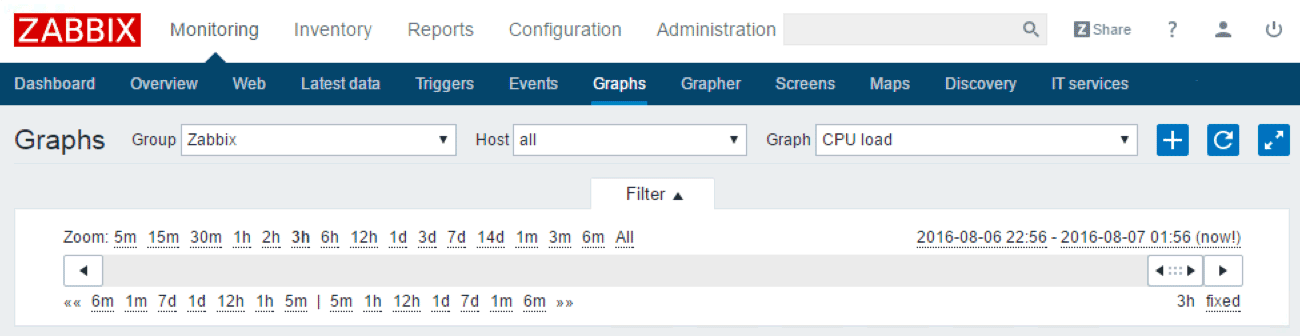
What does the standard zabbix-frontend-php offer us for this?
')
Nothing! You can select a group, then select a host from it, then select a schedule for that host. Each choice is accompanied by a full page reload, and although the all option is present, all the same, only one graph will be displayed.
You will say that the solution to this problem is Screens , which must be created in advance with charts such as the Dynamic item . Unfortunately, this solution only adds problems when you just need to open the desired Screen from the list over 9000 in plain list.
Did you try to quickly open Screen created on a host through a template? Then switch to the next host?
Server-side graphs
The problem is recognized by users, and feature-requests for displaying graphs are in the top JIRA developers. And users not only ask, but also collective farms. So a patch was found in ZBXNEXT-75 (rooted in 2006) which adds a seemingly obvious thing:
If we select a group in the graphs, then a server from it, and leave the graph all - then all the graphs for this host will be displayed on one page. The same is true for selecting a specific schedule, but specifying the server name all - the specified schedule for all servers of the group will be displayed.
It would seem so logical - that simply must be present "out of the box"!
Cristian added a comment - 2013 Dec 04 18:44The patch was installed, and for some time allowed to breathe easier. And also the reason why this functionality was not officially implemented was immediately found out - the performance of image generation on the server side leaves much to be desired. This is tolerable when the picture on the page is one, but when there are already 20 of them - it becomes noticeable.
Btw, I simply don’t include Zabbix source. The patches are quite easy to add.
Client-side graphs
Let us recall for a moment that now is the year 2016 and fashionable youth systems such as Graphite , Grafana , Chronograf render graphs on the client side. Moreover, for Grafana there is even a data-source plugin for Zabbix :
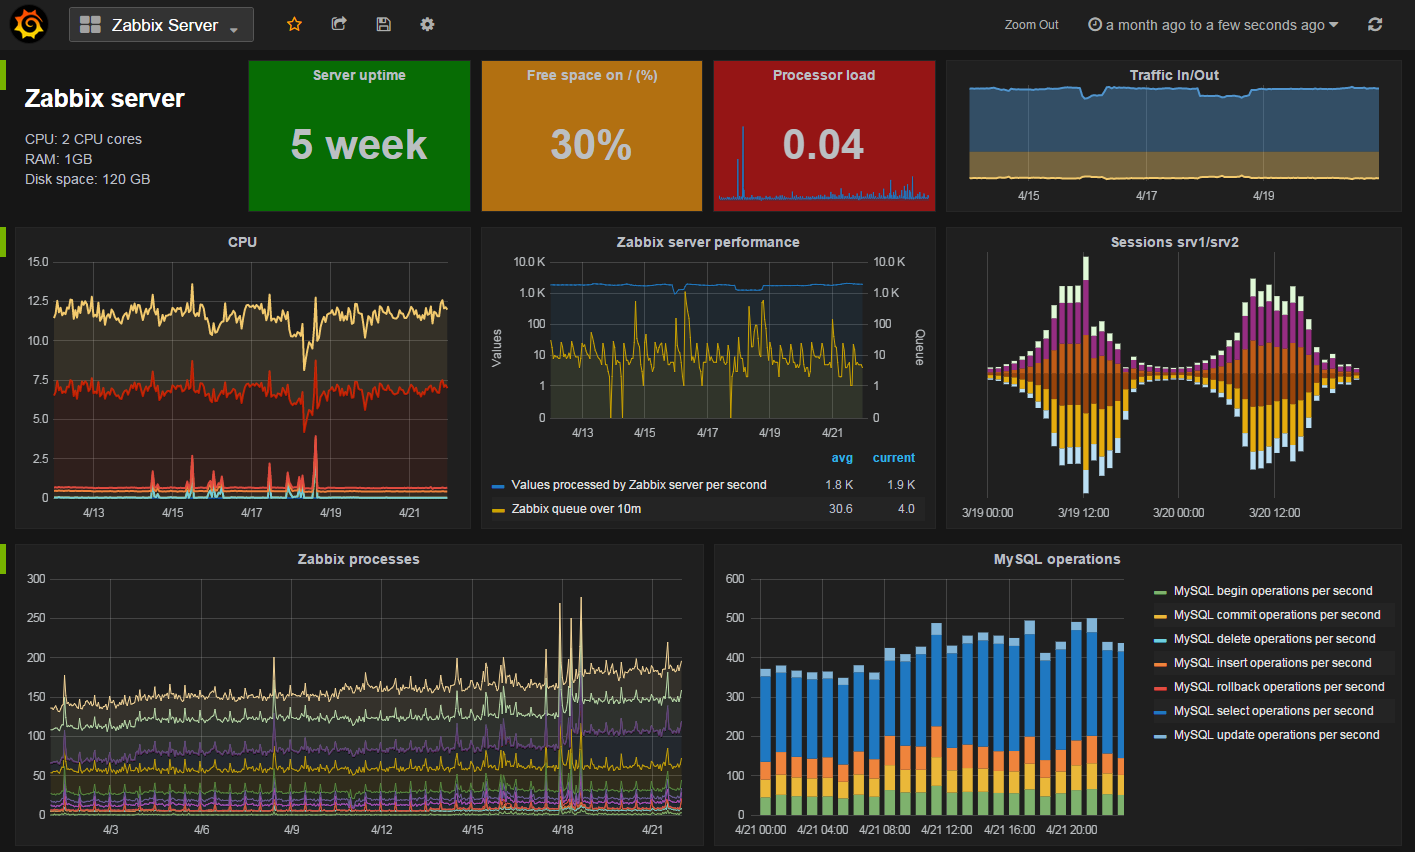
This is a great opportunity to feel something new on the already collected native data, to look at them from a different angle. And due to relative simplicity, I recommend it to everyone. A good comparison of the original features and Grafana you can see in the wiki
But unfortunately for us the plugin did not fit for several reasons:
- Very slow work related to the capabilities of the Zabbix API. When we tried Grafana, getting the story was a patch of ZBXNEXT-1193 . But now there is no downsampling in the API . If you are watching the schedule for the month and the meter is going once a minute, get ready for the browser to load json with all the data and try to draw it. Not to mention the fact that the size of the data will be larger than the picture would weigh.
- Only counters and their history of values are available. All graphs created with them in Zabbix should be created as templates in Grafana again. With the help of writing queries, you can draw anything, but this does not help when you want to quickly glance at the already created set of graphs.
Those. I would like something more integrated in Zabbix, because its template inheritance system is quite convenient. It is a pity that the 2013 initiative to transfer the rendering to D3.js died. Yes, zabbix-d3 works, but rests on the same architectural limitations of the API. It is hoped that the many ZBXNEXT that were created to support D3 will someday be implemented. It will also improve the performance of Grafana, and its potential competitors in the future. (Developers, do not miss your chance to get rid of almost adult PHP code!)
Server-side graphs # 2
Different companies solved the problem of graphs in Zabbix in different ways, so Ring Central, among other things, made a separate farm for rendering graphs.
With a separate web interface for navigating and viewing:
(The screenshot in high quality is provided by the author TPAKTOP_666 , who responded after publishing the article) Some information on Tula is available in the presentation on slideshare , a little - in a speech at ZabbixConf. I did not find anything else in the public domain, but it is clear that the tool allows you to make a graph from any counters that are not even united by one graph earlier. Also interesting is the ability to send a link to the generated set of graphs.
The idea of moving the rendering of images to the server farm seemed simple solution to the forehead, and was tested. That coupled with caching in nginx and the transition to php7 gave some performance gains. Enough to look again at the improvement in the navigation of the current web interface.
The main problem with the ZBXNEXT-75 patch mentioned above was that with every filter change, the page reloaded completely. Yes, it would be possible to rewrite it to js, and come for all the necessary data in Zabbix API on the fly - but to use the API, authorization and a token is needed. It would be foolish to ask the user to enter the password twice, once for PHP, the second - for js.
The last click, which put everything in its place, was a wonderful script from Toshiyuki-san zabbix-graph-viewer :

When working, he did not ask for authentication, and this was done in just one line (yeah, less than 30;) on js:
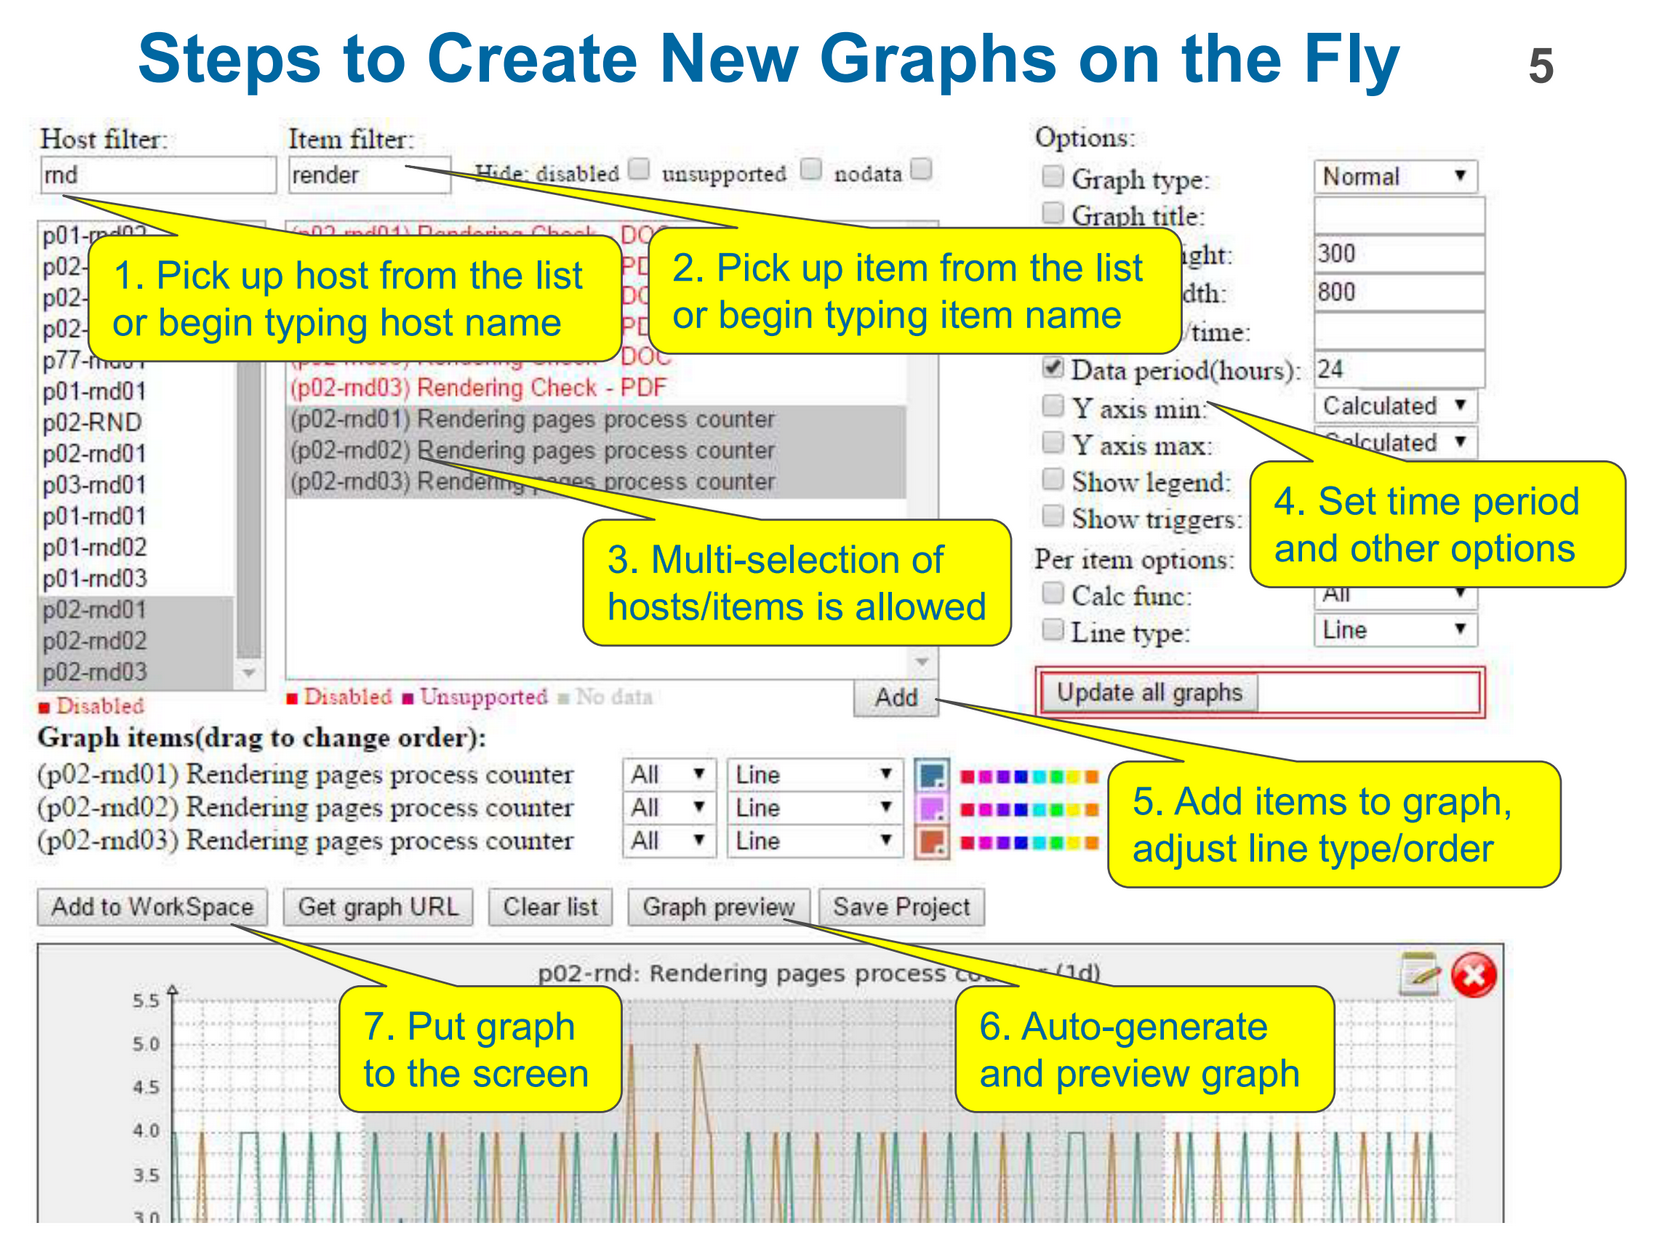
auth: $cookies.zbx_sessionid, Those. The notorious zabbix API token is just an SSID, and is already in the cookie. After that, it became quite simple to rewrite the idea of ZBXNEXT-75 to js. We roll up our sleeves and zabbixGrapher appears:
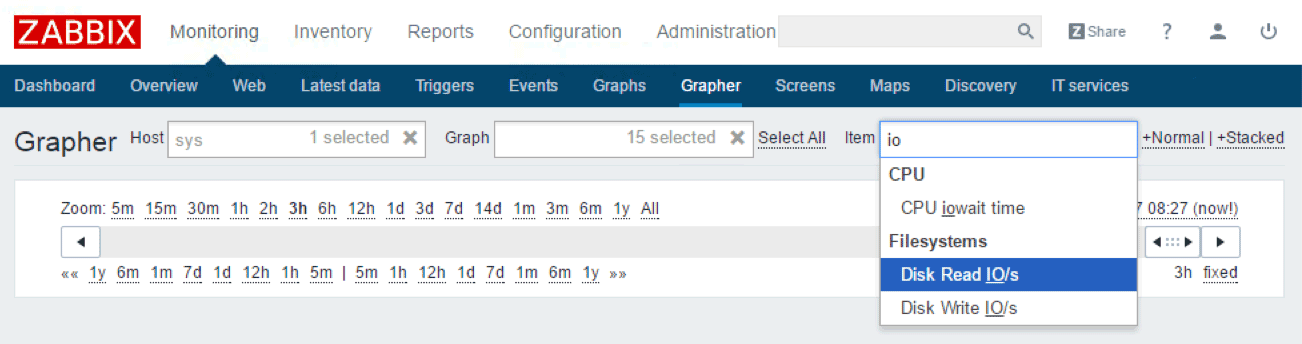
In addition to the ability to view arbitrary graphs already created by hosts, we also managed to implement the ability to create graphs for any meters on the fly. It uses html5 history which changes the URL when the page status changes - this allows you to share a link to your selection of charts.
Lld
The ability to generate graphs on the fly has also become a solution for ZBXNEXT-927 (in the JIRA top number 2) in some way. In short, the problem is as follows:
- You have LLD, for example, to identify all drives on the server. He successfully creates a counter, for example,
Free disk space, % for each disk- In LLD, you can create only a separate graph for each disc found. You cannot create one graph to display free space on all disks:
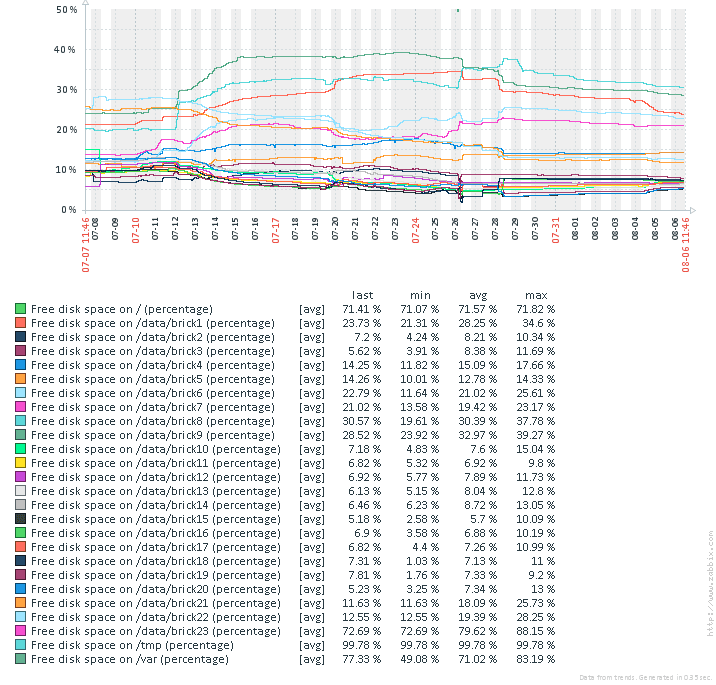
Such a schedule can be created manually, on the host, from the detected counters. After a while, the disk will be replaced, or a new one will be added, and your schedule will no longer fully reflect reality.
Yes, there are scripts to automate the creation and updating of such graphs from 2012. But their main problem is that you need to remember them. For example, when creating a new template with hosts, do not forget and update the configuration of such a script. It would be nice to edit the config in the same web interface. Let's go, it's fun! So gLLD appeared:
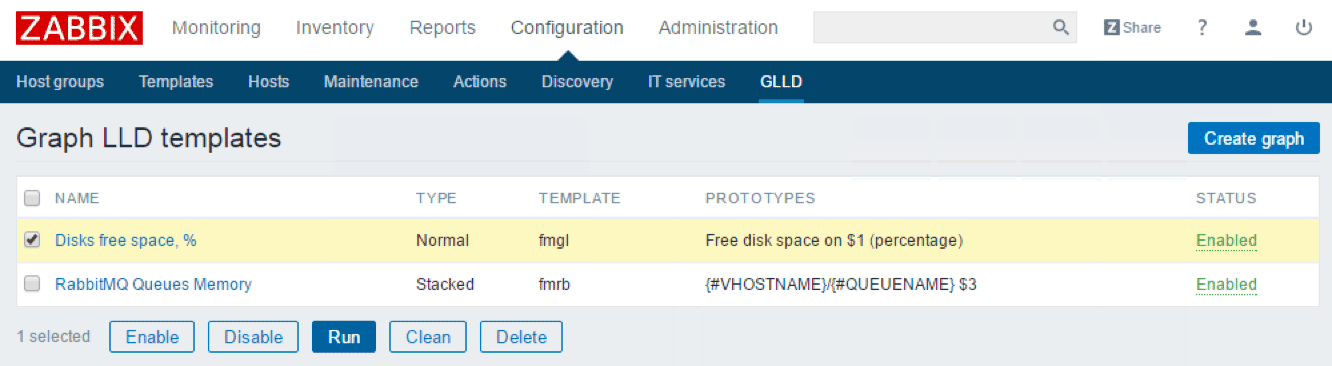
Which only allows you to conveniently edit the tasks that will already be executed by the script going to the crown. When writing this simple form, I had to deal with the Zabbix web interface deeper than the public API, and unfortunately it did not bring much joy. (Not fun at all) But it is clear why the answer of the developers in ZBXNEXT-927 was a link to Development services . The minimum price for current projects on this page starts from € 8,000.00
The end
That's all, it will be interesting to read your comments. I hope this selection will help someone (for example, to realize that it is time to migrate with Zabbix;)
PS
Yes, plug-ins do not exist, you need to patch the source code. But they will soon appear - ZBXNEXT-1099
Source: https://habr.com/ru/post/275737/
All Articles