Docker: Environment for testing

The last five years have brought a huge amount of technology into our lives, with the help of which you can quickly create isolated environments for development and testing. But despite this, organizing a stable environment for testing is far from an easy task. And if you need to test the network interaction of components and analyze the maximum level of load on them, then the task becomes even more difficult. Adding the ability to quickly deploy the environment and the flexible configuration of individual components, we can get a small interesting project.
In this article we will talk in detail about creating an environment based on Docker containers for testing our client-server application. At the same time, if you look globally, this article will be a good illustration of the use of Docker and its nearest ecosystem.
Formulation of the problem
Our application collects, analyzes and stores all possible types of log files. The main task of the environment is to conduct initial testing of the service under load.
So, what we have:
- Our service, written in Go and has a client-server architecture.
- The service is able to simultaneously write data to the storage of various types. This point is very important when building the environment for testing.
- Developers need the ability to quickly and painlessly reproduce the faults found on the test environment.
- We need to test the networking of components in a distributed environment on multiple network nodes. To do this, you need to analyze the traffic flow between clients and servers.
- We need to monitor resource consumption and ensure that the daemon is stable under high loads.
- And, of course, we want to look at all possible metrics in real time and on the results of testing.
As a result, we decided to build an environment for testing on the basis of Docker and related technologies. This allowed us to realize all our requests and efficiently use the available hardware resources without having to buy a separate server for each individual component. In this case, the hardware resources can be a separate server, a set of servers, or even a developer’s laptop.
Environment Architecture for Testing
First, consider the main components of the architecture:
- An arbitrary number of server instances of our application.
- An arbitrary number of agents.
- Separate data storage environments such as ElasticSearch, MySQL or PostgreSQL.
- Load generator (we implemented a simple stress generator, but you can use any other, for example, Yandex.Tank or Apache Benchmark).
The environment for testing should be easy to lift and maintain.
')
We built a distributed network environment using Docker containers, isolating our and external services, and the docker-machine, which allows you to organize an isolated space for testing. As a result, the architecture of the test environment looks like this:
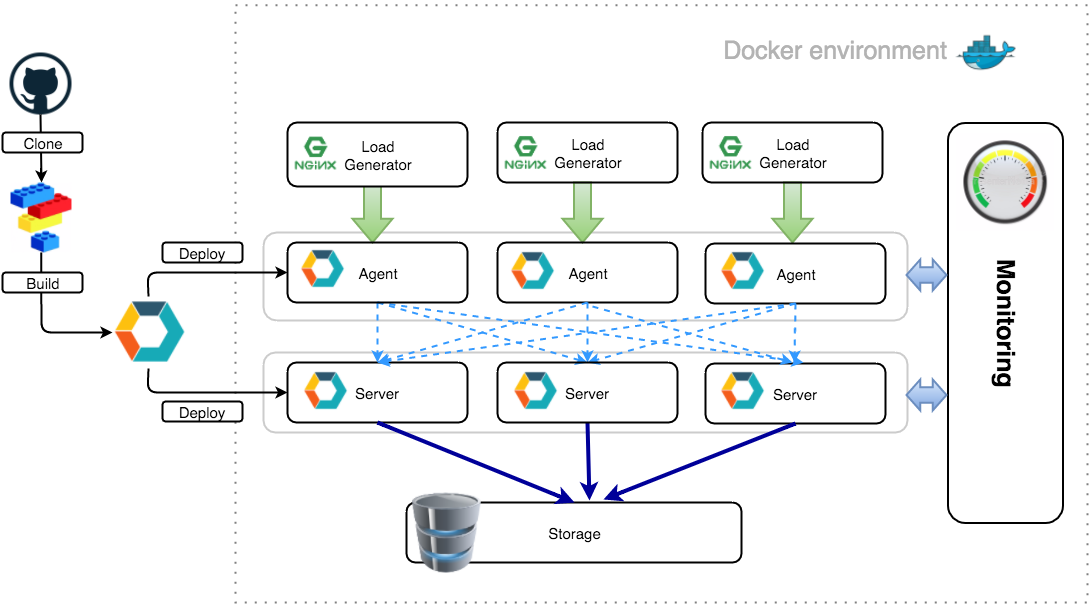
To visualize the environment, we use Weave Scope, as it is a very convenient and intuitive service for monitoring Docker containers.

With this approach, it is convenient to test the interaction of SOA components, for example, small client-server applications like ours.
Implementing the base environment
Further, we will take a closer look at each step of creating a test environment based on Docker containers, using docker-compose and docker-machine.
Let's start with the docker-machine, which allows us to painlessly isolate the test virtual environment. In this case, it will be very convenient for us to work with this environment directly from the host system.
So, create a test machine:
$ docker-machine create -d virtualbox testenv Creating VirtualBox VM... Creating SSH key... Starting VirtualBox VM... Starting VM... To see how to connect Docker to this machine, run: docker-machine env testenv This command creates a VirtualBox VM with CoreOS and Docker installed inside it (ready for work) (If you are using Windows or MacOS, it is recommended to install the Docker Toolbox, which already contains everything. And if you are using Linux, you need to install docker, docker-machine , docker-compose and VirtualBox independently). We recommend that you familiarize yourself with all the features of the docker-machine, it is quite a powerful tool for managing environments.
As you can see from the output of this command, the docker-machine creates everything necessary for working with the virtual machine. Once created, the virtual machine is up and running. Let's check:
$ docker-machine ls NAME ACTIVE DRIVER STATE URL SWARM testenv virtualbox Running tcp://192.168.99.101:2376 Great, the virtual machine is running. It is necessary to activate access to it in our current session. Let's return to the previous step and carefully look at the last line:
To see how to connect Docker to this machine, run: docker-machine env testenv This is an autosetup for our session. Having executed this command we will see the following:
$ docker-machine env testenv export DOCKER_TLS_VERIFY="1" export DOCKER_HOST="tcp://192.168.99.101:2376" export DOCKER_CERT_PATH="/Users/logpacker/.docker/machine/machines/testenv" export DOCKER_MACHINE_NAME="testenv" # Run this command to configure your shell: # eval "$(docker-machine env testenv)" This is just a set of environment variables that will tell your local docker client where to look for the server. The last line is a hint. Run this command and look at the output of the
ls : $ eval "$(docker-machine env testenv)" $ docker-machine ls NAME ACTIVE DRIVER STATE URL SWARM testenv * virtualbox Running tcp://192.168.99.101:2376 In the
ACTIVE column, our active machine is marked with an asterisk. Please note that the machine is active within the current session only. We can open another terminal window and activate another machine there. This can be useful for testing, for example, orchestration with Swarm. But this is a topic for a separate article :).Next, check our docker server:
$ docker info docker version Client: Version: 1.8.0 API version: 1.20 Go version: go1.4.2 Git commit: 0d03096 Built: Tue Aug 11 17:17:40 UTC 2015 OS/Arch: darwin/amd64 Server: Version: 1.9.1 API version: 1.21 Go version: go1.4.3 Git commit: a34a1d5 Built: Fri Nov 20 17:56:04 UTC 2015 OS/Arch: linux/amd64 Focusing on OS / Arch, there will always be linux / amd64, since the docker server is running in a VM, you need to remember that. Let's digress and look inside the VM:
$ docker-machine ssh testenv ## . ## ## ## == ## ## ## ## ## === /"""""""""""""""""\___/ === ~~~ {~~ ~~~~ ~~~ ~~~~ ~~~ ~ / ===- ~~~ \______ o __/ \ \ __/ \____\_______/ _ _ ____ _ _ | |__ ___ ___ | |_|___ \ __| | ___ ___| | _____ _ __ | '_ \ / _ \ / _ \| __| __) / _` |/ _ \ / __| |/ / _ \ '__| | |_) | (_) | (_) | |_ / __/ (_| | (_) | (__| < __/ | |_.__/ \___/ \___/ \__|_____\__,_|\___/ \___|_|\_\___|_| Boot2Docker version 1.9.1, build master : cef800b - Fri Nov 20 19:33:59 UTC 2015 Docker version 1.9.1, build a34a1d5 docker@testenv:~$ Yes, this is boot2docker, but this is not interesting. Let's look at the mounted sections:
docker@testenv:~$ mount tmpfs on / type tmpfs (rw,relatime,size=918088k) proc on /proc type proc (rw,relatime) sysfs on /sys type sysfs (rw,relatime) devpts on /dev/pts type devpts (rw,relatime,mode=600,ptmxmode=000) tmpfs on /dev/shm type tmpfs (rw,relatime) fusectl on /sys/fs/fuse/connections type fusectl (rw,relatime) /dev/sda1 on /mnt/sda1 type ext4 (rw,relatime,data=ordered) [... cgroup skipped ...] none on /Users type vboxsf (rw,nodev,relatime) /dev/sda1 on /mnt/sda1/var/lib/docker/aufs type ext4 (rw,relatime,data=ordered) docker@testenv:~$ ls /Users/ Shared/ logpacker/ docker@testenv:~$ In this case, we use MacOS and, accordingly, the / Users directory (analogue of / home in linux) is mounted inside the machine. This allows us to work transparently with files on the host system within the docker framework, that is, to quietly connect and disconnect volumes without worrying about the VM layer. It is really very convenient. In theory, we can forget about this VM, it is needed only for the docker to work in the “native” environment. At the same time, the use of the docker client will be absolutely transparent.
So, the base environment is built, then we will run Docker containers.
Configure and launch containers
Our application can work on a cluster basis, that is, it provides fault tolerance of the entire system in case of a change in the number of nodes. Due to the internal interservice API, adding or deleting a new node to the cluster is painless and does not require overloading other nodes, and we also need to take this distinctive feature of our application into account when building the environment.
In principle, everything fits well with the Docker ideology: “one process - one container”. Therefore, we will not depart from the canons and will do the same. At the start, run the following configuration:
- Three containers with the server side of the application.
- Three containers with the client part of the application.
- Generator load for each agent. For example, Ngnix, which will generate logs, and we will stimulate it with Yandex.Tank or Apache Benchmark.
- And in another container, we move away from ideology. Our service can work in the so-called “dual mode”, i.e. the client and server are on the same host; moreover, it is just one instance of the application, working immediately both as a client and as a server. We will launch it in a container under the control of a supervisord, and our own small load generator will be launched in the same container as the main process.
So, we have a compiled binary of our application - this is one file, yes, thanks Golang :), with which we will assemble a universal container for launching the service, within the test environment. The difference will be in the transferred keys (we start the server or the agent), we will manage them when the container is started. Small nuances are in the last paragraph, when starting the service in “dual mode”, but more on that later.
So, prepare
docker-compose.yml . This is a file with directives for docker-compose, which will allow us to raise the test environment with one command:docker-compose.yml
# external services elastic: image: elasticsearch ngx_1: image: nginx volumes: - /var/log/nginx ngx_2: image: nginx volumes: - /var/log/nginx ngx_3: image: nginx volumes: - /var/log/nginx # lp servers lp_server_1: image: logpacker_service command: bash -c "cd /opt/logpacker && ./logpacker -s -v -devmode -p=0.0.0.0:9995" links: - elastic expose: - "9995" - "9998" - "9999" lp_server_2: image: logpacker_service command: bash -c "cd /opt/logpacker && ./logpacker -s -v -devmode -p=0.0.0.0:9995" links: - elastic - lp_server_1 expose: - "9995" - "9998" - "9999" lp_server_3: image: logpacker_service command: bash -c "cd /opt/logpacker && ./logpacker -s -v -devmode -p=0.0.0.0:9995" links: - elastic - lp_server_1 - lp_server_2 expose: - "9995" - "9998" - "9999" # lp agents lp_agent_1: image: logpacker_service command: bash -c "cd /opt/logpacker && ./logpacker -a -v -devmode -p=0.0.0.0:9995" volumes_from: - ngx_1 links: - lp_server_1 lp_agent_2: image: logpacker_service command: bash -c "cd /opt/logpacker && ./logpacker -a -v -devmode -p=0.0.0.0:9995" volumes_from: - ngx_2 links: - lp_server_1 lp_agent_3: image: logpacker_service command: bash -c "cd /opt/logpacker && ./logpacker -a -v -devmode -p=0.0.0.0:9995" volumes_from: - ngx_3 links: - lp_server_1 Everything is standard in this file. We first run elasticsearch as the main storage, then three copies with nginx that will act as load providers. Next, run our server applications. Note that all subsequent containers are linked with previous ones. As part of our docker network, this will allow us to access containers by name. Below, when we analyze the launch of our service in “dual mode”, we will come back to this point and consider it in a little more detail. Also, with the first container in which the instance of the server application is located, agents are linked. This means that all three agents will send logs to this particular server.
Our application is designed in such a way that in order to add a new node to the cluster, it is enough for an agent or a server to inform about one existing cluster node and it will receive complete information about the entire system. In the configuration files for each server instance, we specify our first node and the agents will automatically receive all the information about the current state of the system. After some time after the launch of all system nodes, we simply turn off this instance. In our case, the cluster transfers it painlessly, all information about the system is already distributed among all participants.
And one more thing: pay attention to the logic of mount volumes. On containers with nginx, we specify a named volume, which will be available in the docker network, and on containers with agents, we simply connect it by specifying the name of the service. Thus, we will have a shared volume between consumers and suppliers of the load.
So, we start our environment:
$ docker-compose up -d We check that everything started up normally:
$ docker-compose ps Name Command State Ports -------------------------------------------------------------------------------------------- assets_lp_agent_1_1 bash -c cd /opt/logpacker ... Up assets_lp_agent_2_1 bash -c cd /opt/logpacker ... Up assets_lp_agent_3_1 bash -c cd /opt/logpacker ... Up assets_lp_server_1_1 bash -c cd /opt/logpacker ... Up 9995/tcp, 9998/tcp, 9999/tcp assets_lp_server_2_1 bash -c cd /opt/logpacker ... Up 9995/tcp, 9998/tcp, 9999/tcp assets_lp_server_3_1 bash -c cd /opt/logpacker ... Up 9995/tcp, 9998/tcp, 9999/tcp assets_ngx_1_1 nginx -g daemon off; Up 443/tcp, 80/tcp assets_ngx_2_1 nginx -g daemon off; Up 443/tcp, 80/tcp assets_ngx_3_1 nginx -g daemon off; Up 443/tcp, 80/tcp elastic /docker-entrypoint.sh elas ... Up 9200/tcp, 9300/tcp Ok, the environment has risen, it works and all ports are forwarded. In theory, we can start testing, but we need to finish some points.
Container naming
Let's return to the container in which we wanted to launch our application in “dual mode”. The main process in this container will be the load generator (the simplest shell script). It generates text strings and puts them into text “log” files, which, in turn, will be a load for our application. First you need to collect the container with our application running under
supervisord . Take the latest version of supervisord , since we need the ability to transfer environment variables to the configuration file. supervisord version 3.2.0 is suitable for us, but in Ubuntu 14.04 LTS, which we took as the base image, the supervisord version is quite old (3.0b2). Install the latest version of supervisord via pip . The final Dockerfile is:Dockerfile
FROM ubuntu:14.04 # Setup locale environment variables RUN locale-gen en_US.UTF-8 ENV LANG en_US.UTF-8 ENV LANGUAGE en_US:en ENV LC_ALL en_US.UTF-8 # Ignore interactive ENV DEBIAN_FRONTEND=noninteractive RUN apt-get update && \ apt-get install -y wget unzip curl python-pip # Install supervisor via pip for latest version RUN pip install supervisor RUN mkdir -p /opt/logpacker ADD final/logpacker /opt/logpacker/logpacker ADD supervisord-logpacker-server.ini /etc/supervisor/conf.d/logpacker.conf ADD supervisor.conf /etc/supervisor/supervisor.conf # Load generator ADD random.sh /opt/random.sh # Start script ADD lp_service_start.sh /opt/lp_service_start.sh The load generator is extremely simple:
#!/bin/bash # generate random lines OUTPUT_FILE="test.log" while true do _RND_LENGTH=`awk -v min=1 -v max=100 'BEGIN{srand(); print int(min+rand()*(max-min+1))}'` _RND=$(( ( RANDOM % 100 ) + 1 )) _A="[$RANDOM-$_RND] $(dd if=/dev/urandom bs=$_RND_LENGTH count=1 2>/dev/null | base64 | tr = d)"; echo $_A; echo $_A >> /tmp/logpacker/lptest.$_RND.$OUTPUT_FILE; done The startup script is also not complicated:
#!/bin/bash # run daemon supervisord -c /etc/supervisor/supervisor.conf # launch randomizer /opt/random.sh The whole trick will be in the
supervisord configuration file and launching the Docker container.Consider the configuration file:
[program:logpacker_daemon] command=/opt/logpacker/logpacker %(ENV_LOGPACKER_OPTS)s directory=/opt/logpacker/ autostart=true autorestart=true startretries=10 stderr_logfile=/var/log/logpacker.stderr.log stdout_logfile=/var/log/logpacker.stdout.log Note the
%(ENV_LOGPACKER_OPTS)s . Supervisord can perform substitutions in the configuration file from environment variables. The variable is written as %(ENV_VAR_NAME)s and its value is inserted into the configuration file when the daemon starts.We start the container by running the following command:
$ docker run -it -d --name=dualmode --link=elastic -e 'LOGPACKER_OPTS=-s -a -v -devmode' logpacker_dualmode /opt/random.sh With the help of the
-e switch, it is possible to set the necessary environment variable, while it will be set globally inside the container. And that is what we substitute into the configuration file supervisord . Thus, we can manage startup keys for our daemon and run it in the mode we need.We got a universal image, although a bit inconsistent with the ideology. Let's look inside:
Environment
$ docker exec -it dualmode bash $ env HOSTNAME=6b2a2ae3ed83 ELASTIC_NAME=/suspicious_dubinsky/elastic TERM=xterm ELASTIC_ENV_CA_CERTIFICATES_JAVA_VERSION=20140324 LOGPACKER_OPTS=-s -a -v -devmode ELASTIC_ENV_JAVA_HOME=/usr/lib/jvm/java-8-openjdk-amd64/jre ELASTIC_ENV_JAVA_VERSION=8u66 ELASTIC_ENV_ELASTICSEARCH_REPO_BASE=http://packages.elasticsearch.org/elasticsearch/1.7/debian ELASTIC_PORT_9200_TCP=tcp://172.17.0.2:9200 ELASTIC_ENV_ELASTICSEARCH_VERSION=1.7.4 PATH=/usr/local/sbin:/usr/local/bin:/usr/sbin:/usr/bin:/sbin:/bin ELASTIC_PORT_9300_TCP_ADDR=172.17.0.2 ELASTIC_ENV_ELASTICSEARCH_MAJOR=1.7 ELASTIC_PORT_9300_TCP=tcp://172.17.0.2:9300 PWD=/ ELASTIC_PORT_9200_TCP_ADDR=172.17.0.2 ELASTIC_PORT_9200_TCP_PROTO=tcp ELASTIC_PORT_9300_TCP_PORT=9300 SHLVL=1 HOME=/root ELASTIC_ENV_JAVA_DEBIAN_VERSION=8u66-b17-1~bpo8+1 ELASTIC_PORT_9300_TCP_PROTO=tcp ELASTIC_PORT=tcp://172.17.0.2:9200 LESSOPEN=| /usr/bin/lesspipe %s ELASTIC_ENV_LANG=C.UTF-8 LESSCLOSE=/usr/bin/lesspipe %s %s ELASTIC_PORT_9200_TCP_PORT=9200 _=/usr/bin/env In addition to our variable, which we explicitly specified when starting the container, we also see all the variables related to the linked container, namely: IP address, all open ports and all variables that were explicitly set when building the elasticsearch image using the ENV directive . All variables have a prefix with the name of the export container and a name indicating their essence. For example,
ELASTIC_PORT_9300_TCP_ADDR indicates that a variable stores a value indicating the container named elastic and its ip address where port 9300 is open. If it’s not reasonable to raise a separate discovery service for the tasks assigned, then this is a great way to get an IP address and data from linked containers. At the same time, it remains possible to use them in their applications that are running in Docker containers.Container management and monitoring system
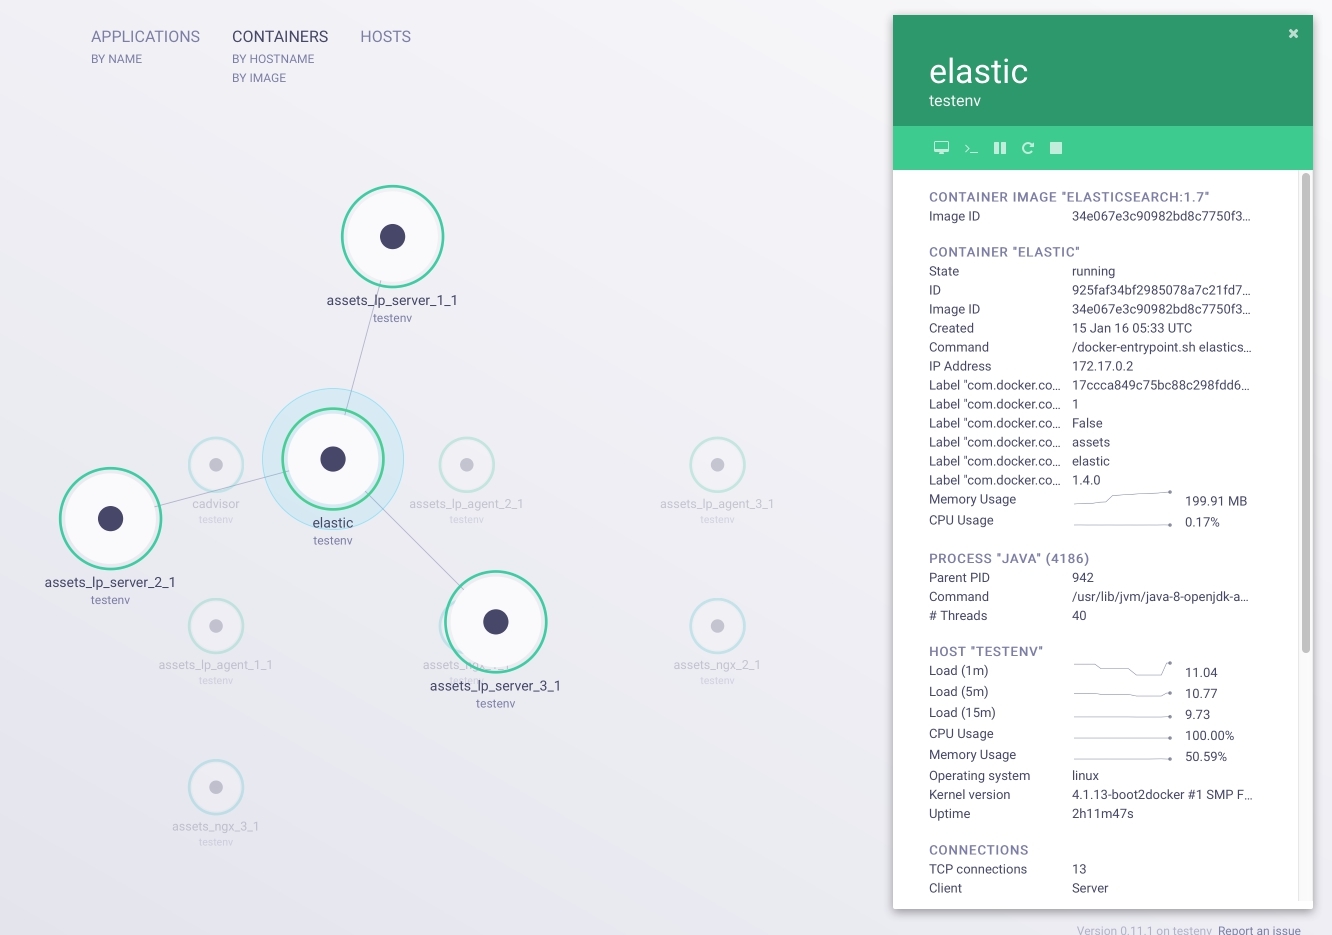
So, we have built an environment for testing that meets all of our initial requests. Left a couple of nuances. First, install the Weave Scope (screenshots of which were at the beginning of the article). With Weave Scope, you can visualize the environment in which we operate. In addition to displaying links and information about containers, we can
attach to any container or run a full-fledged terminal with sh right in the browser. These are irreplaceable functions when debugging and testing. So, from the host machine, perform the following actions as part of our active session: $ wget -O scope https://github.com/weaveworks/scope/releases/download/latest_release/scope $ chmod +x scope $ scope launch After executing these commands, go to VM_IP : 4040, we get to the container management interface shown in the picture below:
Great, almost everything is ready. For complete happiness, we lack a monitoring system. Let's use cAdvisor from Google:
$ docker run --volume=/:/rootfs:ro --volume=/var/run:/var/run:rw --volume=/sys:/sys:ro --volume=/var/lib/docker/:/var/lib/docker:ro --publish=8080:8080 --detach=true --name=cadvisor google/cadvisor:latest Now at VM_IP : 8080 we have a real-time resource monitoring system. We can track and analyze the main metrics of our environment, such as:
- use of system resources;
- network load;
- process list;
- other useful information.
The screenshot below shows the cAdvisor interface:

Conclusion
Using Docker containers, we built a complete test environment with the functions of automatic deployment and network interaction of all nodes, and most importantly, with flexible configuration of each component and the system as a whole. Implemented all the basic requirements, namely:
- Full network emulation for testing network interaction.
- Adding and deleting nodes with an application is done through changes to docker-compose.yml and is applied by one command.
- All nodes can fully receive information about the network environment.
- Adding and removing data stores is performed by one command.
- Management and monitoring of the system are available through the browser. This is implemented with tools running separately in containers near our application, which allows them to be isolated from the host system.
Links to all the tools mentioned in the article:
Source: https://habr.com/ru/post/275513/
All Articles