Interface design under Microsoft Lync or system visualization from scratch
I want to share with you my experience of developing from scratch the system of internal management of chat and audio / video records. It was more than a year ago. Looking ahead, I want to say with chagrin that the project is now frozen. Whether the crisis, the loss of faith in the project leadership, or any other reason - I do not know. Although the team was pleasant, solving problems was interesting and fascinating. In general, I like setting tasks in the spirit of: “We have such a data set, but we don’t know how it should look. Here, take a pencil and picture us something. ” And cooperation with them ideally fell under this format.
By the way, if you use Figma , I recommend paying attention to our ready-made design systems . They help freelancers complete more orders per month, programmers can create beautiful applications on their own, and the Timlids run sprints faster using ready-made design systems for teamwork.
And if you have a serious project, our team is ready to deploy a design system within the organization based on our developments and tailor it to specific tasks using Figma. Web / desktop, and any mobile. We are also familiar with React / React Native. Write to T: @kamushken
')
Once, in the spring afternoon, the bell rang. The girl asked, “I would not like to freelance under a contract to work as an interface developer for their system. Remotely. With occasional office visits. ” Considering my schedule for the main work, the availability of free time and especially considering the location of their office 20 minutes by bike from the house - I epilepsically nodded my head in the tube.
Further standard steps. Acquaintance, interview and other procedures. So, we plan a boxed version of the system for managing chat, audio and video conferences within the organization. There is a huge set of recorded fragments and it is necessary to somehow visualize this picture of what is happening. As the target audience were considered system administrators, security guards, management departments. Administrators - administer. Safes - want to listen to all the records of Petrov, because he is under suspicion. Management - wants to keep abreast (in other words, to see everything and everyone)). It was then, at the first meeting, that my favorite proposal was sounded - to take a pencil and instantly depict something, if of course I had something in my head. I have no problems with visualization and I already clearly imagined that I was ready to offer after the 5th minute of our conversation. Having grabbed a marker, without any hesitation, I ideally superimposed the concept of an enterprise automation system, the development of which I was working on in parallel:
Looking at how the management expands the eyes from pleasant surprise, I understood that “flopped the nuts”)) (Nats) is a colloquial, slang expression among poker players, denoting the strongest hand in this hand and the player’s confidence in the dominant to the strength of this hand - ed.) “Wow, we didn’t think that such an approach was possible at all.” Bingo! When I finally learned that the management likes the guidelines of the metro interface, I already knew how to act if I go around the other applicants for this position. Having spent several hours on the test task, I continued to pack the luggage. Indeed, in a few days I was waiting for a vacation in the form of thousands and thousands of kilometers of unknown countries on a motorcycle. Already later, having gone round the next mountain serpentine of Italy with a length of 150 km and having spent the whole daylight on it, lying in a tent almost without strength, I will receive the most cherished e-mail that they are ready to cooperate with me.
Leave time, and work - an hour. Joke. Returning and realizing that avraly raking in a couple of days, I set to work. Problem of the aforementioned case “We have such a data set, but we don’t know how it should look. Here, take a pencil and picture us something, ”mainly consists of the inferiority of the painting at the entrance. This is fascinating, this is bad. On the one hand, the developer shows a broad outlook and flexibility when he “inserts” new wishes into the concept being developed, on the other hand, he spends additional time on editing from the “appetite” series comes at a meal time ”from the management. We didn’t speak about any elaboration of typical scenarios, final goals and other visio-schemes. Several scenarios were declared on the fingers of a cursory monologue: “security officers will want it like this, management - like this, and the rest of the user with read-only right - like this”. And the work began to boil ...
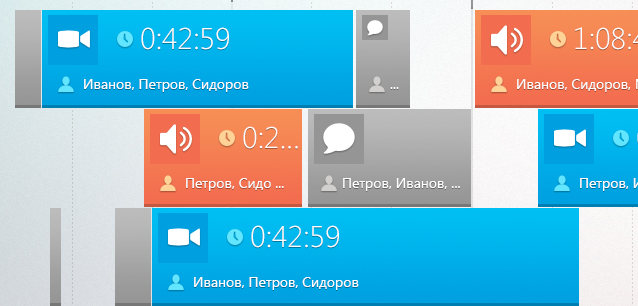
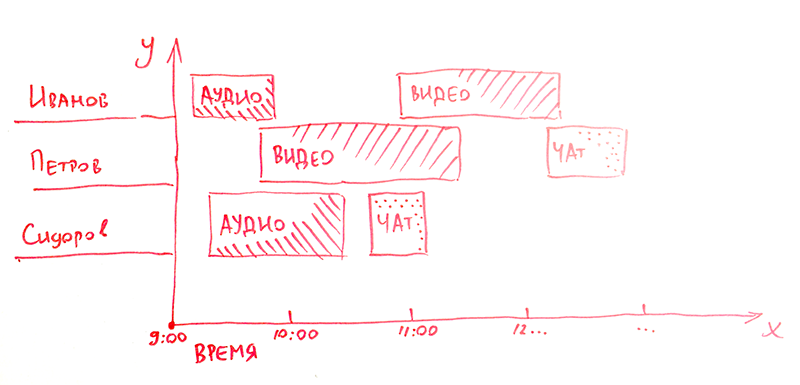
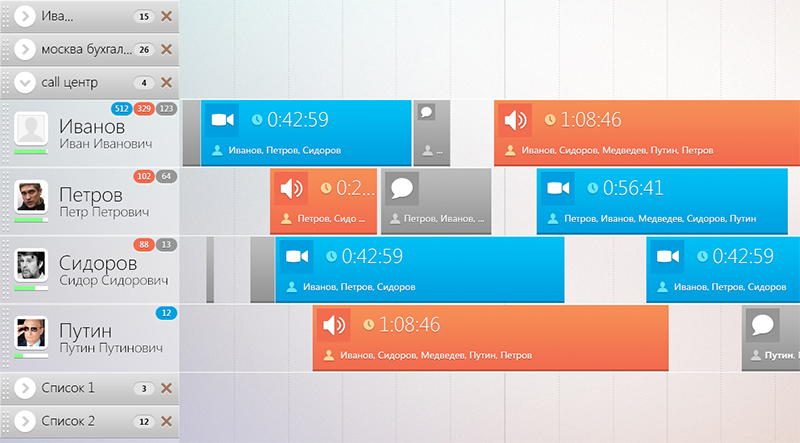
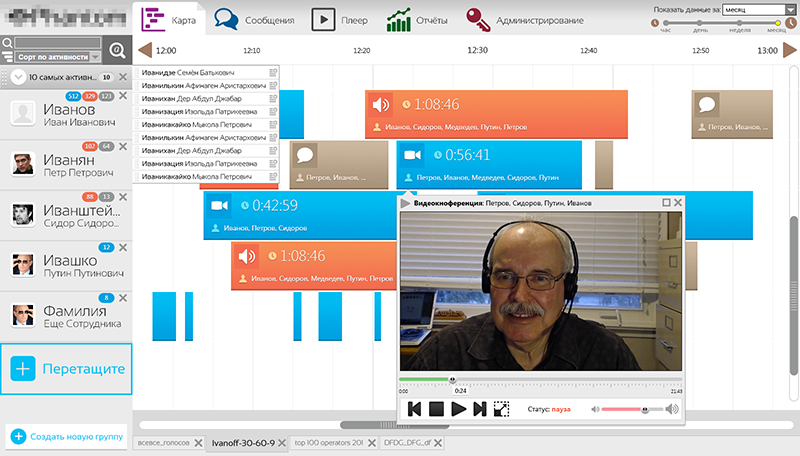
As in the diagram above, the first picture assumed the display of users on the Y axis, and the display of the timeline on the X axis. Each recorded chat, dialogue or video conference was offered in the form of a block whose width was projected onto the time axis (hereinafter I will show only fragments layouts):
Each of their 3 data types had a different color. Having logged in, the user could immediately feel the “pulse of the enterprise”: what color prevails, the length of the blocks and, accordingly, the duration of the records, the activity of a particular user. “Why does Ivanov have a solid data gap for today?” The head of the department could ask himself and begin the check.
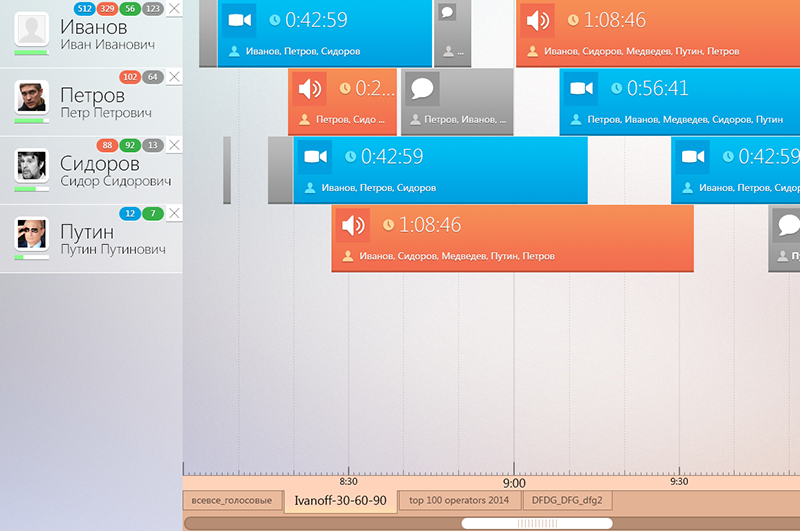
The implication was that, perhaps, each displayed in the list will have a certain rating (green bar under the avatar). Clicking on the cross could be “thrown out” of any of the list, you can return through the search. The tabs below are autosaveable filter selections. I myself offered the management options when it will be necessary to show “audio only” or, for example, “only video of a certain length”. A separate “stake” stuck out the question of how to harmoniously implement a drop-down list with filters.
Is it strongly to focus on them, making black?
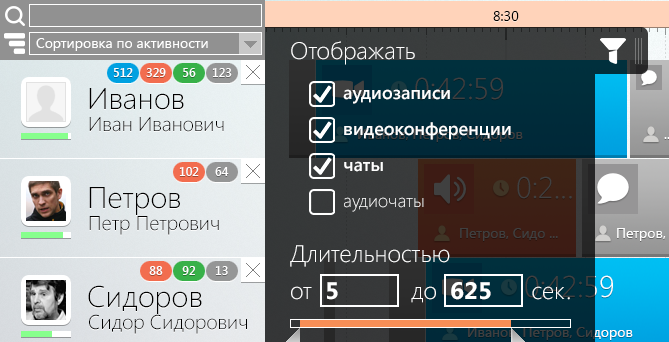
Or, keeping the balance to leave the background white?
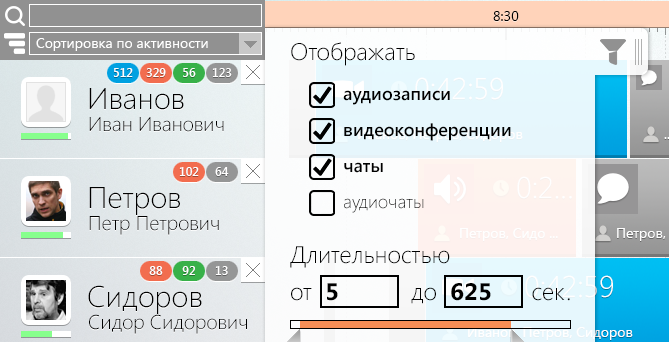
And do I leave myself in such a vertical way the potential for the development of filters if new filtering criteria appear in future versions?
In this case, it is possible for them to have a place at the bottom tabs and generally in a horizontal scan:
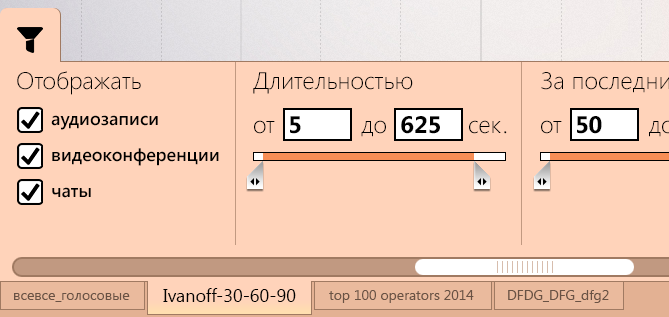
In general, the creative flight of fantasy then soared in earnest :) We decided to stay on the last horizontal version.
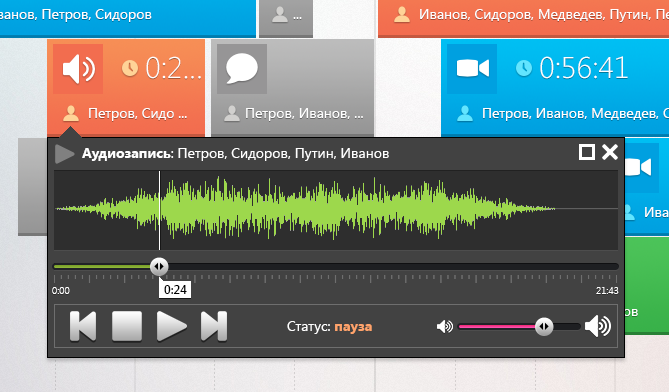
Moving on. In addition, I put forward the idea of reproducing any of the block elements. Compromise decided to make a mini-player on the click, for example with audio:
Video example:
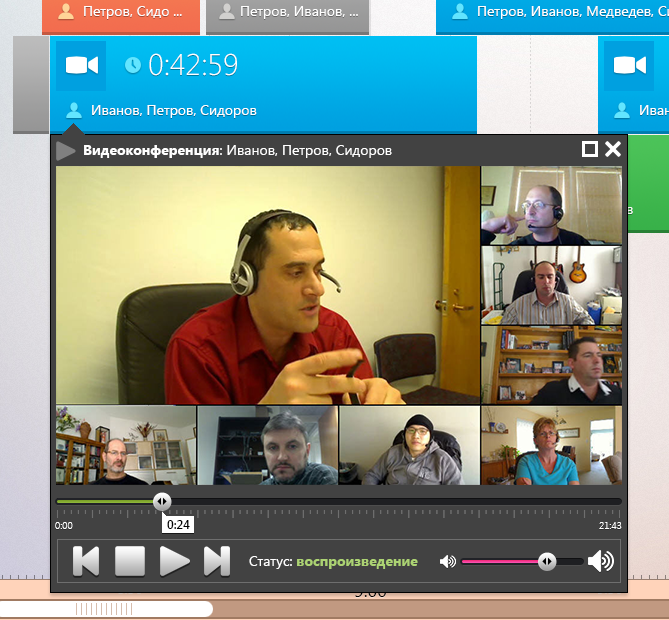
And deploy it in full screen mode to expand the functionality:
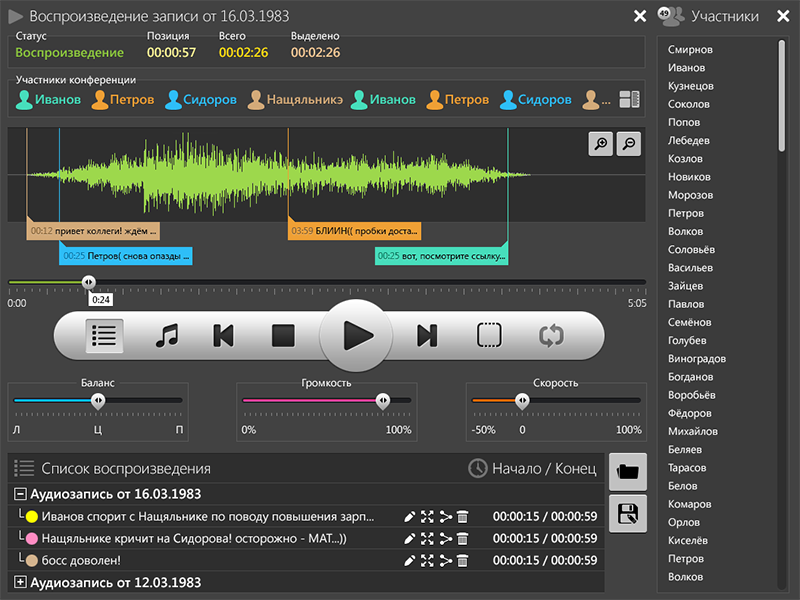
Everything is more or less standard, except for my non-standard solution, to display in the histogram also a text correspondence during an audio conference. Suddenly it turned out that such a case also exists (ha! Who would doubt). I just projected a text chat on the timeline audio. With the binding of matchbooks in color to the authors, which are listed just above the histogram. I think that the lower lists with a turn quite obviously look like freely saved fragments of audio recordings with assignment of a name to them, the ability to edit, expand, share or delete. So I will not focus on them. Or already sharpened?
So, one day, in the process of a small brainstorming, suddenly someone said: “Stop. But Petrov can have several dialogues at the same time! And how to be? ”. Having taken some timeout, I had to taste the negative sides of the approach with inadequate information at the entrance and issue “but this is how to be!”:
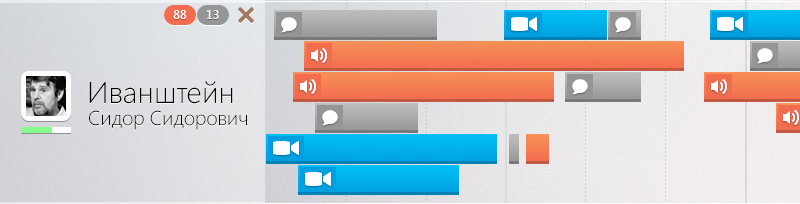
It turns out that now the “Petrov zone” is not a fixed height, but a floating one. Because if an employee led 10 chats at the same time with different people, then all of them will need to be displayed in one unit of time. This is a plus: all multitasks immediately catch the eye.
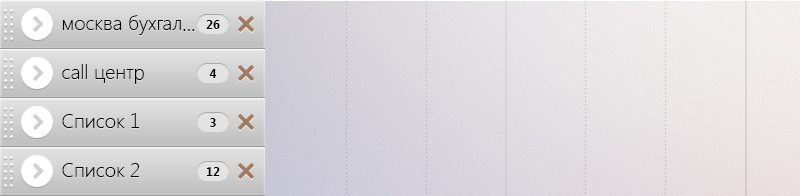
On one of the days during the meeting it became necessary to group users. Someone will have the right of access to the creation of collections. For read-only users, they can be pre-installed by admins. Accordions introduced:
I suggested filling by drag'n'drop, in case you want to “scatter” different users into different groups:
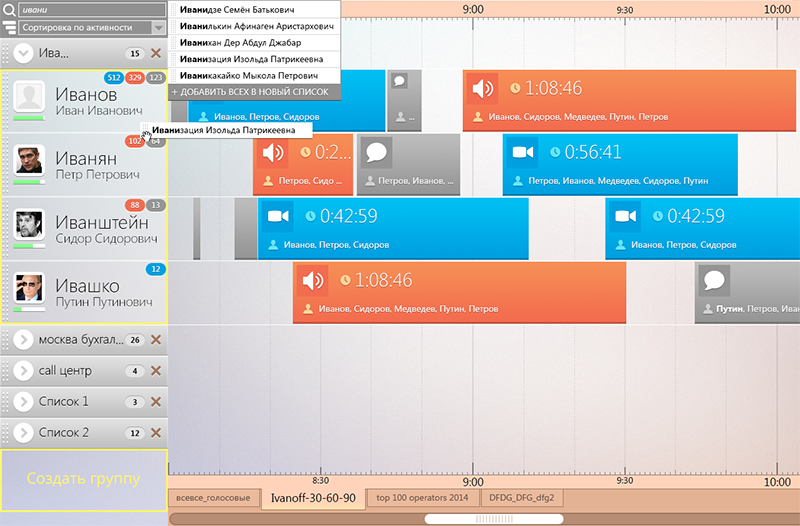
Well, you understand that there is no smoke without fire? Immediately the problem of empty space to the right of the collapsed group surfaced. And this problem was especially acute in case there are many groups:
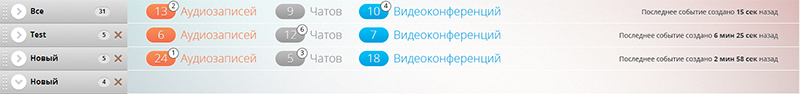
And here, too, I managed to get out of the situation! Why not show a short summarie about what is happening inside each collapsed collection? You can show notifications about new events inside. The right to write how long it happened. Conveniently, as part of a giant company, where records can be created every minute:
Functional overgrown with each week. Even despite the fact that the leaders in every way tried to abstract from most of them, putting them off for the second version. In the end, maybe this played a role in freezing the project. In any case, we parted on a positive note.
I will not embed here numerous layouts of various time scales: months, years, etc. Although I still like my idea with a grid and event counting within a larger time unit:

I will not repeat the diagrams and graphs in the “reports” section, which were both general and specific for each user. I will not torture you with sections of messages with a search, with an administration section with a bunch of subsections. Let me just say that the colors in the final improved a little:
I decided to raise these concepts also in order to carry out “work on the bugs”. You know, I think that if you open your old work and cannot remember how the button of a year ago works, then you had to grow. And if you open the same project and immediately see what you would have done differently and better now, then the past year was not wasted in terms of development in your profession.
Grow, friends!
Source: https://habr.com/ru/post/275493/
All Articles