Cloud Experience: How We Translated the KPI Suite to the Azure Platform
We are happy to share with you another article from a series of articles from our partners, independent software developers. This time, Mger Parunakyan, the head of KPI Lab, tells his story of the success of the transfer of the solution to cloud rails. All success stories can be found at #isvcloudstory - Vladimir YunevThe KPI Suite platform began to gain popularity due to its versatility, ease of use, and the popular C # programming language. On the platform, you can create various assessment systems, using various methods, to realize the possibilities of formatted data collection manually, expert assessments.

It was created by a group of specialists who have had experience in implementing assessment systems for more than 15 years. Initially, they used analogues of foreign manufacturers, but then it was decided to develop a new own platform. The reason was the fact that many manufacturers offered rigidly configured systems, the expansion of which attracted the manufacturer’s resources, which increased the cost of owning the system, as well as the impossibility of creating their own solutions.
Surveys began in 2010. The basis was taken
- DBMS: MS SQL Server
- OS: Windows
- Client Application: Silverlight
- Language: C # + additional proprietary API
- Web server: IIS
- .NET Framework
MS SQL was chosen for reasons of unpretentiousness in administration, affordability and prevalence. Development versions are also available that can be used during development.
')
Silverlight at the time of the start was more convenient than HTML5. And it was decided to start on Silverlight and further make the migration to a stable version of HTML5.
For the OS they took the Windows platform, also because of the prevalence.
The language was chosen so that future users are not hampered in finding specialists. The more professionals on the market, the safer it is to take software. C # turned out to be a good choice from our point of view. Especially .NET
At the first stage of development, they thought of introducing strict modeling rules, but then, after talking with partners, integrators and methodologists came to the general opinion that it was necessary to give maximum opportunities to developers who would impose restrictions on their solutions.
Solutions can be created different. These include methods for evaluating the company, departments, employee performance, a balanced scorecard, formatted data collections, etc.
The system consists of 4 main elements and a pair of auxiliary
Major:
- Data structures
- Dashboards
- Integration
- Image and Document Libraries
Auxiliary:
- Task and Task Management
- Scripts
- The calendar
- Administration and support
- Metadata Library
Data structures
This is the type of element in the system, which contains our data. See fig. one
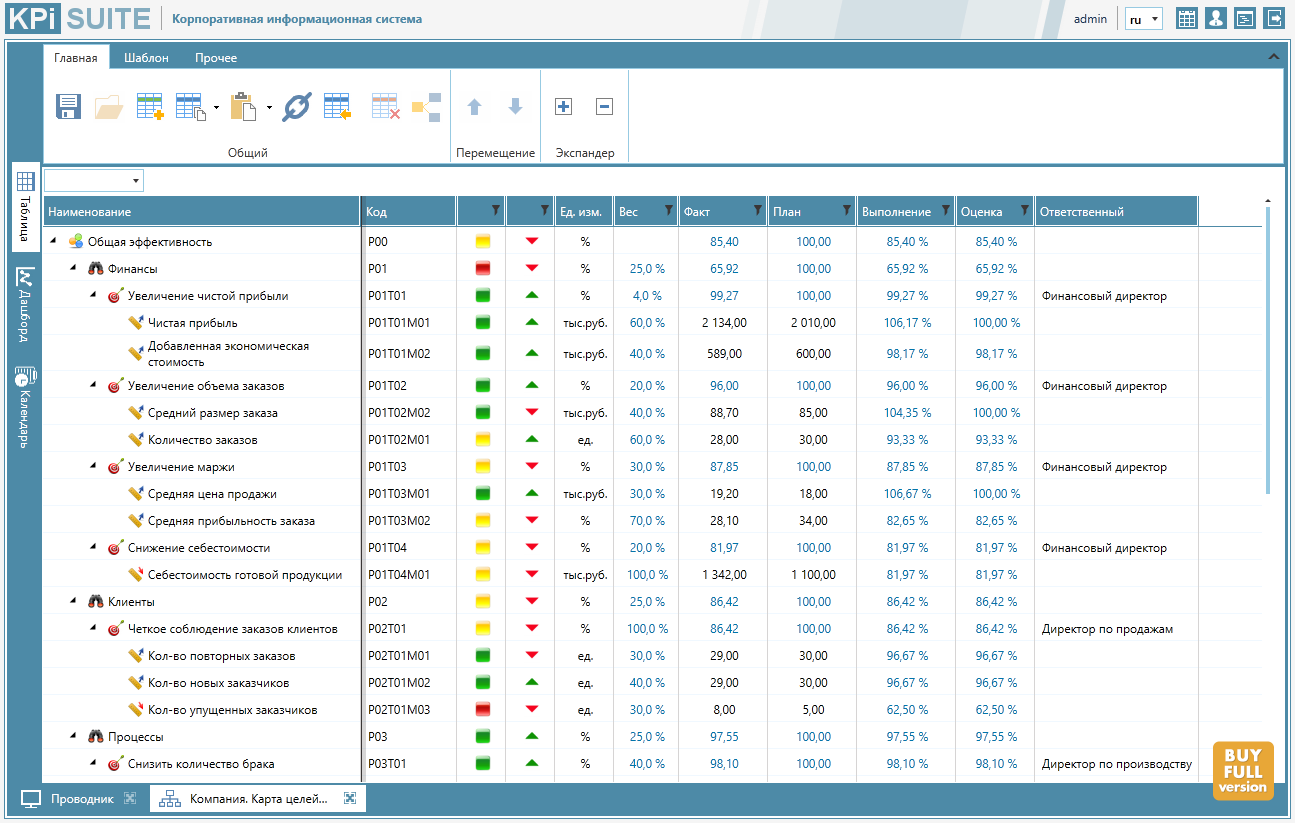
At the first stage the structure of storage of elements is created. In it you can set a strict hierarchy between the elements, you can also tie up elements from other hierarchies. Each element inside contains sets of tables. The following cell types are defined in the tables:
- Calculated
- Integrated with sources
- For manual input
You can use C # in calculated cells. Developer API is provided with the license pack. Hierarchies should also be defined, such as, for example, a calendar. It will determine the value in the cells for a certain period. An example of use is the calculation of the annual values of the indicators by summing the monthly.
Each element can also be defined:
- Properties - static parameters (list to be changed)
- Minidashboards - Appearance Used for Different Dashboards
- Affiliate tasks, events. Events from the calendar
Before saving and after saving the data, you can run scripts that, for example, will validate the entered data, and also transfer data to other tables for recalculation of related indicators.
Indicators can be both quantitative and qualitative, with and without weights. The system gives full rights to the developer to determine the data construction policy himself.
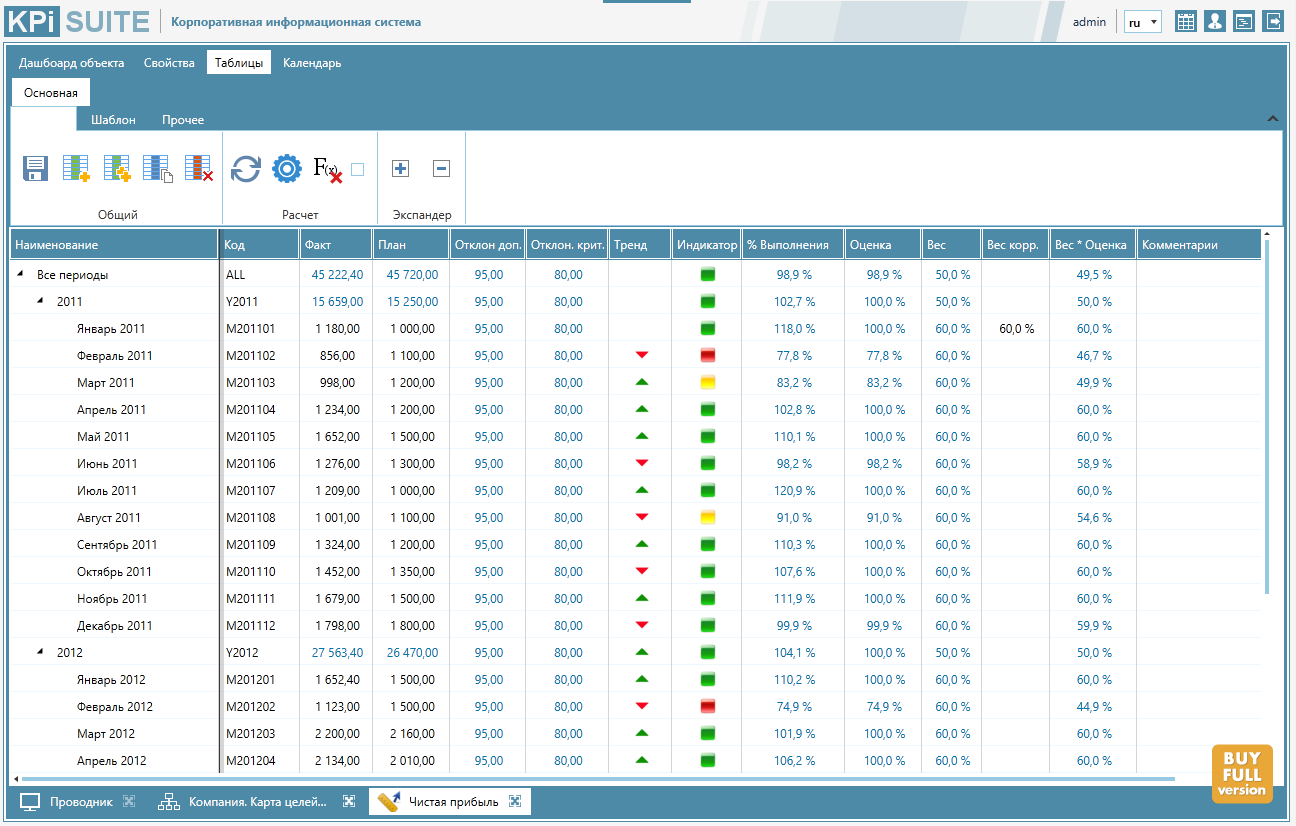
The element is used not only for data output, but also for input.
Data changes can be made in several ways:
- Directly edit from in open structure by clicking on edit. Those. You can directly in the table to change the data for a specific period of all available items.
- Entering an element will be able to change data for different periods, but only for one element.
- Through data integration, getting externally
- Manual entry, customizable in dashboards
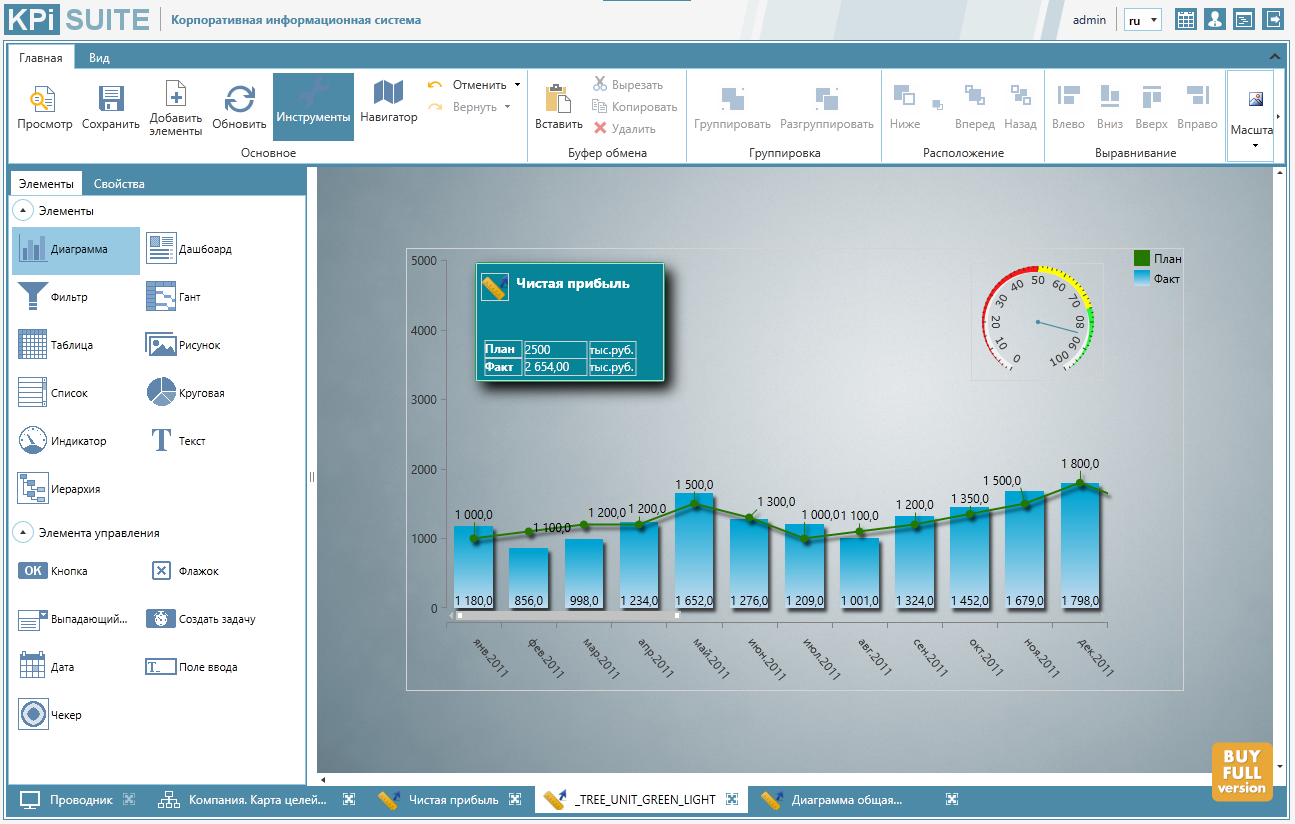
Dashboards data
Dashboards are indicator panels on which graphical representations are placed. They can be created for methods, for example, heat maps for a risk model, bonus cards, for personnel evaluation, evaluation 360, strategic maps of a balanced scorecard, etc. An example of a strategic map is shown in Fig.

They are:
- for items
- for data structures
- separate
The elements are created to simplify further work. Those. we create once and use it on different dashboards. In data structures, in order to have by default not only tables, but also graphical representations, and separate ones - to gain access from the outside.
As it was written earlier, the palette of elements is diverse, starting from diagrams, ending with data entry fields, filters.
Each graphic element has its own properties, such as width and height, which can be set statically, or through data from the database. Thus, you can control the visibility, colors, sizes, coordinates of all elements on the dashboard.
You can also move between dashboards and export them to different file formats.
Data libraries
There are 2 types of libraries.
- documents - necessary for storing documents in the system, attaching documents to the indicators for the period (for example, signed orders, etc.), joining events
- images - essential for aesthetics of our dashboards
Library files are now stored in a single database. Previously, we worked with Microsoft to improve resiliency, but prevented the files on the server, i.e. in the absence of the server itself, the backup server could reach the data, but the files would be inaccessible.
Data integration
One of the most important moments in any information system is data exchange. For us, this question is extremely serious, since we are just trying to ensure collection from various sources, and not to allow the duplication of data from one system to another.
A mechanism has been developed that makes it possible to join an external table, read the data, match the data from the table with our metadata, and get the data directly into our system. The task can be run on a schedule.
We use the same mechanism for fast generation of data structure elements. As an example, the following task can be - a list of the hierarchy of indicators comes. Option one - manually fill in everything in the system, option two - track on the machine whether there is data in the structure, and if not, create it.
Azure Practice
The first thing we started to check the connectivity of the availability group. Quite an interesting mechanism to ensure the health of the system. Those. start up the group. It contains several virtual machines. There is a main, the rest in the background. If the first server stops responding, the second rises and works instead of the first. The server may not respond for various reasons, such as updating the system, which is produced by Azure itself.
The second thing we noticed is that there is a possibility of scaling, i.e. if the load starts to increase, then we ask how many servers need to be raised. If the load drops, the system will shut down the server itself.
From the point of view of costs, it is much more interesting to have several small machines than one super virtual one, since the workload is high during the working day and low outside. The cost of a super virtual will be high all 24 hours, and in the case of small cars they will be disconnected and not spend money.
Development
At the workshop of Microsoft in August, dedicated to Azure, it was decided to develop a Microsoft Outlook Add-on. This is preparing a new article.
about the author
Parunakyan Mher Samvelovich
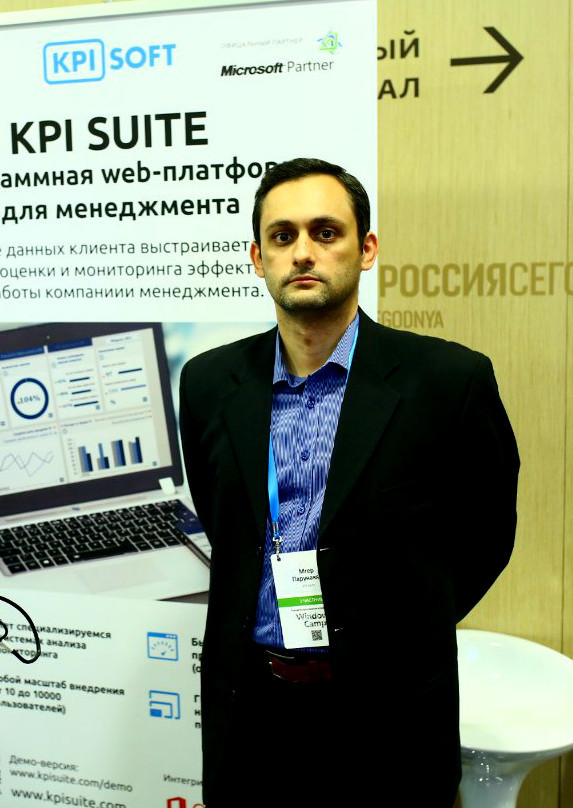
Head of KPI Lab
Experience as the head of the organization for more than 12 years, the main specialization - general management of the company, sales, project management, negotiation; the creation of new activities, the development of a partner network; project management from the first presentation to the closure of works.
- 15 years, building integrated performance assessment systems
- 14 years, software development management
- 3 years, designing b2b systems
- Over 5 years working in foreign companies in senior positions
Source: https://habr.com/ru/post/275481/
All Articles