Azure Machine Learning: Developing machine learning services and using them in a mobile application
Thank you very much for preparing the article for Evgeny Grigorenko, Microsoft Student Partner, ( @ evgri243 ) for helping to write this article. Our remaining Azure articles can be found on the azureweek tag .
Machine learning is one of the most popular areas of Computer Science, although at the same time one of the most avoided among developers. The main reason for this is that the theoretical part of machine learning requires deep mathematical preparation, which many prefer to forget immediately after graduating from university. But it is necessary to understand that in addition to the theoretical foundations, there is also a practical side, which turns out to be much simpler for mastering and daily use. The goal of this work is to bridge the gap between programmers and data processing specialists and show that using machine learning in their applications can be quite a simple task. The article describes the entire sequence of steps necessary to build a model for predicting the price of a car, depending on its characteristics set and its subsequent use in a mobile application on Windows 10 Mobile.
What is Azure ML?
In short, Azure Machine Learning is:
- cloud solution, allowing the construction and use of complex models of machine learning in a simple and visual form;
- ecosystem designed to spread and monetize ready-made algorithms.
More information about Azure ML can be found further in this article, as well as by clicking on the link
Why choose Azure ML?
Because Azure Machine Learning is one of the simplest tools to use machine learning, removing the entrance barrier for anyone who decides to use it for their needs. With Azure ML, you no longer need to be a mathematician.
')
The logical process of building a machine learning algorithm
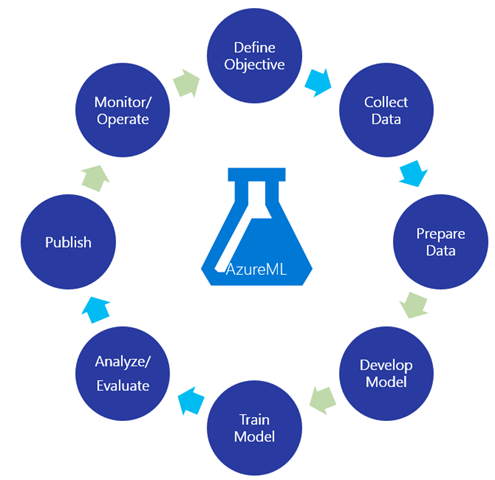
- Definition of purpose. All machine learning algorithms are useless without an explicitly defined goal of the experiment. In this lab, the goal is to predict the price of a car based on a set of characteristics provided by the end user.
- Data collection. During this stage, a sample of data is created that is necessary for further training of the model. In this case, the data from the University of California machine learning repository will be used.
archive.ics.uci.edu/ml/datasets/Automobile - Data preparation. At this stage, data is prepared by forming characteristics, removing outliers and dividing the sample into training and test.
- Model development. In the process of developing a model, one or several data models and corresponding learning algorithms will be selected, which, in the opinion of the developer, will have to give the desired result. Often this process is combined with a parallel study of the effectiveness of several models and visual analysis of data in order to find any patterns.
- Learning model. During training, the learning algorithm searches for hidden patterns in the data sample in order to find a prediction method. The search process itself is determined by the selected model and learning algorithm.
- Evaluation of the model. After the model is trained, it is necessary to investigate its predictive characteristics. Most often for this, it is run on a test sample and the resulting level of error is estimated. Depending on this and accuracy requirements, the model can be either taken as a final one or re-trained after adding new input characteristics or even changing the learning algorithm.
- Using the model. In case of successful testing of a trained model, a stage of its use begins. And this is the case when Azure ML becomes indispensable, giving all the necessary tools for publishing, monitoring and monetizing algorithms.
Building a prognostic model
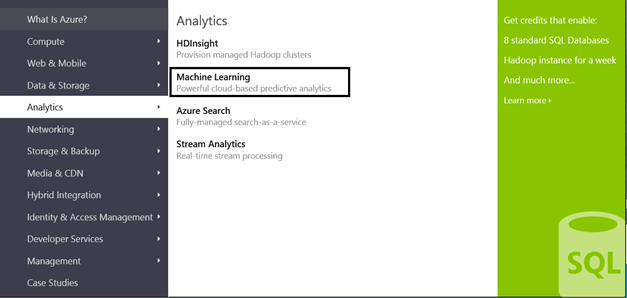
To begin, click on the link , in the menu item Products, select Analytics and click Machine Learning. Or use the direct link.
On the page that opens, click Get Started now.
To work with Azure ML, you need an active Microsoft Azure subscription. If you already have one, just sign in to the Azure Management Portal, otherwise, register a free trial account in advance by clicking on the link .
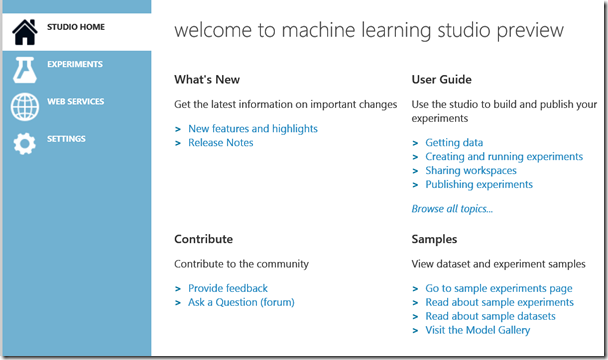
After successful authorization, you will find yourself on the main page of the Azure ML Studio - an environment where all further work will take place.
Data loading
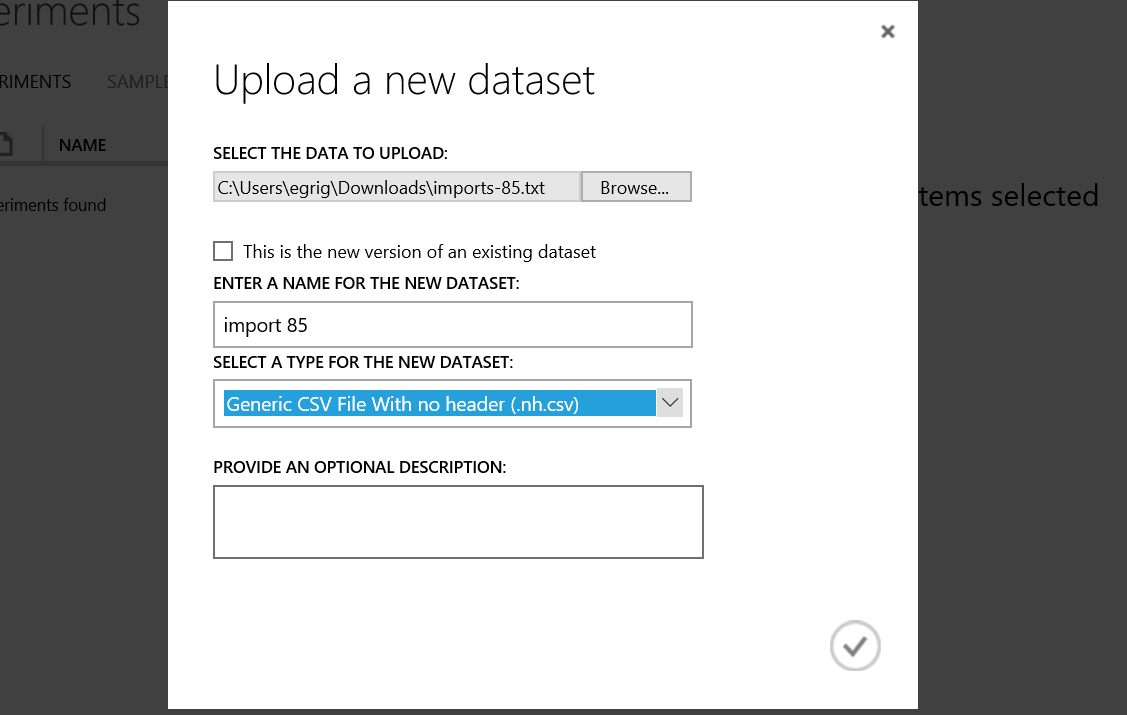
The first step is to load the training set. To do this, click on the link and download to your computer the file imports-85.data, containing a sample of data on cars.
To upload this file to Azure ML Studio, click on New at the bottom of the page and in the panel that opens, select Dataset and From Local File. In the download menu, specify the path to the downloaded file, the name, and select Generic CSV File with no header (.hn.csv) as the type.
Create a new experiment
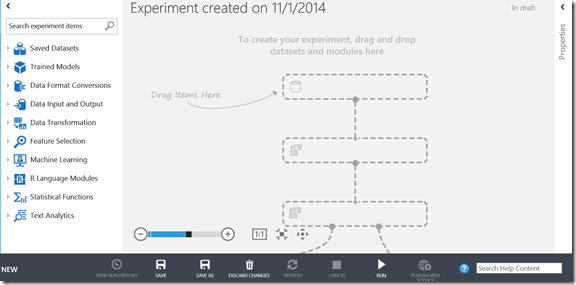
To create a new experiment, select New -> Experiment -> Blank Experiment. This will create a new experiment workspace with the toolbar on the right.
Determination of data sampling
Previously loaded data should be reflected in the Saved Datasets section on the left. Select it and drag it to any place in the workspace, for example, wherever the Drag Items Here arrow points.
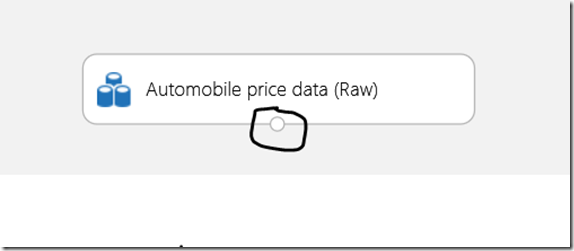
Note that the data source has a circle-shaped connection point, which is used to connect it to other components.
Data preparation
When developing machine learning models, it is good practice to check the preliminary results of the experiment after each change. Therefore, right-click on the connection point and select Visualize. As a result, a window will appear giving a general idea of the data and its distribution.
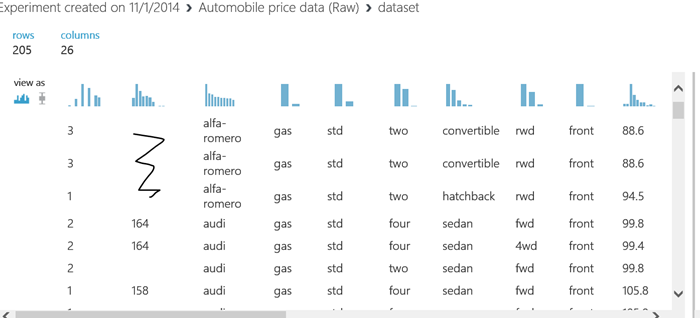
As you can see, the sample has a problem - there are no values in the second column. This can create an undesirable effect in the learning process and significantly degrade the quality of the model. But, fortunately, these values characterize insurance costs and are weakly related to the price of the car, and therefore they can be removed. In addition, the columns have no names, which makes it difficult to work with them.
To fix a problem with names from the Data Transformation / Manipulation group, drag the Metadata Editor to the work surface.
Drag the output (bottom) of the data sample to the input (top) of the new component to connect them. Now click on it to open the settings window on the right. Metadata Editor allows you to change the meta information of one or more columns, including the type or name. Open the column selection wizard by clicking on Launch column selector. To select all columns, in the Begin With field, select All columns, delete the selection refinement line by clicking on the “-“ sign on the right and confirm by clicking on the check mark.
In the New column names field of the settings panel, enter the new column names, separated by commas, which can be found in the import-85.names file from the link provided earlier. The field value should be as follows:
symboling, normalized losses, make-up, fuel-type, body-style, drive-wheels, engine-location, wheel-base, length, width, height, curb-weight, engine-type, num-of-cylinders, engine-size, fuel-system, bore, stroke, compression-ratio, horsepower, peak-rpm, city-mpg, highway-mpg, price
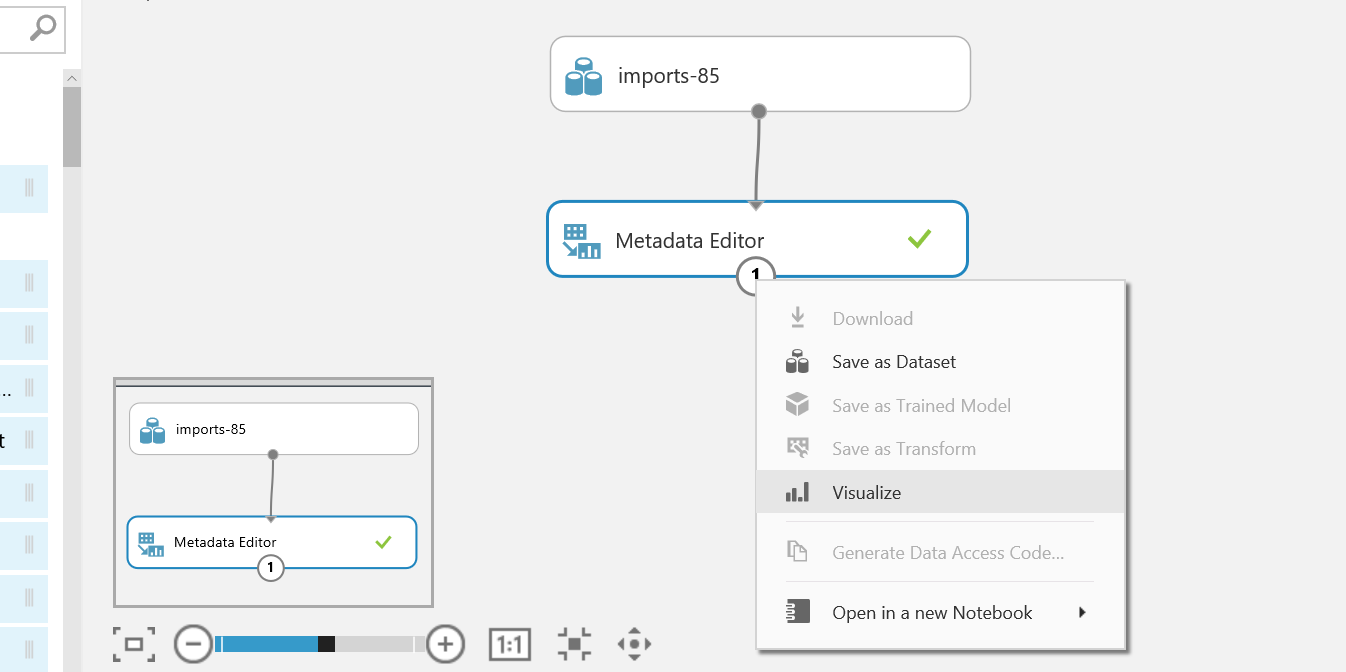
In order to see the result of the component, click on the Run from below and visualize the Metadata Editor output as previously described.
Now remove the normalized-losses. To do this, drag Project Columns from the same group to the workspace, connect it to the Metadata Editor and go to its settings. Select the row selection wizard again and this time select all the rows except for normalized-losses, making settings similar to those shown in the figure below.
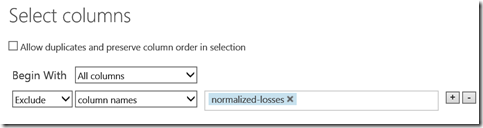
Run the experiment and visualize the result to make sure that the second column is missing from the sample.
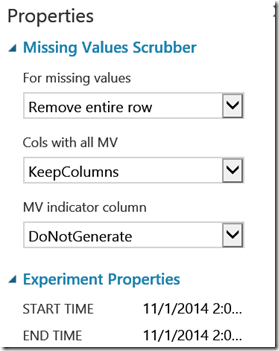
Unfortunately, there are still columns in which values are missing. But there are not many of them, and therefore it can be confined only to dropping incomplete lines. To do this, select the Missing Value Scrubber and connect it to Project Columns. In the For missing values field, change the value to Remove entire row. Run, visualize and make sure the lines with empty values are missing.
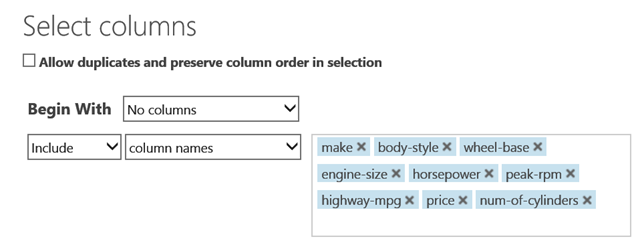
There remains the last question that needs to be answered at the preparation stage: do all the characteristics affect the price of the car? At this stage, you can limit yourself to the following small number of indicators, a list of which is given below. In the future, you can always add new ones and test the hypothesis of their sufficiency by comparing the accuracy of the models obtained.
make-up, body-style, wheel-base, engine-size, horsepower, peak-rpm, highway-mpg, num-of-cylinders, price
Add a new Project Columns and select the above columns.
In conclusion, make sure that the data preparation is successful by running the experiment and visualizing the result.
Sample breakdown
Now the data is ready for use in the learning process. But in machine learning, the effect, called “retraining,” is possible - learning a data model without generalization. This behavior leads to the impossibility of adequate prediction on any different data. To handle this situation, the sample is divided into training and test in the ratio close to 3: 1. The last of them does not participate in the learning process in any way and upon completion is used to estimate the prediction error. If this error is significantly different from the error on the training sample, then the effect described above is observed.
To create a test sample, drag and drop Split Data from the Data Transformation / Sample and Split group to the last Project Columns. Set the proportion of lines on the first exit to 0.75 and make sure that the Randomize Split flag is set.
Learning linear regression model
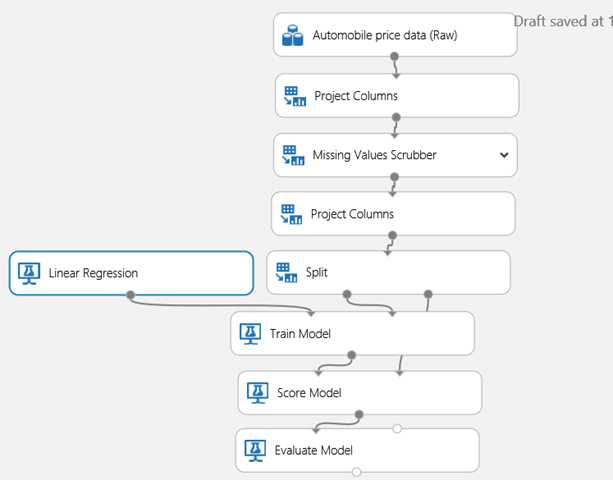
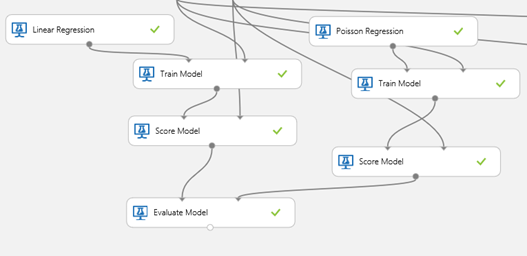
First, drag the Linear Regression, Train Model, Score Model and Evaluate Model components from the toolbar. Train Model is a universal component that allows training of any model on any training sample. To configure our particular case, connect the first (left) output of the Split Data and the output of the Linear Regression to the corresponding inputs of the Train Model. In the Train Model settings, specify the price as the target value (outcome column). Now the model is ready to learn.
But besides the training itself, it is important to know the result of the training. The Score Model component allows you to calculate the output of a trained model on an arbitrary sample and calculate the prediction result. Connect the Train Model output, which contains the trained model, to the corresponding Score Model input, and as a sample of data to another input, submit a test sample from the second output of Split Data. Connect the Score Model output to any of the Evaluate Model inputs in order to calculate the numerical characteristics of the learning quality. The result should be a process similar to that shown in the figure.
Run the model and visualize the result of the Evaluate Model.
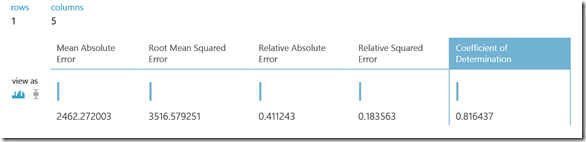
The coefficient of determination indicates how well the regression line describes the raw data. Values taken from it range from 0 to 1, where absolute absolute value corresponds to one. In our case, the coefficient is 82%. Whether this is a good result or not is directly dependent on the formulation of the problem and a certain tolerance for error. For the case of predicting the price of a car, 82% is an excellent result. If you want to improve it, try adding other columns to Project Columns or try a completely different algorithm. For example, Poisson Regression. The latter can be achieved by simply replacing the linear regression component with a puason. But a more interesting approach is to assemble parallel training from the elements and connect the result to the second output of the Evaluate Model, which will allow to compare the training results of both models in a convenient form.
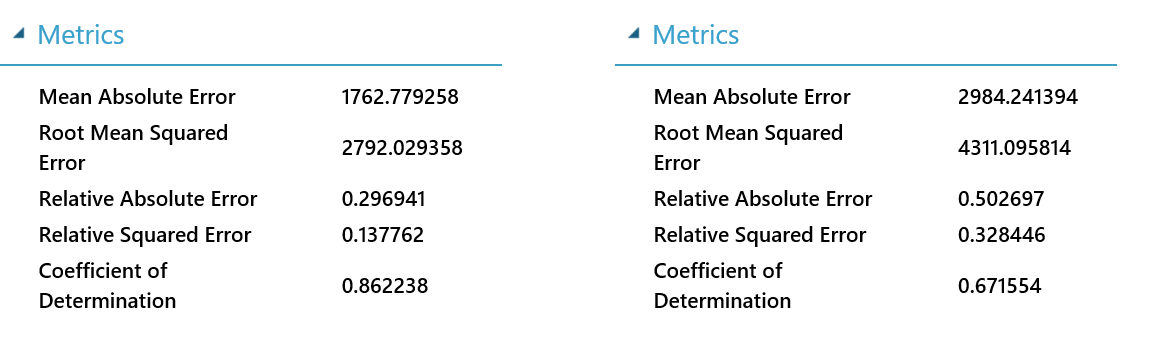
Run the model and visualize the result. As can be seen from the result, the data are much better described by the linear regression model, and therefore there is every reason to select it as the final one.
Right-click on the Train Model component that responds to linear regression and select Save as Trained Model. This will allow the model to be used in any other experiments without the need for re-training.
Web service publishing
To publish a service, select the Train Model component that responds to linear regression and click on Set Up Web Service. In the menu that opens, select Predictive Web Service [Recommended] and wait for Azure ML to create a new experiment optimized for the needs of the service. Delete the automatically created Web Service Input and Web Service Output components — we will create them later after a little preparation.
At the moment, the Score Model element repeats all incoming columns at the output, and the predicted value is given the name Score Labels. This needs to be fixed.
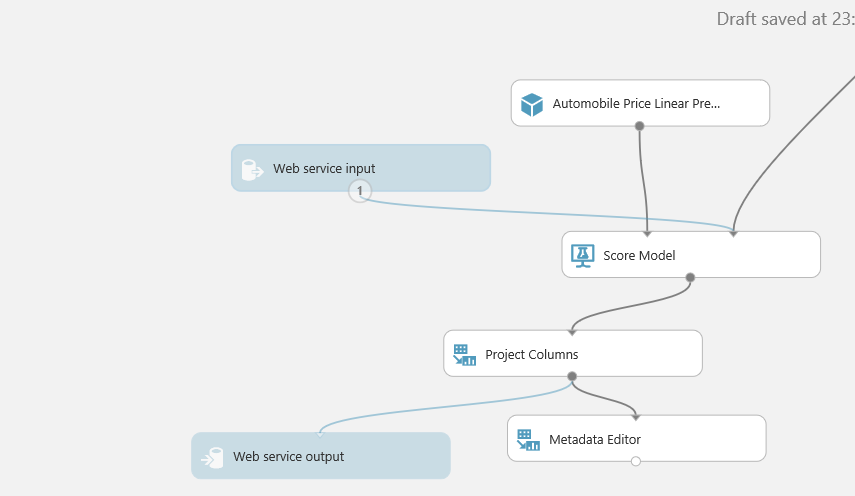
To do this, transfer two familiar components from the toolbar to the work surface: Project Columns and the Metadata Editor. And connect them in the sequence shown in the figure below. In the Project Columns settings, select only one Score Labels column, and use the Metadata Editor to rename it to price.
In conclusion, you need to add the input and output of the created service. To do this, add to the Web Service Input and Web Service Output experiment. Connect the first to the input of the Score Model, and the second to the output of the Metadata Editor. In the settings of both elements, change the name to “input” and “prediction”, respectively.
Run the model again by clicking on Run, and after the validation is completed, publish the service by clicking Deploy Web Service.
Service testing
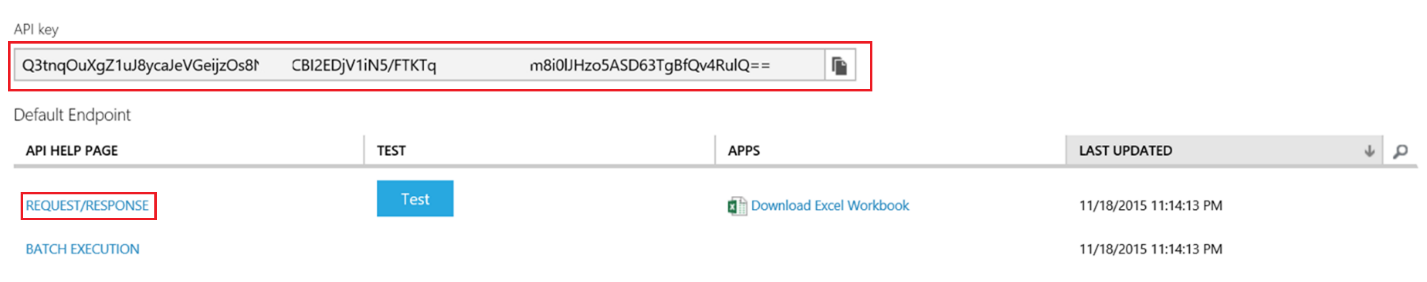
After clicking Deploy Web Service, you will be redirected to a page with information about the newly created service. The links under the HELP PAGE API contain a fairly detailed description with information about the contents of the incoming and outgoing JSON packets, as well as an example of the console application code, which gives an idea of how to use.
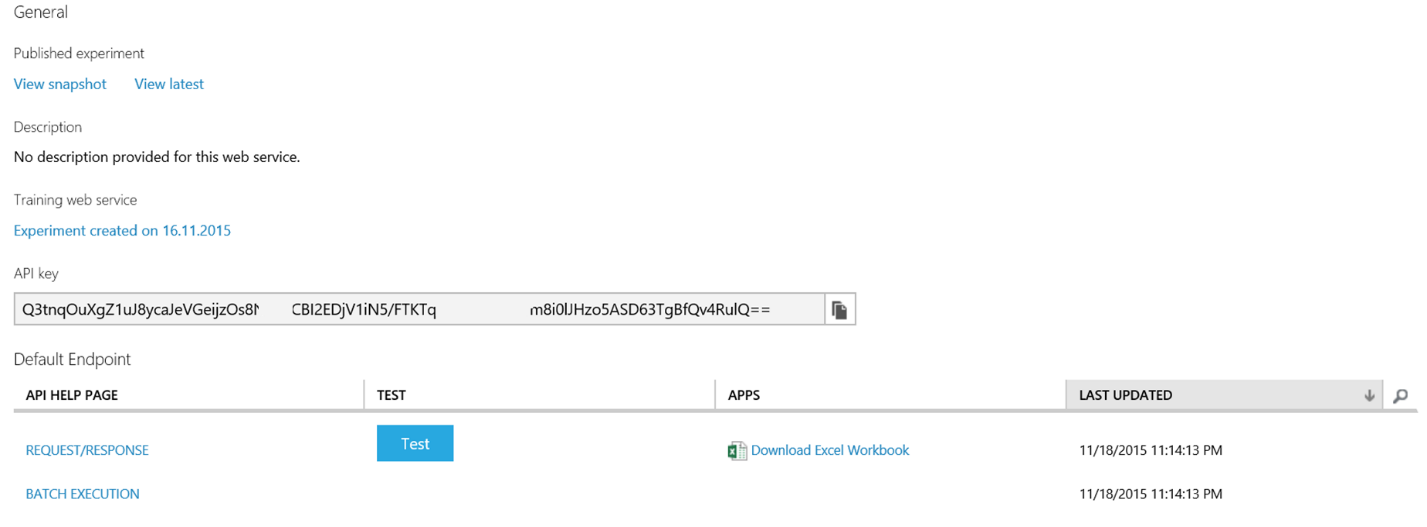
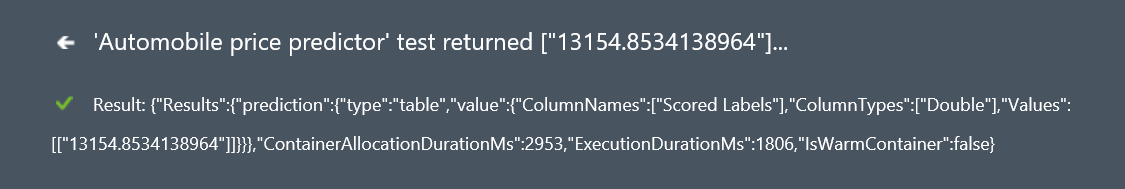
For an interactive study, click on Test and in the window that opens, enter values for each input parameter. For example, those listed below, and click the check mark to send a test request.
audi sedan 99.8 four 109 102 5500 30 13950
Application development
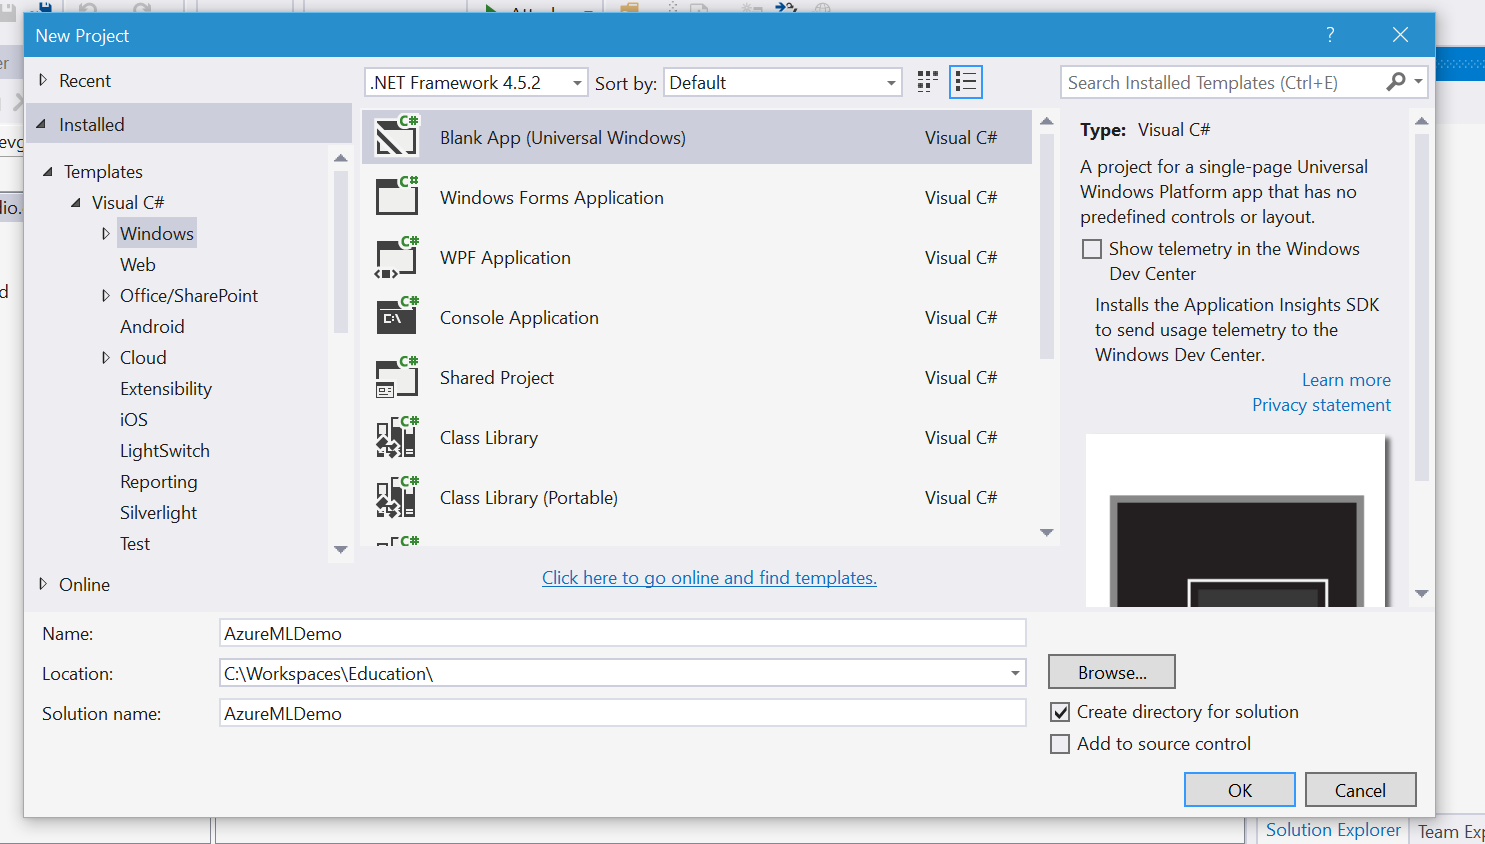
In conclusion, consider the process of developing a mobile application that uses Azure ML as a back-end service. First create a new project for a universal Windows application. To do this, open Visual Studio 2015, select File -> New -> Project ... In the window that opens, go to the Windows tab in the left menu and select Blank App (Universal Windows). In the title field, enter AzureMLDemo and click OK. If necessary, the finished project can be found on GitHub .
After some preparation, Visual Studio will open a new universal application project. Make sure that the x86 is indicated in the processor architecture field to the right of Debug, and to the right, select one of the mobile virtual machines as the launch environment. For example, Mobile Emulator 10.0.10240.0 720p 5 inch 1GB.
Now you can proceed to writing the application itself. In the Solution Explorer menu, double-click on MainPage.xaml. The description of the XAML markup language of the graphical interface is beyond the scope of this work, so just replace the opening and closing <Grid ...> tags with the code below.
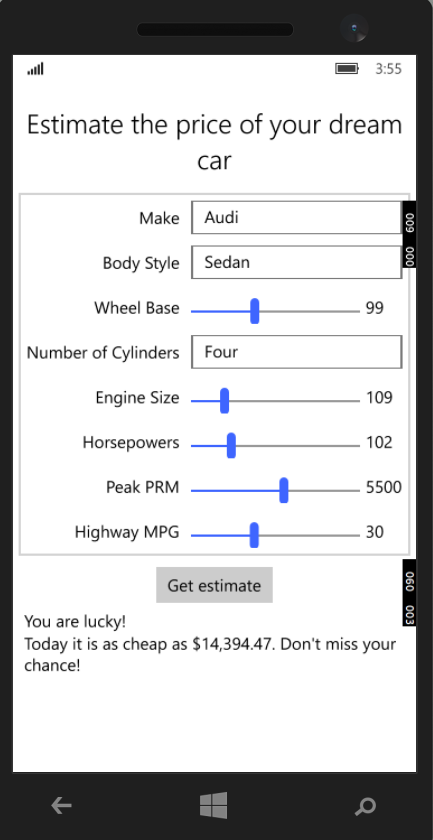
<ScrollViewer Background="{ThemeResource ApplicationPageBackgroundThemeBrush}" HorizontalScrollMode="Disabled" VerticalScrollBarVisibility="Hidden"> <StackPanel> <TextBlock Text="Estimate the price of your dream car" Style="{ThemeResource TitleTextBlockStyle}" TextAlignment="Center" HorizontalAlignment="Center" Margin="5,20,5,5" TextWrapping="WrapWholeWords"/> <Border Margin="5 10" BorderBrush="LightGray" BorderThickness="2"> <Grid> <Grid.ColumnDefinitions> <ColumnDefinition Width="Auto"/> <ColumnDefinition Width="*"/> <ColumnDefinition Width="40"/> </Grid.ColumnDefinitions> <Grid.RowDefinitions> <RowDefinition Height="40"/> <RowDefinition Height="40"/> <RowDefinition Height="40"/> <RowDefinition Height="40"/> <RowDefinition Height="40"/> <RowDefinition Height="40"/> <RowDefinition Height="40"/> <RowDefinition Height="40"/> </Grid.RowDefinitions> <TextBlock Text="Make" Grid.Row="0" Grid.Column="0" VerticalAlignment="Center" HorizontalAlignment="Right" Margin="5"/> <TextBox Name="tbxMake" Text="Audi" Grid.Row="0" Grid.Column="1" Grid.ColumnSpan="2" VerticalAlignment="Center" HorizontalAlignment="Stretch" Margin="5"/> <TextBlock Text="Body Style" Grid.Row="1" Grid.Column="0" VerticalAlignment="Center" HorizontalAlignment="Right" Margin="5"/> <TextBox Name="tbxBodyStyle" Text="Sedan" Grid.Row="1" Grid.Column="1" Grid.ColumnSpan="2" VerticalAlignment="Center" HorizontalAlignment="Stretch" Margin="5"/> <TextBlock Text="Wheel Base" Grid.Row="2" Grid.Column="0" VerticalAlignment="Center" HorizontalAlignment="Right" Margin="5"/> <Slider Name="slWheelBase" Value="99" Grid.Row="2" Grid.Column="1" Minimum="86" Maximum="121" StepFrequency="1" VerticalAlignment="Center" HorizontalAlignment="Stretch" Margin="5,5,3,5"/> <TextBlock Name="tbWheelBase" Grid.Row="2" Grid.Column="2" Text="{x:Bind slWheelBase.Value, Mode=OneWay}" VerticalAlignment="Center" Margin="2,5,5,5"/> <TextBlock Text="Number of Cylinders" Grid.Row="3" Grid.Column="0" VerticalAlignment="Center" HorizontalAlignment="Right" Margin="5"/> <TextBox Name="tbxNumberOfCylinders" Text="Four" Grid.Row="3" Grid.Column="1" Grid.ColumnSpan="2" VerticalAlignment="Center" HorizontalAlignment="Stretch" Margin="5"/> <TextBlock Text="Engine Size" Grid.Row="4" Grid.Column="0" VerticalAlignment="Center" HorizontalAlignment="Right" Margin="5"/> <Slider Name="slEngineSize" Value="109" Grid.Row="4" Grid.Column="1" Minimum="61" Maximum="326" StepFrequency="1" VerticalAlignment="Center" HorizontalAlignment="Stretch" Margin="5,5,3,5"/> <TextBlock Name="tbEngineSize" Grid.Row="4" Grid.Column="2" Text="{x:Bind slEngineSize.Value, Mode=OneWay}" VerticalAlignment="Center" Margin="2,5,5,5"/> <TextBlock Text="Horsepowers" Grid.Row="5" Grid.Column="0" VerticalAlignment="Center" HorizontalAlignment="Right" Margin="5"/> <Slider Name="slHorsepowers" Value="102" Grid.Row="5" Grid.Column="1" Minimum="48" Maximum="288" StepFrequency="1" VerticalAlignment="Center" HorizontalAlignment="Stretch" Margin="5,5,3,5"/> <TextBlock Name="tbHorsepowers" Grid.Row="5" Grid.Column="2" Text="{x:Bind slHorsepowers.Value, Mode=OneWay}" VerticalAlignment="Center" Margin="2,5,5,5"/> <TextBlock Text="Peak PRM" Grid.Row="6" Grid.Column="0" VerticalAlignment="Center" HorizontalAlignment="Right" Margin="5"/> <Slider Name="slPeakRPM" Value="5500" Grid.Row="6" Grid.Column="1" Minimum="4150" Maximum="6600" StepFrequency="1" VerticalAlignment="Center" HorizontalAlignment="Stretch" Margin="5,5,3,5"/> <TextBlock Name="tbPeakRPM" Grid.Row="6" Grid.Column="2" Text="{x:Bind slPeakRPM.Value, Mode=OneWay}" VerticalAlignment="Center" Margin="2,5,5,5"/> <TextBlock Text="Highway MPG" Grid.Row="7" Grid.Column="0" VerticalAlignment="Center" HorizontalAlignment="Right" Margin="5"/> <Slider Name="slHighwayMPG" Value="30" Grid.Row="7" Grid.Column="1" Minimum="16" Maximum="54" StepFrequency="1" VerticalAlignment="Center" HorizontalAlignment="Stretch" Margin="5,5,3,5"/> <TextBlock Name="tbHighwayMPG" Grid.Row="7" Grid.Column="2" Text="{x:Bind slHighwayMPG.Value, Mode=OneWay}" VerticalAlignment="Center" Margin="2,5,5,5"/> </Grid> </Border> <Button Name="btnGetEstimate" Grid.Row="2" Content="Get estimate" HorizontalAlignment="Center"/> <TextBlock Name="tbResult" TextAlignment="Left" Margin="10 5" TextWrapping="Wrap"/> </StackPanel> </ScrollViewer> Despite all the seeming complexity, this code creates a fairly simple markup needed to enter user data. Each input element of one of the model parameters has a name like tbxMake, txbBodyStyle, etc. Under them is the Get Estimate button, which is responsible for sending a message to the Azure ML service, and all is completed with the tbResult element, into which the result of the call will be placed.
Start the application by clicking on Debug -> Start Debugging to make sure that everything has been done correctly, the project is compiled and run. Check that changing the position of the sliders leads to a corresponding change in the numerical value to the right of them.
Stop the debugging session by clicking on Debug -> Stop Debugging.
Definition of program logic
Now it is necessary to determine the processing code for clicking on the Get Estimate button. In Solution Explorer, expand MainPage.xaml and double-click on MainPage.xaml.cs to open the Code-behind file of this graphical interface.
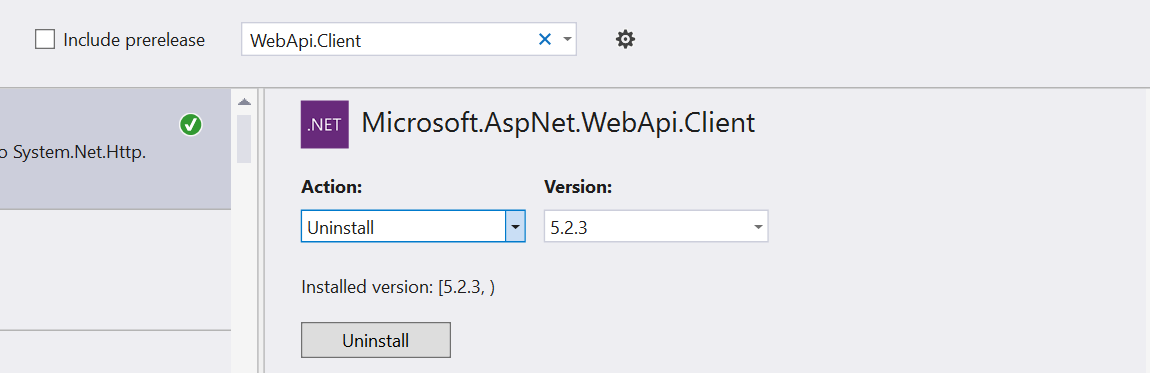
First of all, you should connect several required libraries. To do this, right-click on the project name and select Manage Nuget Packages ... In the menu that opens, search WebApi.Slient and install the package called Microsoft.AspNet.WebApi.Client.
After that, add the following additional using declarations to the beginning of the file:
using System.Net.Http; using System.Net.Http.Headers; using Newtonsoft.Json; using System.Threading.Tasks; </source MainPage , . <source lang="cs"> public sealed partial class MainPage : Page { const string _apiKey = @"<your API key>"; const string _requestUri = @"Your key"; The access key can be found on the Dashboard page of your service, and the address of the request is on the REQUEST / RESPONSE help page, the link to which is given below.
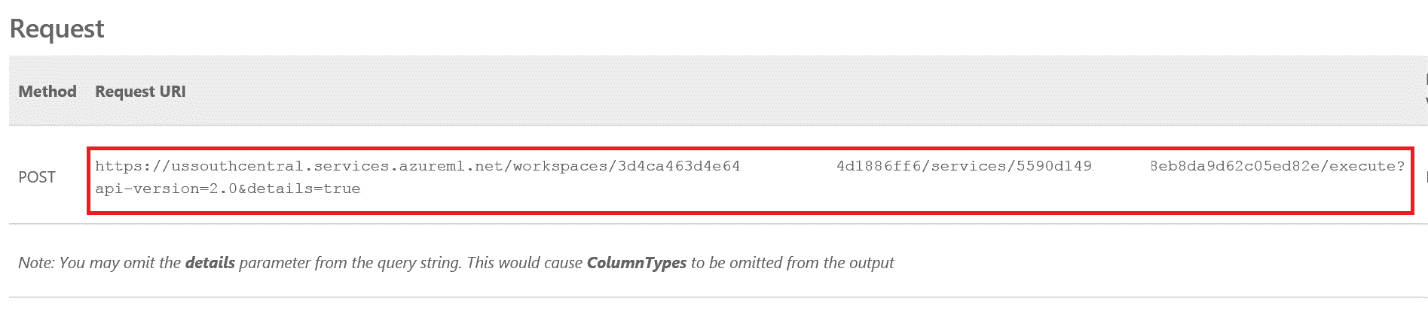
The next step is to add a helper function that will query the Azure ML service. In accordance with the documentation provided on the same REQUEST / RESPONSE help page, to receive a response, we must perform the following sequence of actions: create a request, send it to the service side with a HTTP POST request and process the response.
Create a CallAzureML function that accepts the input values of all model parameters and returns a float value with a price estimate. The Async Task here responds to the implementation of the async / await pattern, which greatly simplifies working with asynchronous calls in the application (additional information can be found here ).
private async Task<float> CallAzureML(string make, string bodyStyle, double wheelBase, string numberOfCylinders, int engineSize, int horsepowers, int peakRPM, int highwayMPG) { } Also, to simplify working with JSON, we will use the Newtonsoft.Json library. Its distinctive feature is that it allows you to interact with JSON objects through a convenient abstraction in the form of ordinary .NET-level objects. Place the following code at the beginning of the method.
var requestBody = new { Inputs = new Dictionary<string, object>() { { "input", new { ColumnNames = new string[] {"make", "body-style", "wheel-base", "num-of-cylinders", "engine-size", "horsepower", "peak-rpm", "highway-mpg", "price"}, Values = new string[,] { { make, bodyStyle, wheelBase.ToString(), numberOfCylinders, engineSize.ToString(), horsepowers.ToString(), peakRPM.ToString(), highwayMPG.ToString(), "0" } } } } }, GlobalParameters = new Dictionary<string, int>() }; Here the structure of the JSON object of the request is recreated using an anonymous class and completely (case sensitive) repeats the structure of the expected request. For comparison, an example of such a request from the REQUEST / RESPONSE page is presented below.
{
"Inputs": {
"input": {
"ColumnNames": [ "make", "body-style", “wheel-base", "num-of-cylinders",
"engine-size", "horsepower", "peak-rpm", "highway-mpg",
"price" ],
"Values": [
[ "value", "value", "0", "value", "0", "0", "0", "0", "0" ],
[ "value", "value", "0", "value", "0", "0", "0", "0", "0" ]
]
}
},
"GlobalParameters": {}
}
The next step is to make the request to the service itself. To do this, add the following code to the method being developed.
try { using (var client = new HttpClient()) { client.DefaultRequestHeaders.Authorization = new AuthenticationHeaderValue("bearer", _apiKey); client.BaseAddress = new Uri(_requestUri); var response = await client.PostAsJsonAsync("", requestBody); if (response.IsSuccessStatusCode) { // succeeded throw new NotImplementedException(); } else { // failed throw new NotImplementedException(); } } } catch (Exception e) { throw; } The first task is to create an HTTP client and set all the information needed to successfully connect to the service in Azure ML: the address and access key. Next, a POST request is made towards the service with the JSON object created earlier. The success of the call is checked by the HTTP status code.
Replace the code in the field marked by the comment succeeded with the one shown below. It consistently receives the server’s response as a string, parses it into a dynamic object using the Newtonsoft.Json converter, and then extracts the price information. An example of the server response for comparison can be found in the section "Testing the service".
var responseContent = await response.Content.ReadAsStringAsync(); var val = JsonConvert.DeserializeObject<dynamic>(responseContent); float? price = (float)val?.Results?.prediction?.value?.Values[0][0]; if (price == null) throw new InvalidDataException("Response message has unknown format" + " or is empty."); return (float)price; In case of an erroneous state, the method should return maximum information. Therefore, as in the previous case, the content of the query is retrieved as a string, but this time it is sequentially converted to an object and back to a string. This is necessary in order to add indentation, allowing more convenient reading of its contents. Replace the code in the area marked with the failed comment with the one below.
var responseContent = await response.Content.ReadAsStringAsync(); var responseObject = JsonConvert.DeserializeObject(responseContent); var formattedResponseContent = JsonConvert.SerializeObject(responseObject, Formatting.Indented); var message = String.Format("Server returned status code {0} with message {1}", response.StatusCode, formattedResponseContent); throw new InvalidDataException(message); The method of calling Azure ML can be considered complete. As you can see, its implementation is quite simple, although it builds a whole process behind it on the implementation of a statistical data model, a learning algorithm and a method for evaluating an arbitrary estimate of the input vector. Quite complex mathematical theories fit in a couple of lines of program code.
In conclusion, you need to implement an event handler for pressing the Get estimate button. First, go to MainPage.xaml and add the information about the event handler to the XML tag of the GetEstimate button.
<Button … Click="GetEstimate_Click"/> Return to MainPage.xaml.cs and create the appropriate method. It calls the previously created method to access the Azure ML service and sets the result to tbResult.
private async void GetEstimate_Click(object sender, RoutedEventArgs e) { try { var price = await CallAzureML(tbxMake.Text, tbxBodyStyle.Text, slWheelBase.Value, tbxNumberOfCylinders.Text, (int)slEngineSize.Value, (int)slHorsepowers.Value, (int)slPeakRPM.Value, (int)slHighwayMPG.Value); tbResult.Text = String.Format("You are lucky!\n" + "Today it is as cheap as {0:c}. Don't miss your chance!", price); } catch (Exception ex) { // Shows error in result TextBlock tbResult.Text = String.Format("Oops! Something went wrong.\n" + "This can be helpful:\n{0}", ex.ToString()); } } That's it, the application is ready. Run it and experiment with estimating the cost of the car with different sets of characteristics.
Conclusion
Azure Machine Learning is a new, highly productive tool for working with machine learning algorithms. Perhaps this is even the only environment that makes it so easy to publish your algorithms as a separate service and later use them in your applications. In this work, one of the simplest learning algorithms was used - a linear regression algorithm. Dozens of others are available in Azure ML, created by scientists for a variety of purposes. And the most important thing is that there is no need to be a mathematician to use them. It is enough to assemble the necessary data processing with the help of components, conduct several experiments and, if successful, publish everything as a service.
Here are some more samples of data to experiment with:
Source: https://habr.com/ru/post/275475/
All Articles