Remote debugging javascript with VS2015. Part 1
I propose a translation of the article “VS2015 Remote Debugging Javascript” .
VS2015 provides a first-class debugging experience for JavaScript code. You can use remote debugging functions to debug JavaScript code on a remote machine. The process being debugged can be an IE, a Windows Store app, or even a .NET application that uses a control for an embedded browser! Almost everything that you can debug locally is also available for remote debugging. This gives us great opportunities, for example, now you can debug your JavaScript code working in the QA or Production environment directly. To get started, you can use the following steps.
Install Visual Studio 2015 on the development machine . Most developers are aware of how to do this, so we will not dwell on it in detail.
Install VS 2015 Remote Debugger on target machine:
')
VS 2015 Remote Debugger configuration on target machine.
Connect VS2015 to VS2015 Remote Debugger on the target machine.
Debugging JS code in the Web browser control (WebOC). You can debug not only IE, but also the application (.NET / C ++ | managed / native), which is the host for WebOC or Web Browser Control. To do this, simply run the application on the target machine. In our example, the name of the .NET application with WebOC will be PCOETest.exe. Open VS2015 and, following the process already described to connect to a remote process, connect to your application instead of IE.

You can debug as if it were a local managed application that hosts the web browser control.
Frequently asked questions about debugging and fixing problems (FAQ).
Firewall configuration:
VS2015 provides a first-class debugging experience for JavaScript code. You can use remote debugging functions to debug JavaScript code on a remote machine. The process being debugged can be an IE, a Windows Store app, or even a .NET application that uses a control for an embedded browser! Almost everything that you can debug locally is also available for remote debugging. This gives us great opportunities, for example, now you can debug your JavaScript code working in the QA or Production environment directly. To get started, you can use the following steps.
Install Visual Studio 2015 on the development machine . Most developers are aware of how to do this, so we will not dwell on it in detail.
Install VS 2015 Remote Debugger on target machine:
')
- Visit www.microsoft.com/en-us/download/details.aspx?id=48155&NavToggle=True and download the version corresponding to the bitness of the target system. You can also install a remote debugger on Windows with an ARM processor.
- Double-click on rttols_setup_x64.exe launch the installer:

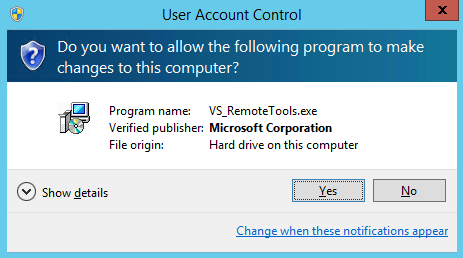
- After clicking on Install, a UAC (User Account Control) confirmation window will appear. Administrator rights are required to install remote debugging tools. Click Yes to continue the installation:
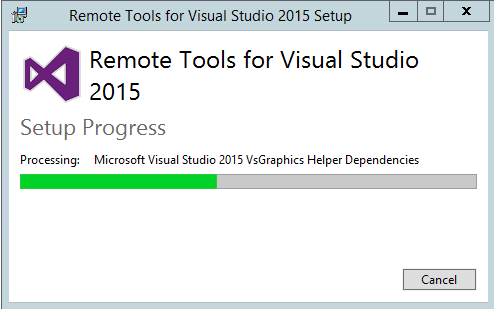
- The program installs the necessary files:
- Click Close and the installation is complete:
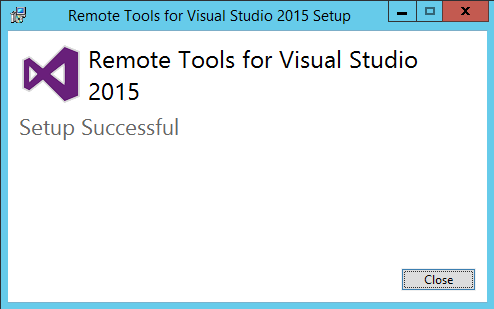
- After successful installation on the target machine, we will be able to discover the new Remote Debugger application:

VS 2015 Remote Debugger configuration on target machine.
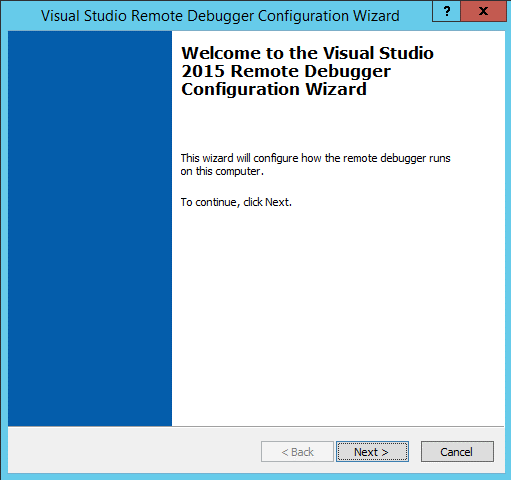
- Click on the VS2015 Remote Debugger Configuration Wizard. The system will ask you to enter the credentials of the system administrator, or will offer to launch with elevated privileges, after providing which, in fact, the wizard will start. Click Next to continue:
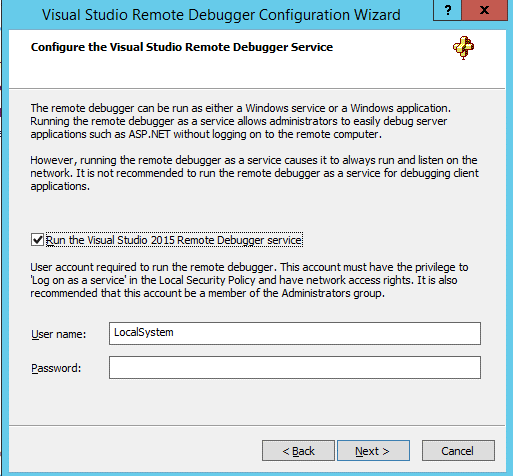
- Select Run the Visual Studio 2015 Remote Debugger service and click Next. You do not need to enter a password for the LocalSystem account. Also, for the service to work, you can enter / provide other credentials with administrative rights on the target machine:
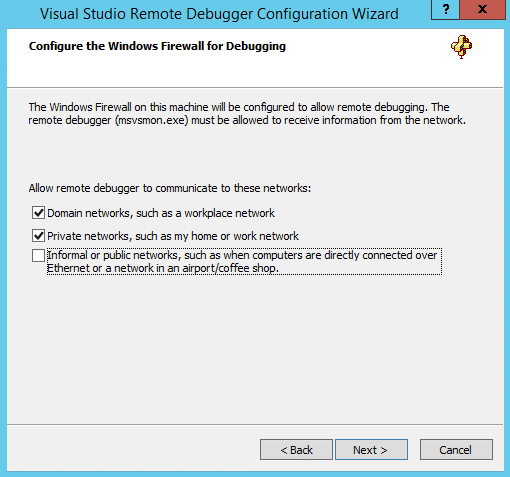
- On the next screen, you may want to deselect the third option if the machine is inside the corporate domain and if you connect to the machine directly using an Ethernet cable. Click to continue Next:
- Click Finish to complete the configuration:

- Now open the task manager and make sure that the remote debugger is running and ready for use. On a 64-bit system, we see two instances of the debugger: 32-bit and 64-bit.

Connect VS2015 to VS2015 Remote Debugger on the target machine.
- Run Internet Explorer on the target machine where the VS2015 Remote Debugger has just been installed. Let's open in it any site for debugging, for example, msn.com.
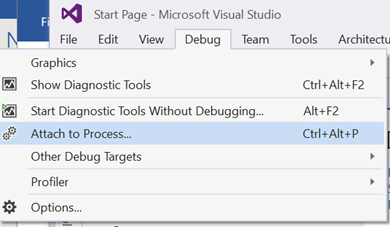
- On the developer's machine, open VS2015. Click Debug -> Attach to Process ...
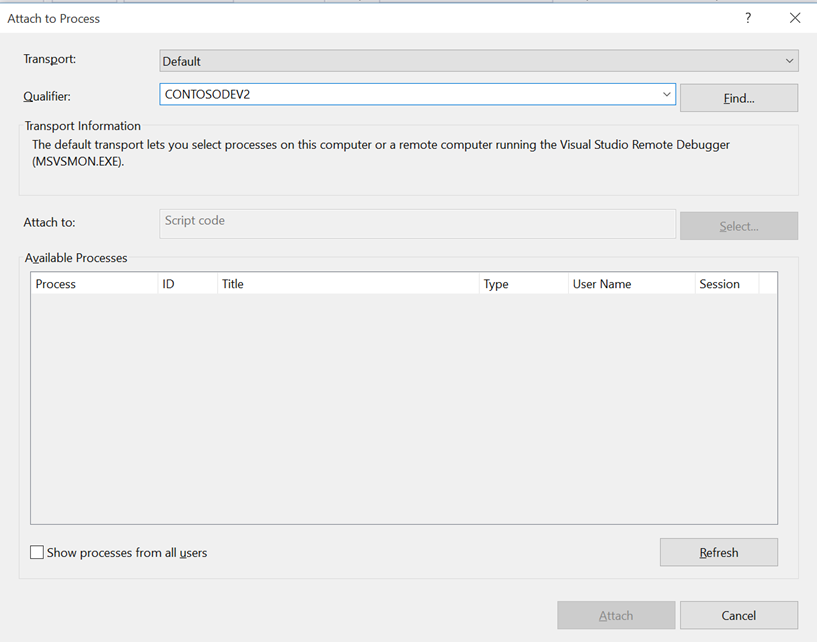
- In the Attach to Process window, specify the target machine in the Qualifier field. Or press the Find button to search for the machine in the domain. In the example, the target machine is named ContosoDev2 :
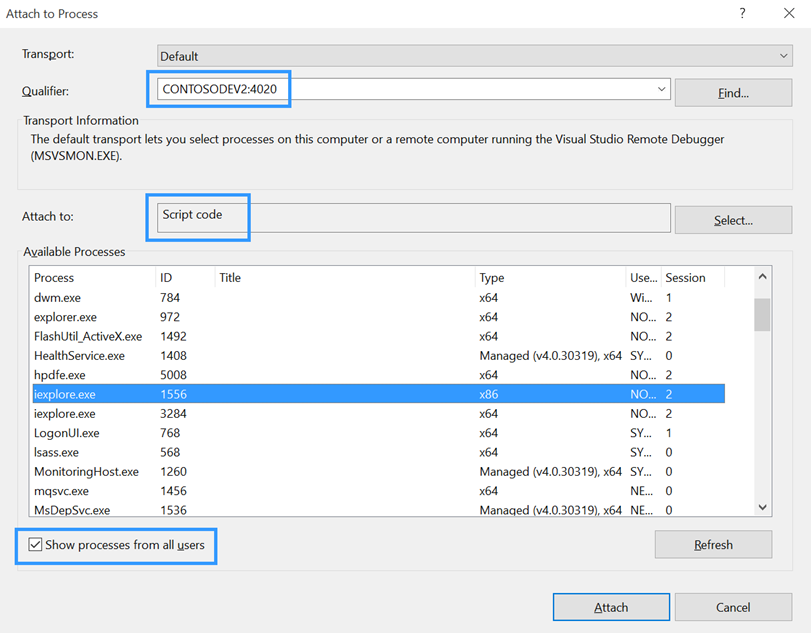
- By default, the list will not be updated, so click on the Refresh button to display a list of running processes. You can also select the Show processes from all users option if you want to debug a process started by another user. Select our target process iexplore.exe and click the Attach button:
Notes:- If the remote debugger has been configured to run under the LocalSystem account , then you will need to select the Show processes from all users option to see your processes. Otherwise, only the SYSTEM account processes will be listed.
- A qualifier ( Qualifier field) can change from ContosoDev2 to ContosoDev2: 4020
- Make sure that the Script code is selected in the Attach to field (as in the screenshot)
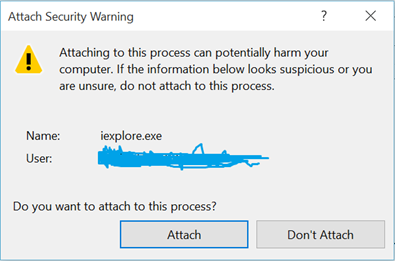
- Visual Studio will warn you about possible security issues when connecting to a remote process. If you know the remote process and the site opened in it, click Attach to continue:
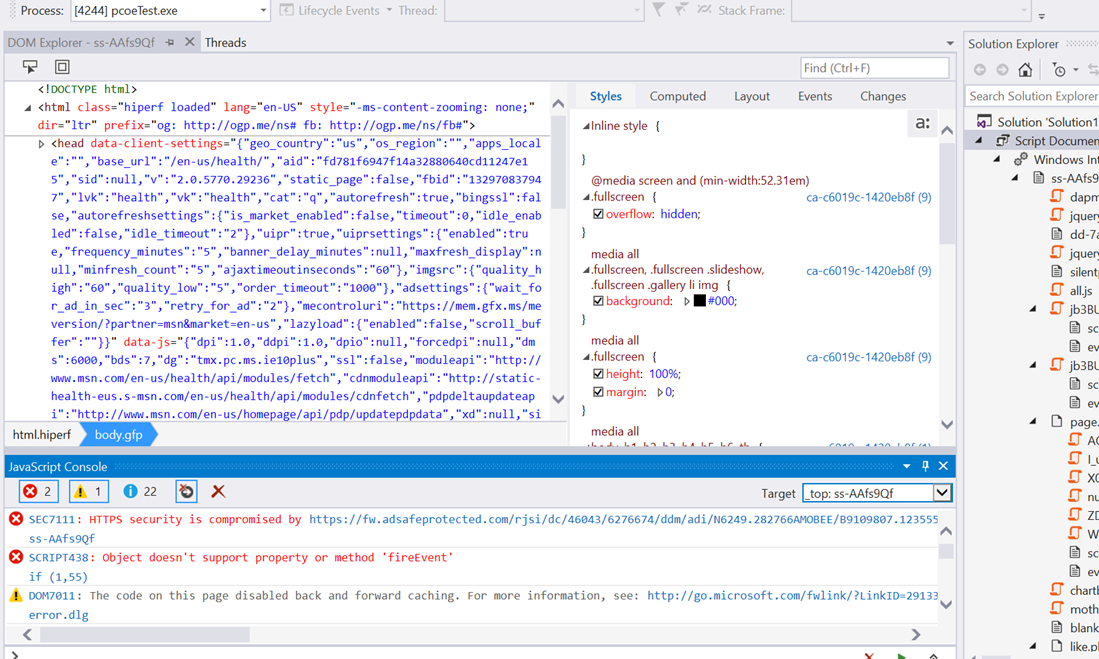
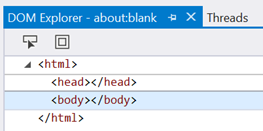
- After a successful connection, you should see the JavaScript files in the Solution Explorer. The DOM Explorer will also display the structure of the running site:

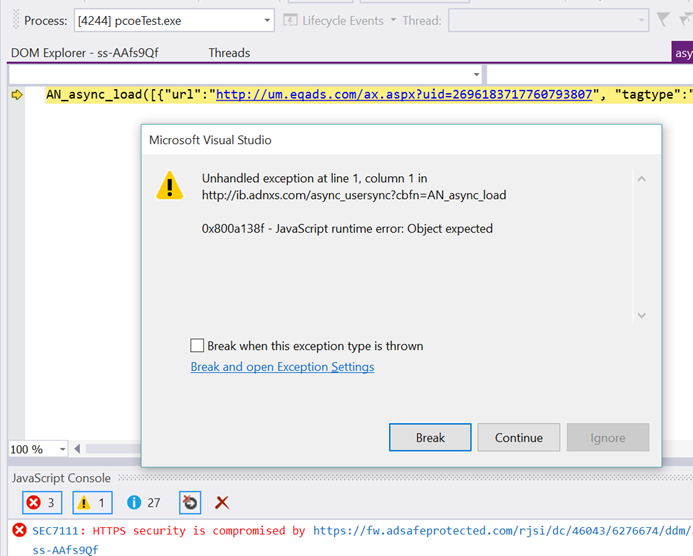
- And so, now we can debug our miracle site, opened on a remote machine, as usual:

Debugging JS code in the Web browser control (WebOC). You can debug not only IE, but also the application (.NET / C ++ | managed / native), which is the host for WebOC or Web Browser Control. To do this, simply run the application on the target machine. In our example, the name of the .NET application with WebOC will be PCOETest.exe. Open VS2015 and, following the process already described to connect to a remote process, connect to your application instead of IE.
You can debug as if it were a local managed application that hosts the web browser control.
Frequently asked questions about debugging and fixing problems (FAQ).
- I can not find a computer . Make sure that the firewall does not block connections. You can use a utility like TCPView to see if the port is open. You can also refer to the Firewall Configuration section or the remote debugger help file on the target machine for additional information.
Behind the scenes, the VS 2015 Remote Debugger installation process configures firewall rules to enable remote debugging. The default remote debugger uses TCP port 4020. You can use another port if necessary. Make sure that msvsmon.exe on port 4020 (or on your selected port) is a firewall or other security software. For x86 process on 64-bit OS, check also that port 4021 is open. - I don't see threads in the VS2015 Threads window when debugging the IE process. Or I can not debug IE / target process.
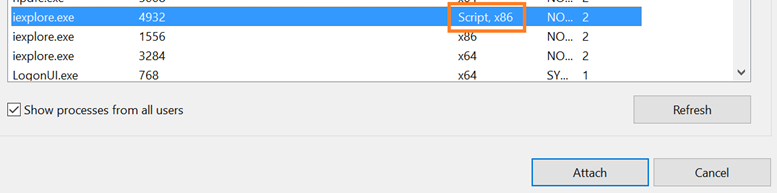
Make sure that you are connecting to the correct instance of IE. IE starts two processes on initial loading - the frame process and the tab process. You must connect the debugger to the tabs process, not the frames. Additional Information: LCIE - I still don’t see any threads in the VS2015 Threads window when connecting to the IE tabs (IE Tab Process) process.
Check out the Visual Studio JavaScript Console window. Do you see errors like this?
If yes, then you need to configure IE on the target machine to enable script debugging. So:- Open the Internet Explorer process on the target machine.
- Click Tools -> Internet Options , select the Advanced tab
- On the Advanced tab, deselect the following two items:
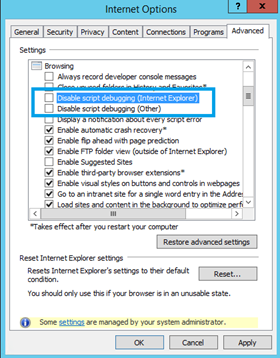
- Click OK or Apply to apply the changes.
- Turn off the debugger \ stop debugging and try to connect the debugger again
- I still do not see the threads when connecting to the desired IE process (even after removing these two options).
Make sure that you have restarted the IE process or launched a new one. Connect the VS debugger to this new process. - Can I run multiple instances of the remote debugger? Say one for each user?
Multiple instances of the remote debugger can be run on one computer. This is necessary if we have one server that is common to many users and each user wants to have their own instance of a remote debugger to debug their own processes.
Each instance should work on its own TCP / IP port. This can be set using the Tools -> Options menu of the remote debugger or the command line key:
/ port: <value>
To connect to a specific instance of the remote debugger, simply enter the computer name and, using a colon, the port number in the process connection window (for example, MyServer: 1234). - Can I debug a remote service, say, a web service running on IIS?
Yes. You can start the remote debugger either as a Windows service or as a Windows application. Running as a service makes it easy to debug server applications like ASP.NET without logging in to a remote machine.
Running the debugger as a service causes it to always start and listen to the network. It is not recommended to use the remote debugger running as a service to debug client applications.
Using the Visual Studio 2015 Remote Debug Configuration Wizard, you can control the username and password of the account under which the remote debugger runs. When the remote debugger is running as a service, the following requirements must be met in order to be able to debug the code remotely:- The user must be a member of the Computer Administrators group to be able to debug any process.
- The user should be granted the 'Log on as a service' right, which can be done using the 'Local Security Policy' administration utility.
The default user is “LocalSystem”.
Service name: "Visual Studio 2015 Remote Debugger". It is recommended to manage the service only using the Visual Studio 2015 Remote Debugger Configuration wizard. If necessary, you can also use the administrative utility to manage a computer or command line: "net stop msvsmon140" or "net start msvsmon140". - Can I debug code other than JS, such as .NET or T-SQL?
Yes, you can debug any code that VS 2015 supports debugging: managed code, unmanaged, GPU, PowerShell, Script, T-SQL, Workflow ...
- Is it necessary to install something on the target machine?
- What is needed to install VS2015 Remote Debugger?
- What does VS2015 Remote Debugger use within itself?
Remote debugging is implemented using the Windows Web Services API. The Windows Web Services API is a building block through which applications, such as the remote debugger, can communicate with each other over a network. This API is already included in Windows 7, Windows Server 2008 R2 and later OS. On Windows Server 2008 (before R2), the Visual Studio Remote Tools installer will automatically install the API. - Can I start / stop the remote debugger using the command line?
Yes, refer to the reference material for details. - Can I run the process under debugging?
Configure Visual Studio to connect to the remote debugger:- If you want to run a C # / VB project: open the project properties, go to the Debug tab, check the option to use the remote machine
- If you want to run a C ++ project: open the project properties, in the debugging options, change the Launch value to the Remote Windows Debugger and set the Remote Command property to the path that the remote computer should use
- To connect to an already running process: using the Attach to Process dialog (from the Tools or Debug menu items), enter the name of the remote computer in the Qualifier field, select the required process
- To debug a web site: open the web site from a remote computer (File Share) and then configure the Custom Web Server property to the URL value of the web server (eg http: // myserver )
- To run an executable file without a project: create a debugging project by opening the executable file as a project (File-> Open Project) and enter the path to the executable file (eg, \\ MyTestComputer \ c $ \ MyTest.exe). Then open the project properties and change the Connection value. Also correct the Executable property for the path that the remote machine should use.
Firewall configuration:
- The interaction between the VS2015 debugger and the target machine is always authenticated and subsequent calls are always encrypted
- To enable remote debugging, any firewalls between a computer with Visual Studio and a remote debugger must be configured so that the remote debugger (msvsmon.exe) can receive data sent from Visual Studio
- The remote debugger will automatically configure the firewall in most cases.
- However, if not, open port 4020 (for 64-bit processes on x64 OS and 32-bit processes on x86 OS) and port 4021 (for 32-bit processes on x64 OS)
- The Remote Debugger Configuration dialog can be used for the Windows Firewall rule to apply to all network profiles (Domain, Private and Informal / Public). Use Informal / Public when connecting the VS debugger directly to the target device using an Ethernet cable
Source: https://habr.com/ru/post/275473/
All Articles