DevTips: Web Developer Tips (33-48)
And once again on the air, a cycle of translations of useful tips for a web developer. This time, the author has expanded the range of tools under investigation by adding Sublime Text editor and Node.js framework Previous parts: 1-16 , 17-32 .
Go!
Contents :
33. Expanding simplified writing of CSS properties
34. Determining the match color selectors
35. Using visual navigation and viewing captured screenshots of the page loading process
36. Sublime Text: fuzzy search using GOTO functionality
37. Quickly change the value of CSS properties using the keyboard and mouse wheel
38. Scrolling an item in scope
39. Node.js: Using Babel to Run ES6
40. Transition to viewing and editing CSS or Javascript files from the Elements panel
41. Javascript variable values displayed next to the code in the debugging process
42. Use color grouping in the Network panel to simplify resource type identification.
43. Activating pseudo DOM element classes
44. Inspecting the developer tools themselves.
45. Run selected block of code from the panel “Sources”
46. Setting conditional breakpoints
47. Go to the next occurrence of the selected string using hotkeys.
48. Editing a CSS file in the “Sources” panel and simplifying the change of CSS property values
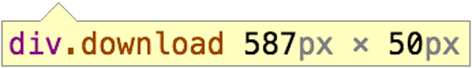
Expand the shortened entry of CSS properties by clicking on the arrow next to the corresponding property in the Styles panel. For example, the property
')
will turn into
The parts of the selectors displayed in the Styles panel can be painted in different colors depending on whether the selector of the selected DOM element matches with it or not. Unmatched parts are displayed in gray, and matched parts in black.
The Network panel also received a noticeable update. Now you can see in it a strip made in the form of a film, the frames from which are screenshots of the page rendering process. When you click on any frame, you will be moved to the appropriate place on the resource load display panel.
If you are using Sublime Text, then using the shortcut CMD + P ( Ctrl + P for Windows) you will start the search for entities in your code. For example, if you type in the search
Also use the prefix
To increase or decrease the numeric value of a CSS property, use:
When the DOM element of interest to you is outside the visible limits of the page, you can bring it back into view by using the “Scroll into view” command from the context menu of the required element in the Elements panel.
It is also useful to remember that when you hover over a DOM element, a small tooltip appears on the page, showing the size and position of the block.
You can try the ES6 features in the terminal as follows:
Now CSS and JS-resources displayed in the Elements panel can be opened directly in the Sources panel with the ability to fully edit. To do this, select “Open” in the context menu of the corresponding file.
In the updated debug mode, you can view the values of variables literally next to the executable code. This even works for minified scripts after you format them.
To enable this functionality (if it is not enabled by default), do the following:
To quickly find the necessary resources by type in the “Network” panel, use the “Color-code resource typesColor-code resource types” functionality. To enable this functionality, do the following:
Each type of resource (script, style sheet, document, font, etc.) will be painted in its own color. Now you can quickly understand which resource you are looking at, without having to read the file name.
You can activate pseudo-classes of elements in the Elements panel, such as:
With such a change in the state of the element, an orange indicator will appear to its left.
Unpin the developer tools tab and press Cmd + Alt + I. A new window will open in which you can inspect the original tool window.
This can be useful, for example, when creating a new skin for DevTools.
You can check the code snippet selected in the Sources panel by running it in the console using the shortcut Ctrl + Shift + E. The code will run in the current context.
By setting a breakpoint, you can make it conditional - dependent on the execution of some expression. To do this, select “Add Conditional Breakpoint” in the context menu of the line in the “Sources” panel and enter an expression.
You can move to the next occurrence of the selected line using the shortcut Cmd + D. If you didn’t accidentally choose what you wanted, use Cmd + U to deselect.
You can edit the CSS file in the Sources panel directly, with the changes applied immediately, no need to save the file. Also use Alt + ↑ / ↓ to change the numeric values of the CSS properties.
Stay tuned! Soon there will be the following parts.
Go!
Contents :
33. Expanding simplified writing of CSS properties
34. Determining the match color selectors
35. Using visual navigation and viewing captured screenshots of the page loading process
36. Sublime Text: fuzzy search using GOTO functionality
37. Quickly change the value of CSS properties using the keyboard and mouse wheel
38. Scrolling an item in scope
39. Node.js: Using Babel to Run ES6
40. Transition to viewing and editing CSS or Javascript files from the Elements panel
41. Javascript variable values displayed next to the code in the debugging process
42. Use color grouping in the Network panel to simplify resource type identification.
43. Activating pseudo DOM element classes
44. Inspecting the developer tools themselves.
45. Run selected block of code from the panel “Sources”
46. Setting conditional breakpoints
47. Go to the next occurrence of the selected string using hotkeys.
48. Editing a CSS file in the “Sources” panel and simplifying the change of CSS property values
33. Expanding a short write CSS properties
Expand the shortened entry of CSS properties by clicking on the arrow next to the corresponding property in the Styles panel. For example, the property
')
flex: 0 0 45%; will turn into
flex-grow: 0; flex-shrink: 0; flex-basis: 45%; View screencast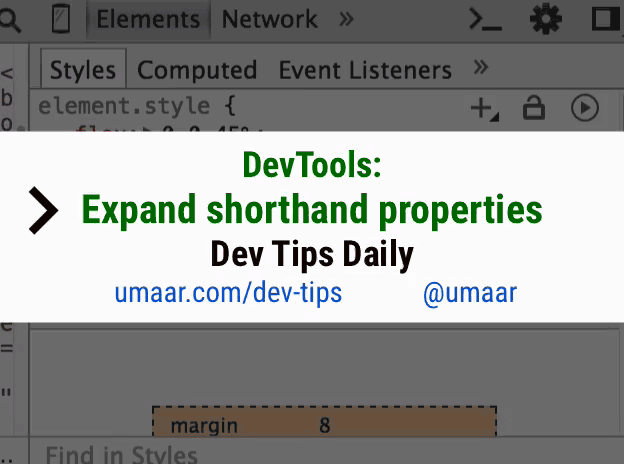
34. Determining the match color selectors
The parts of the selectors displayed in the Styles panel can be painted in different colors depending on whether the selector of the selected DOM element matches with it or not. Unmatched parts are displayed in gray, and matched parts in black.
View screencast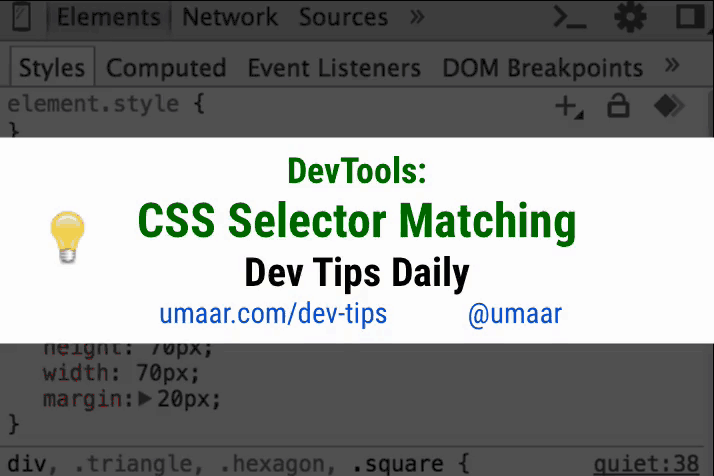
35. Using visual navigation and viewing captured screenshots of the page loading process
The Network panel also received a noticeable update. Now you can see in it a strip made in the form of a film, the frames from which are screenshots of the page rendering process. When you click on any frame, you will be moved to the appropriate place on the resource load display panel.
View screencast
36. Sublime Text: fuzzy search using GOTO functionality
If you are using Sublime Text, then using the shortcut CMD + P ( Ctrl + P for Windows) you will start the search for entities in your code. For example, if you type in the search
@fn in relation to the js-file, then you will find all such functions.Also use the prefix
# , which starts a fuzzy search. For example, to find the variable track_to_play , you just need to write #ttp .View screencast
37. Quickly change the value of CSS properties using the keyboard and mouse wheel
To increase or decrease the numeric value of a CSS property, use:
- Arrows ↑ / ↓ to change the value to 1 .
- Shift + ↑ / ↓ to change the value by 10 .
- Alt + ↑ / ↓ to change the value by 0.1 .
- You can also very easily change the value with the mouse wheel.
View screencast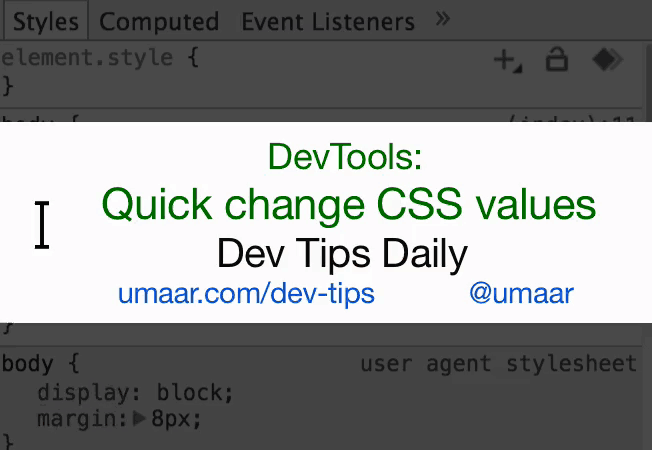
38. Scrolling an item in scope
When the DOM element of interest to you is outside the visible limits of the page, you can bring it back into view by using the “Scroll into view” command from the context menu of the required element in the Elements panel.
It is also useful to remember that when you hover over a DOM element, a small tooltip appears on the page, showing the size and position of the block.
View screencast
39. Node.js: Using Babel to Run ES6
You can try the ES6 features in the terminal as follows:
- Globally install babel npm package
npm install -g babel - Create a new
sum.jsfileconst sum = arr => arr.reduce((a, b) => a + b); console.log( 'sum: ', sum([1, 2, 3]) ); - Run the code with:
babel-node sum.js
babel-node with no arguments in REPL mode (Read-eval-print loop) to launch Javascript on the fly. You can integrate this functionality into your existing project using packages for Gulp or Grunt collectors.View screencast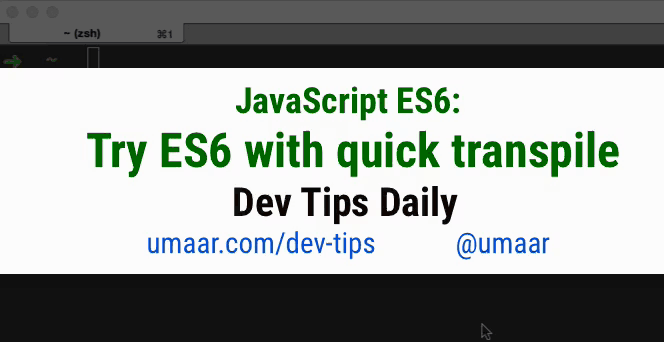
40. Transition to viewing and editing CSS or Javascript files from the Elements panel
Now CSS and JS-resources displayed in the Elements panel can be opened directly in the Sources panel with the ability to fully edit. To do this, select “Open” in the context menu of the corresponding file.
View screencast
41. Javascript variable values displayed next to the code in the debugging process
In the updated debug mode, you can view the values of variables literally next to the executable code. This even works for minified scripts after you format them.
To enable this functionality (if it is not enabled by default), do the following:
- Open the developer tool settings.
- Enable the checkbox General → Sources → Display variable values inline while debugging .
View screencast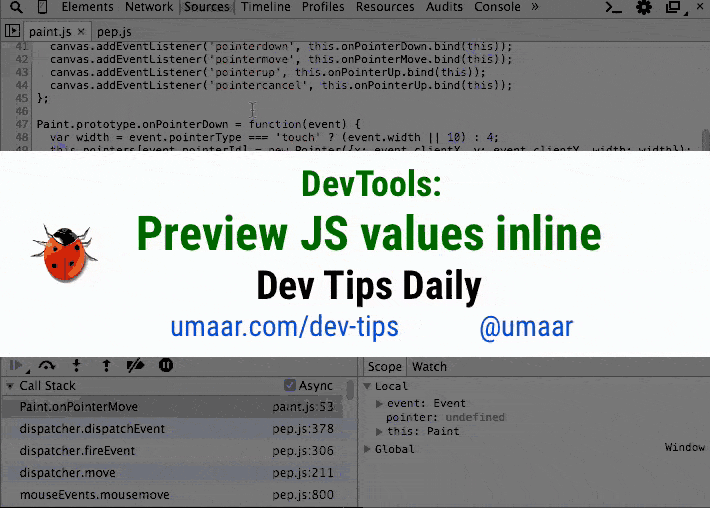
42. Use color grouping in the Network panel to simplify resource type identification.
To quickly find the necessary resources by type in the “Network” panel, use the “Color-code resource typesColor-code resource types” functionality. To enable this functionality, do the following:
- Open the developer tool settings.
- Enable the checkbox General → Network → Color-code resource types .
Each type of resource (script, style sheet, document, font, etc.) will be painted in its own color. Now you can quickly understand which resource you are looking at, without having to read the file name.
View screencast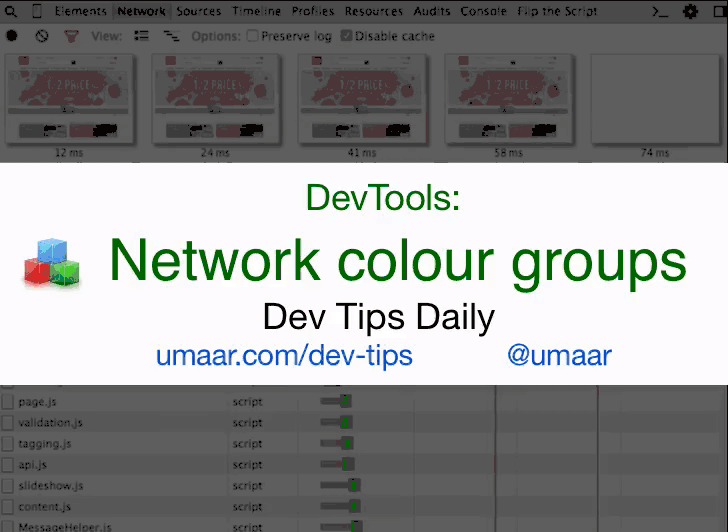
43. Activating pseudo DOM element classes
You can activate pseudo-classes of elements in the Elements panel, such as:
:hover:active:focus:visited
With such a change in the state of the element, an orange indicator will appear to its left.
View screencast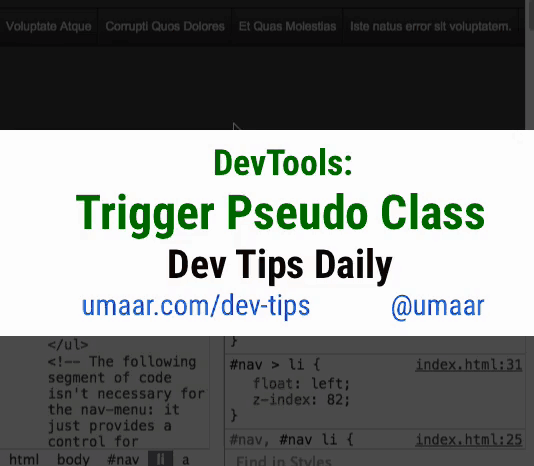
44. Inspecting the developer tools themselves.
Unpin the developer tools tab and press Cmd + Alt + I. A new window will open in which you can inspect the original tool window.
This can be useful, for example, when creating a new skin for DevTools.
View screencast
45. Run selected block of code from the panel “Sources”
You can check the code snippet selected in the Sources panel by running it in the console using the shortcut Ctrl + Shift + E. The code will run in the current context.
View screencast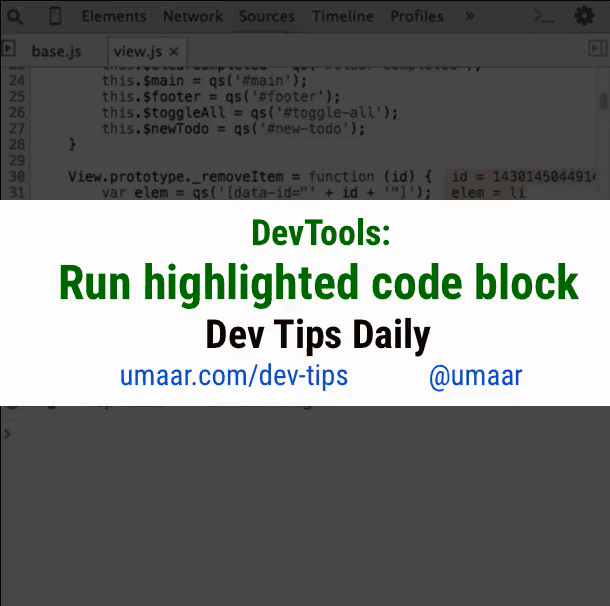
46. Setting conditional breakpoints
By setting a breakpoint, you can make it conditional - dependent on the execution of some expression. To do this, select “Add Conditional Breakpoint” in the context menu of the line in the “Sources” panel and enter an expression.
View screencast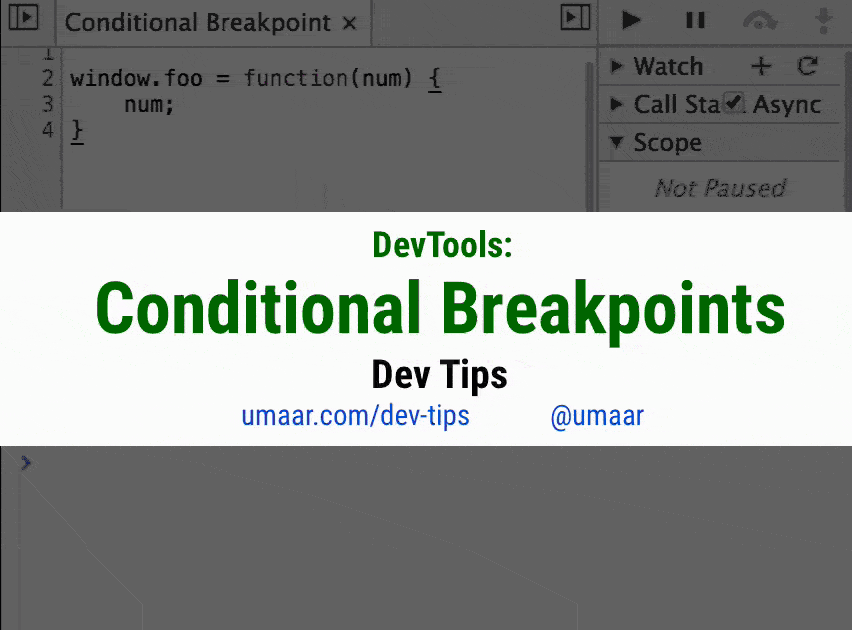
47. Go to the next occurrence of the selected string using hotkeys.
You can move to the next occurrence of the selected line using the shortcut Cmd + D. If you didn’t accidentally choose what you wanted, use Cmd + U to deselect.
View screencast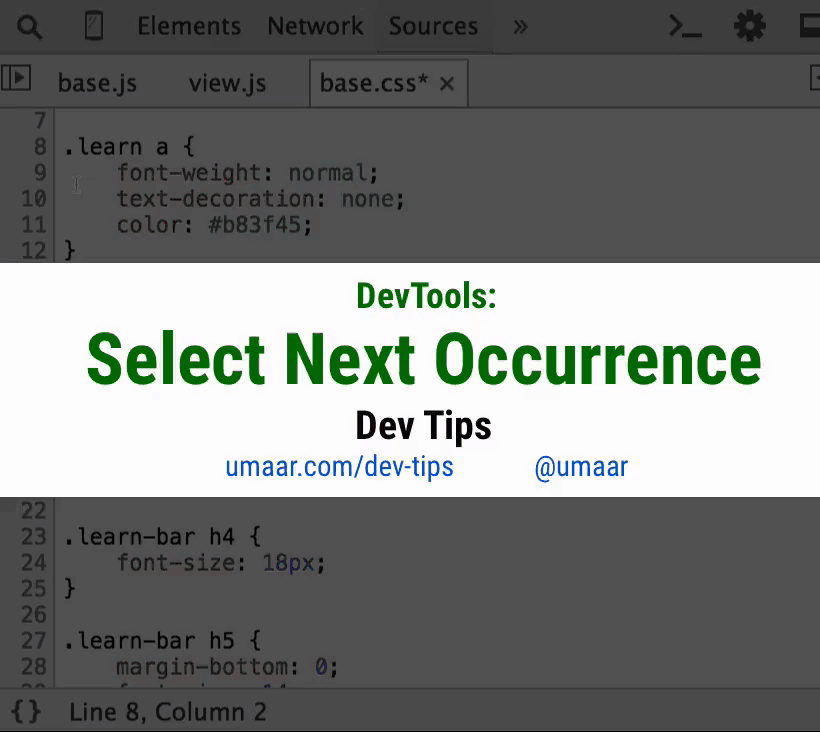
48. Editing a CSS file in the “Sources” panel and simplifying the change of CSS property values
You can edit the CSS file in the Sources panel directly, with the changes applied immediately, no need to save the file. Also use Alt + ↑ / ↓ to change the numeric values of the CSS properties.
View screencast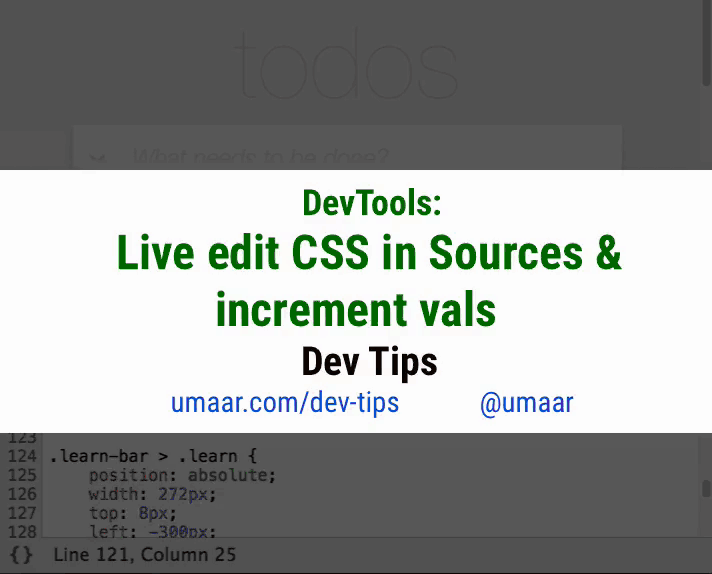
Stay tuned! Soon there will be the following parts.
Source: https://habr.com/ru/post/275425/
All Articles