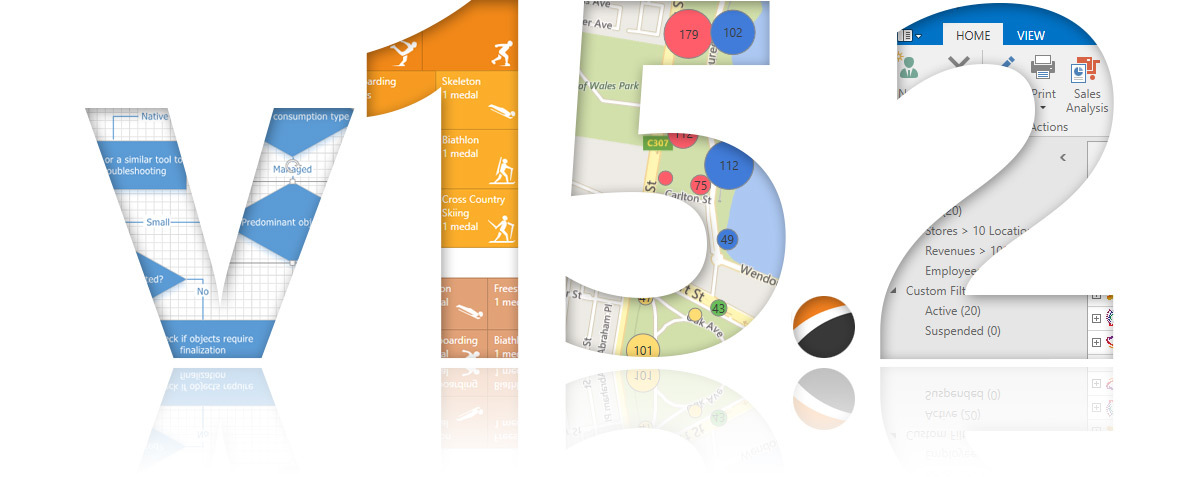
Release of components DevExpress .NET, HTML5 / JS and VCL v2015.2
Hello!
The year 2015 is nearing its end and we want to wish all the developers of Russia (and the whole world, what a thing!) Merry New Year mood, harmony in all your endeavors, and so that everything that you haven’t yet done - surely would have happened next year!
And here, for example, this year we managed to release a new version of components for .NET, HTML / JavaScript and VCL, and if you use our products in your work and follow their development, then welcome to cat.
')
For those who prefer video to text, we have prepared a small video review of all the major new products:
So, what's new in version 15.2:
New Diagram components for WinForms and WPF allow you to visually display complex information using hierarchical diagrams and flowcharts. The main features of these components are:

In this release, a new opportunity to create reports based on our WinForms-component GridControl. Now, with just a couple of lines of code, you can call up the Report Designer, made on the basis of the Grid Control, and create a report using its data.
The new TreeMap component for the WPF platform will allow you to visualize tabular or hierarchically structured data as nested rectangles, whose size depends on the displayed value. This control comes with the following built-in capabilities:

Our new Camera component for WPF allows you to display a video stream from a webcam, as well as take photos with it. The built-in settings mechanism allows you to change various camera parameters (brightness, contrast, etc.), as well as select the desired camera in case several devices are available at once.
Also in this release, we have new themes for WinForms and WPF applications: Office 2016 Black, Office 2016 White and Office 2016 Colorful.
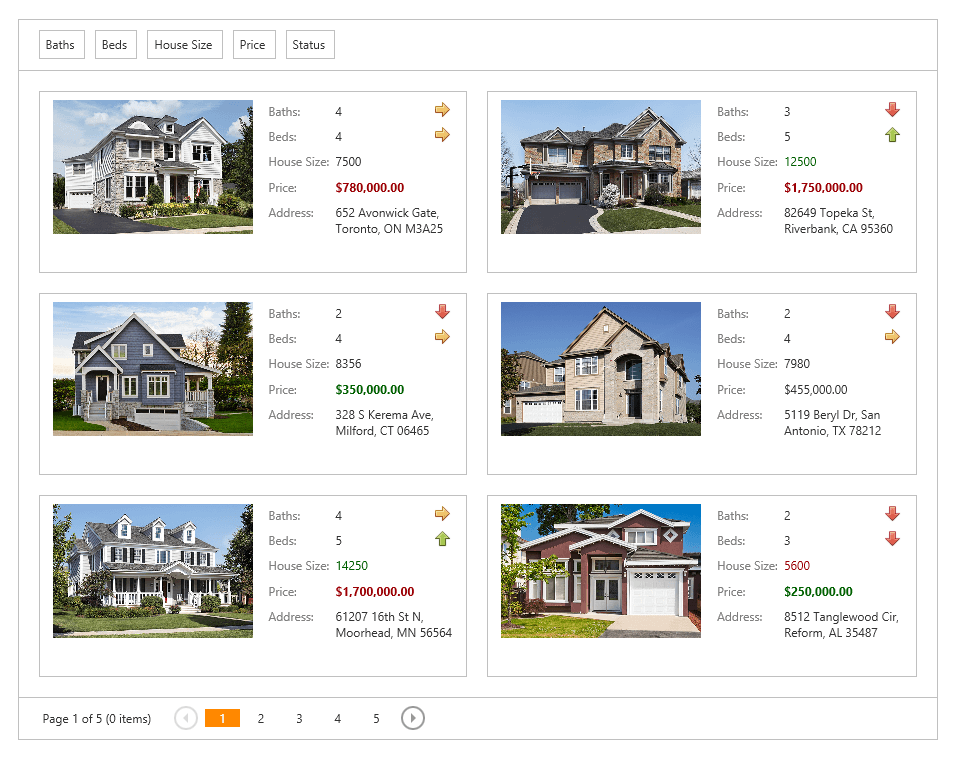
New features added to DevExpress ASP.NET CardView Control, which was introduced earlier this year as CTP, and now has received an official release:
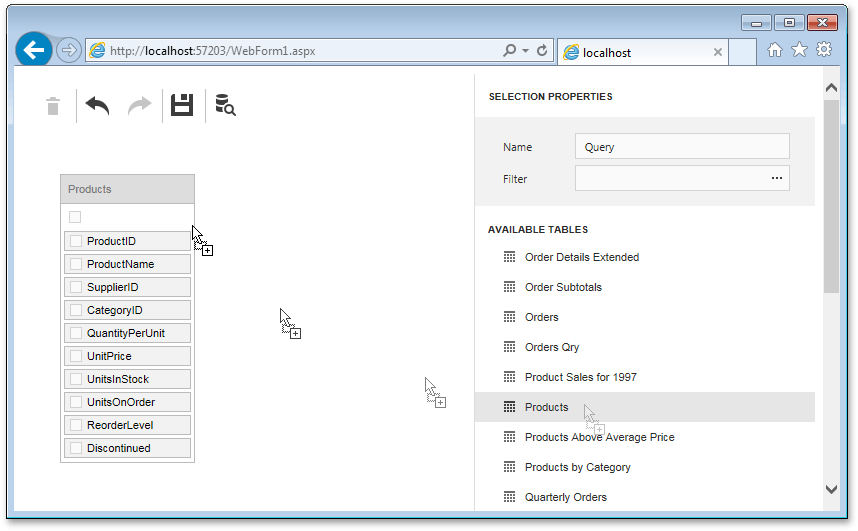
New control DevExpress ASP.NET Query Builder - allows you to create SQL queries visually and returns a text string containing the SELECT statement.
Features:
In this release, we have made a new ExcelDataSource component that allows you to use Microsoft Excel files or CSV as a data source for many of our .NET components.
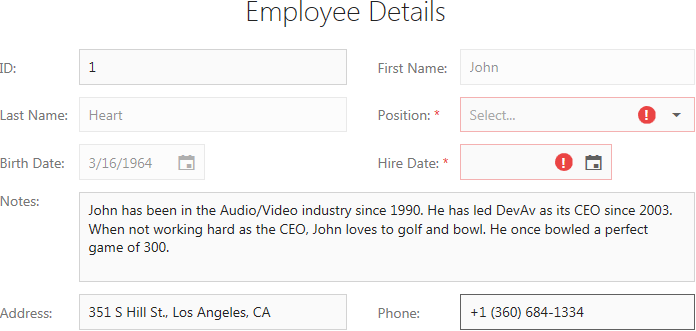
The new widget for version 15.2 is the Form Layout Widget, which allows you to edit the current record from a data source. This widget can arrange the input fields of values in accordance with the fields in the data itself, and in any order at the discretion of the developer. In this case, the input fields of values can be grouped, divided into sections and divided into columns, that is, they can be given any markup on the form. It is also available to check the values entered by the user into these fields according to certain specified validation rules.
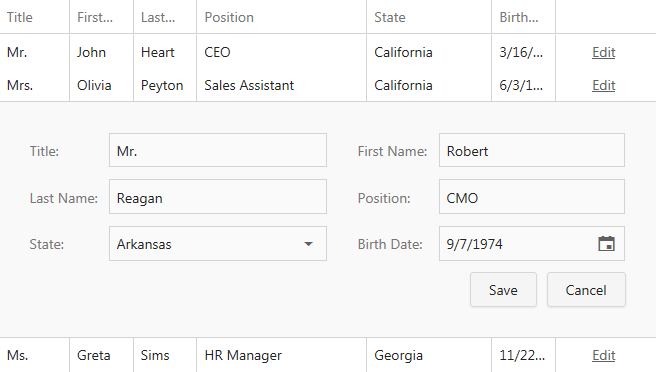
Very often, when viewing data in a table, you need to either fill in new lines or edit existing ones. In this release, it has become much more convenient thanks to a special input form that the developer can customize for any scenario. Different number of fields and sections with different data types, lists and dates, grouping of fields, as well as verification of entered values - in this form you can create any template required for the user.
For HTML5 Scheduler in this release, you can now customize both the data entry form and the tooltip for events. We also took care of compatibility with mobile devices, adapting the user interface to work with a small screen size, as well as with touch-events. Now you can place events horizontally with the help of new Timeline Views, which cover three time intervals: a day, a week and a work week.
In this version, the core of the data calculation in memory has been completely rewritten. Our tests showed an increase in the performance of typical data analysis operations (grouping, sorting, aggregation) up to 50 times compared with version 15.1, with a more than 20-fold decrease in memory consumption. This result was achieved due to data compression using dictionaries, aggregation using hash tables and performing calculations in several streams. Also, memory overruns when loading data due to boxing was eliminated.
If there is still too much data, now it has become possible in the designer to disable automatic updating and loading of data. This will allow not to wait until the end of the recalculation of data with each change during the design of the deshbord.
There is a new type of chart - scatter chart (scatter chart), which allows you to show the presence or absence of correlation between several numerical values:
Conditional formatting settings for tables and summary tables (Grid and PivotGrid) were supplemented with histograms (bar) with the ability to specify the color of an individual bar depending on a condition. Also, for all tables, it is possible to manage summary values.
The collection of additional modules received a replenishment in the face of the Maps module, designed to display business objects on a raster or vector map in web applications. This module is based on our dxMap and dxVectorMap widgets .
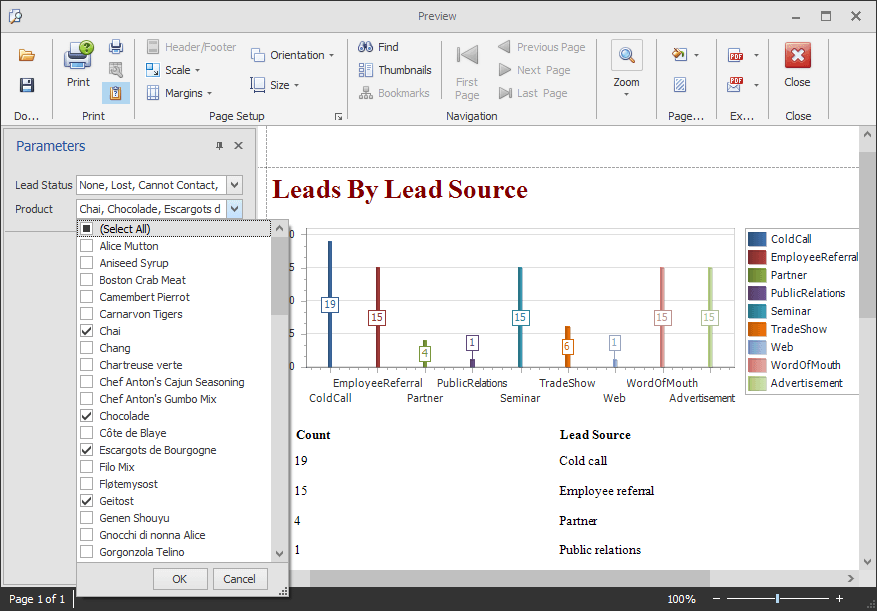
Reports module has received a number of improvements - HTML5 Document Viewer control integration for viewing reports, rendering acceleration due to XML markup storage , support for multiple selection for parameters of complex types.
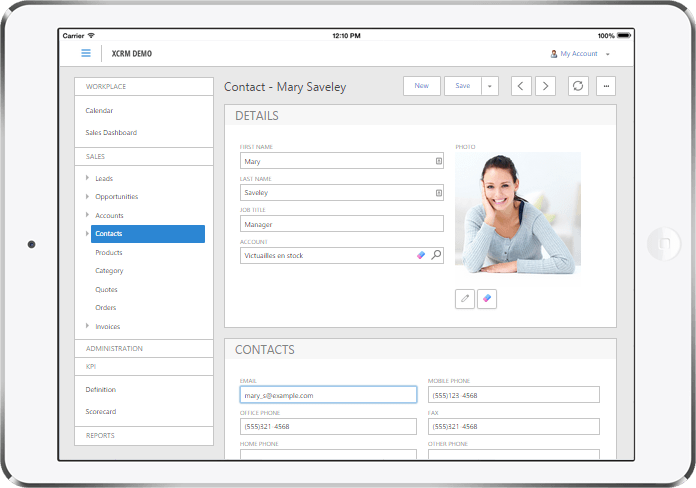
In the last release, we showed a rather raw preview of the new XAF web theme optimized for touch devices. We have done a lot of work to improve the web UI, and now you can use the new XAF style in your “combat” applications.
Users of web applications can now more conveniently work with data in the grid, since there is a built-in support for batch data modification, master-detail mode, and adaptive column layout .

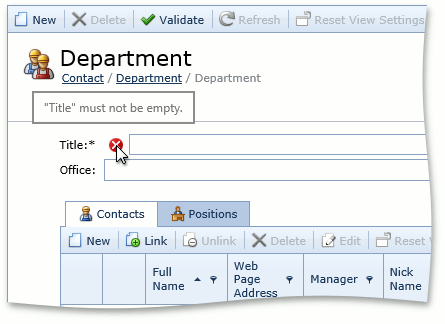
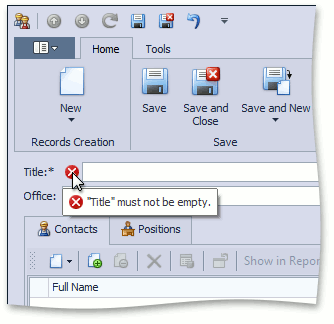
The validation rules now work on the client side (in those cases where the calculation of the rule does not require requesting additional data from the server). Accordingly, the user sees a warning immediately after changing the input focus, and not during the final saving of changes.
The location of the fields in the detailed form can now be set directly in the code of the business object, without opening the designer. To do this, use the new attribute DetailViewLayout .
In this release, we have a new navigation component, Office Navigation Bar, which can integrate with our NavBar component and help you completely recreate the user interface of Outlook 2013.
Sparklines are used to display visual information in compressed form, which allows you to quickly see the trend and compare data in different cells. In this release in the VCL platform, we added two new components - Sparkline Editor and Sparkline Lookup, which can be used in two different scenarios: separately (either linked to or without a data source) or inside other components, such as Grid, Tree List, Pivot Grid or Vertical Grid.
A full version with a detailed description of all the new products is available on our website in the What's New in 2015 section.
The year 2015 is nearing its end and we want to wish all the developers of Russia (and the whole world, what a thing!) Merry New Year mood, harmony in all your endeavors, and so that everything that you haven’t yet done - surely would have happened next year!
And here, for example, this year we managed to release a new version of components for .NET, HTML / JavaScript and VCL, and if you use our products in your work and follow their development, then welcome to cat.
')
For those who prefer video to text, we have prepared a small video review of all the major new products:
So, what's new in version 15.2:
Diagram Components for WinForms and WPF
New Diagram components for WinForms and WPF allow you to visually display complex information using hierarchical diagrams and flowcharts. The main features of these components are:
- More than 110 different figures, including both the main elements and the elements of flowcharts and SDL diagrams.
- Chart themes similar to those found in Visio: Office, Linear, Integral, Daybreak, Parallel, Sequence and Lines. And also the ability to create your own themes.
- Connectors (straight, curved and rectangular)
- 15 preset styles for connecting arrows
- Automatic compilation of paths for connectors using the A * algorithm
- Automatic placement of figures
- End User Chart Editor
- Ability to save / load charts
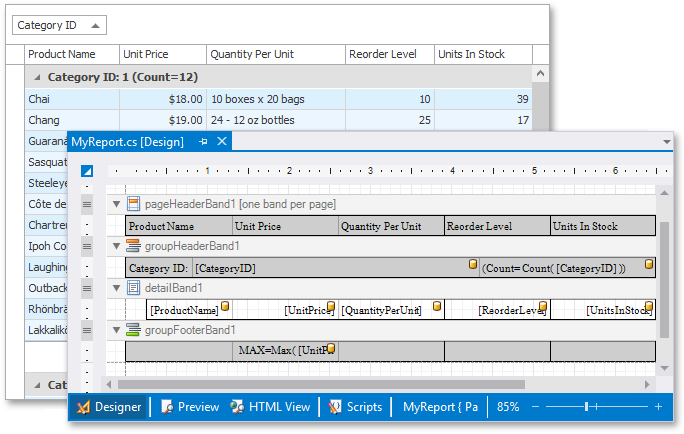
WinForms - Generating reports based on the Grid component
In this release, a new opportunity to create reports based on our WinForms-component GridControl. Now, with just a couple of lines of code, you can call up the Report Designer, made on the basis of the Grid Control, and create a report using its data.
WPF - TreeMap Component
The new TreeMap component for the WPF platform will allow you to visualize tabular or hierarchically structured data as nested rectangles, whose size depends on the displayed value. This control comes with the following built-in capabilities:
- Several algorithms for calculating the size and position of elements: "Slice and Dice", "Squarified", "Striped"
- The ability to visualize flat (tabular) and hierarchically structured data.
- The ability to automatically set colors to elements using one of the following methods: element by element using a gradient, by groups using a gradient, by palette, depending on the value of the element.
- Interactivity: highlighting elements when you hover the cursor and the ability to select items by clicking and programmatically.
- Flexible customization of the TreeMap.
- Customizable tooltips.
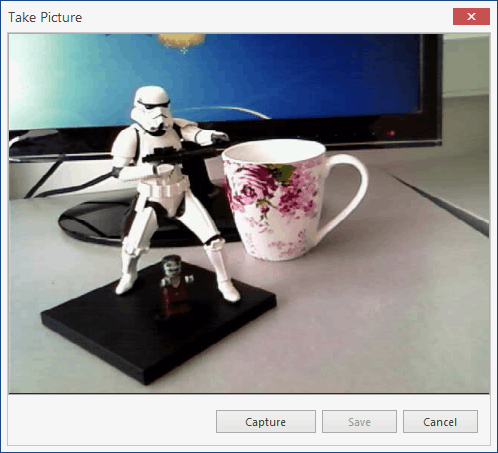
WPF - Camera Component
Our new Camera component for WPF allows you to display a video stream from a webcam, as well as take photos with it. The built-in settings mechanism allows you to change various camera parameters (brightness, contrast, etc.), as well as select the desired camera in case several devices are available at once.
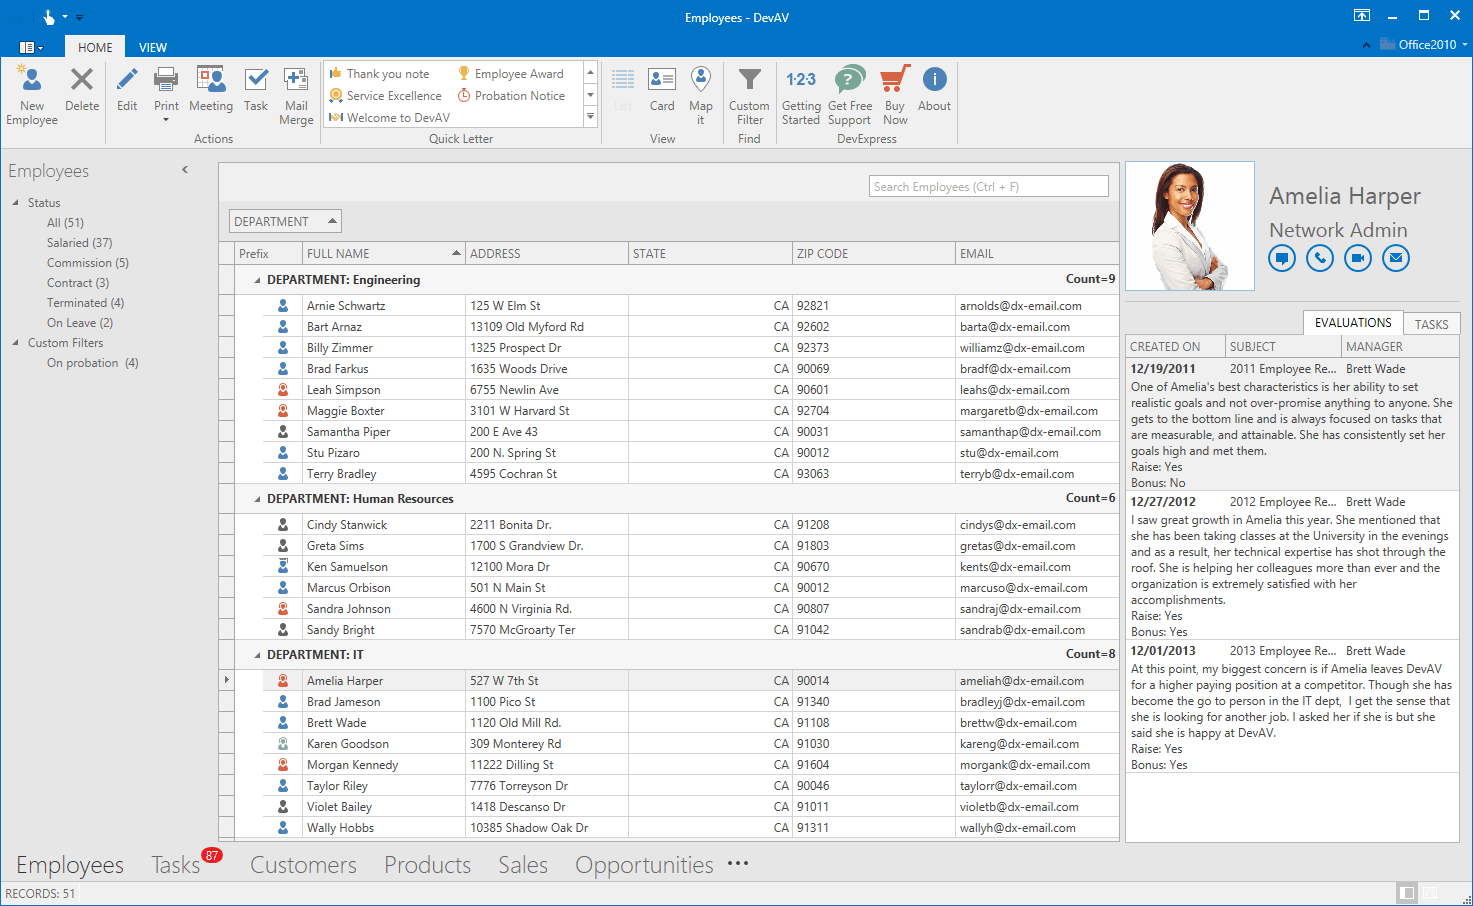
WinForms and WPF - Office 2016 Themes
Also in this release, we have new themes for WinForms and WPF applications: Office 2016 Black, Office 2016 White and Office 2016 Colorful.
ASP.NET - CardView and Query Builder Components
New features added to DevExpress ASP.NET CardView Control, which was introduced earlier this year as CTP, and now has received an official release:
- Batch Editing (batch change data)
- Conditional Formatting (conditional formatting of cells)
- Export to PDF, XLS, XLSX and RTF
- Export selected records
- Export with conditional formatting
- Card Headers Panel
- Total Summary
- Endless Paging (endless paging)
- Date Range Filtering
- Dot display with tooltip in the cut cell text
- Design-Time Card Layout Editor (a special design-time editor that makes it easy to create and change the layout of cards)
New control DevExpress ASP.NET Query Builder - allows you to create SQL queries visually and returns a text string containing the SELECT statement.
Features:
- Automatic retrieval of the database schema and its presentation in the user interface.
- Visual editing of the WHERE, ORDER BY and GROUP BY clause clauses.
- Automatic resolution of inter-table links based on foreign keys.
- Preview query results.
Binding to data from Excel - on all .NET platforms
In this release, we have made a new ExcelDataSource component that allows you to use Microsoft Excel files or CSV as a data source for many of our .NET components.
HTML5 Form Layout Widget
The new widget for version 15.2 is the Form Layout Widget, which allows you to edit the current record from a data source. This widget can arrange the input fields of values in accordance with the fields in the data itself, and in any order at the discretion of the developer. In this case, the input fields of values can be grouped, divided into sections and divided into columns, that is, they can be given any markup on the form. It is also available to check the values entered by the user into these fields according to certain specified validation rules.
HTML5 Grid - Edit Form
Very often, when viewing data in a table, you need to either fill in new lines or edit existing ones. In this release, it has become much more convenient thanks to a special input form that the developer can customize for any scenario. Different number of fields and sections with different data types, lists and dates, grouping of fields, as well as verification of entered values - in this form you can create any template required for the user.
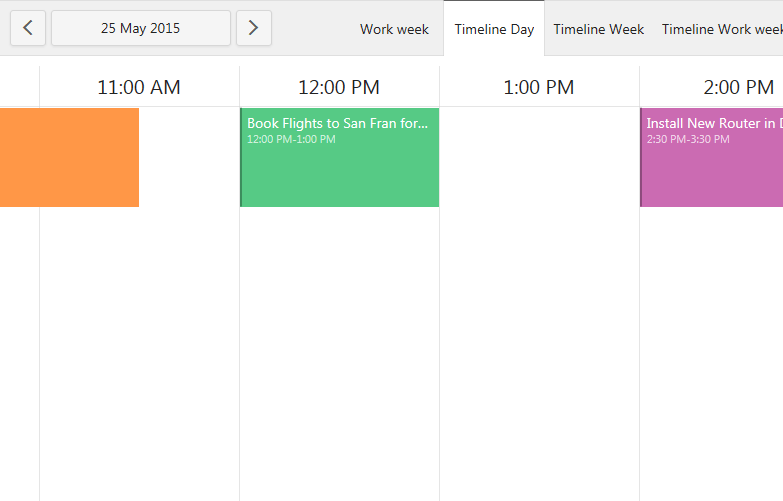
HTML5 Scheduler - Timeline View and Mobile UI
For HTML5 Scheduler in this release, you can now customize both the data entry form and the tooltip for events. We also took care of compatibility with mobile devices, adapting the user interface to work with a small screen size, as well as with touch-events. Now you can place events horizontally with the help of new Timeline Views, which cover three time intervals: a day, a week and a work week.
Dashboards - Increased speed and usability with large amounts of data in memory.
In this version, the core of the data calculation in memory has been completely rewritten. Our tests showed an increase in the performance of typical data analysis operations (grouping, sorting, aggregation) up to 50 times compared with version 15.1, with a more than 20-fold decrease in memory consumption. This result was achieved due to data compression using dictionaries, aggregation using hash tables and performing calculations in several streams. Also, memory overruns when loading data due to boxing was eliminated.
If there is still too much data, now it has become possible in the designer to disable automatic updating and loading of data. This will allow not to wait until the end of the recalculation of data with each change during the design of the deshbord.
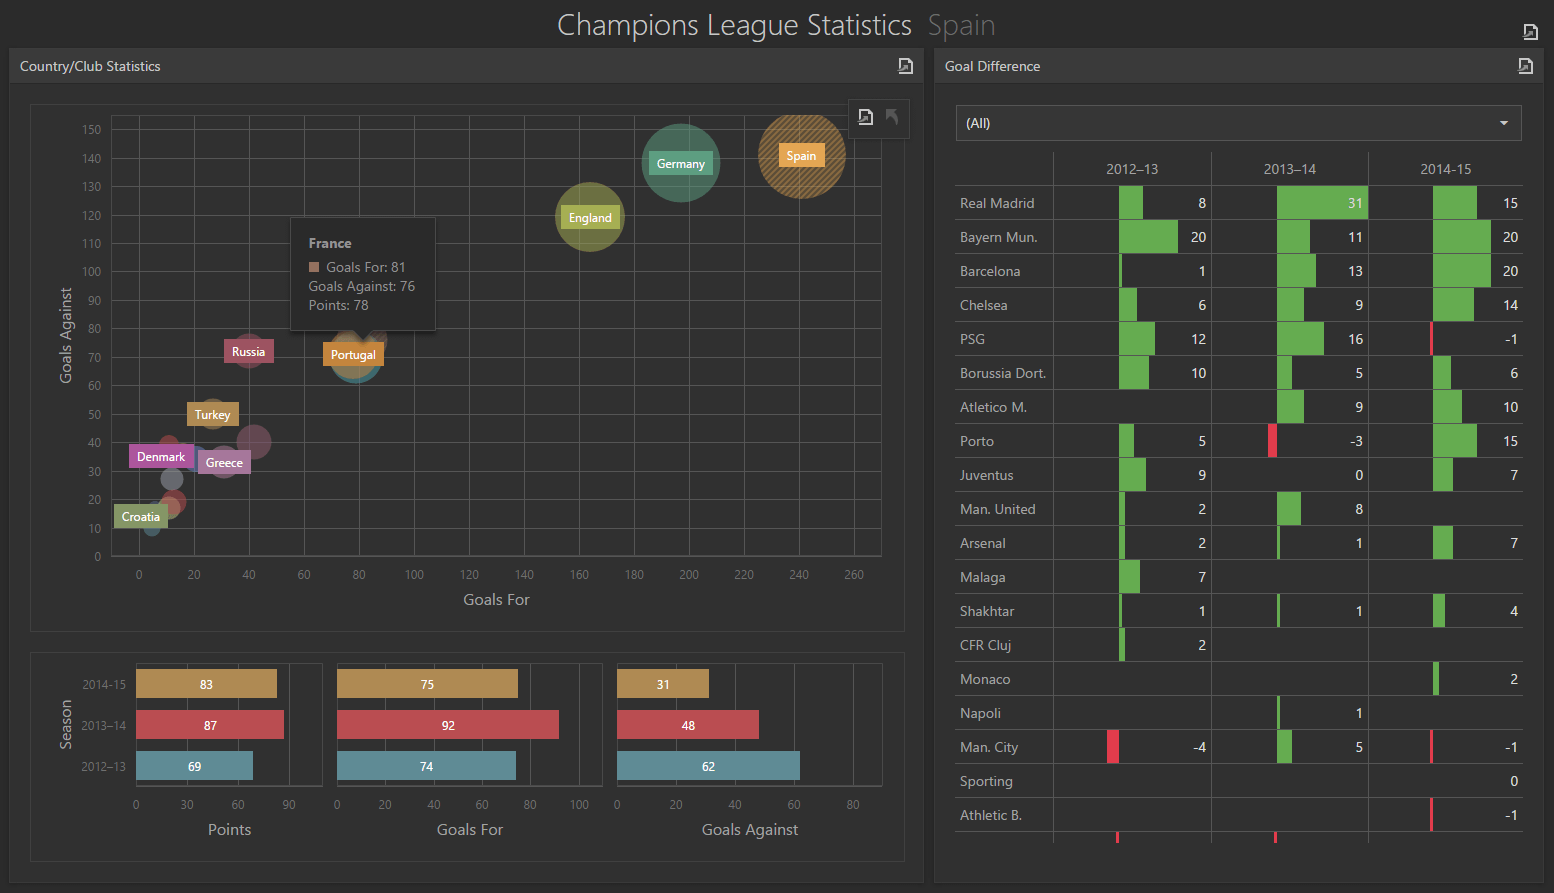
Dashboards - New Item - Scatter Chart
There is a new type of chart - scatter chart (scatter chart), which allows you to show the presence or absence of correlation between several numerical values:
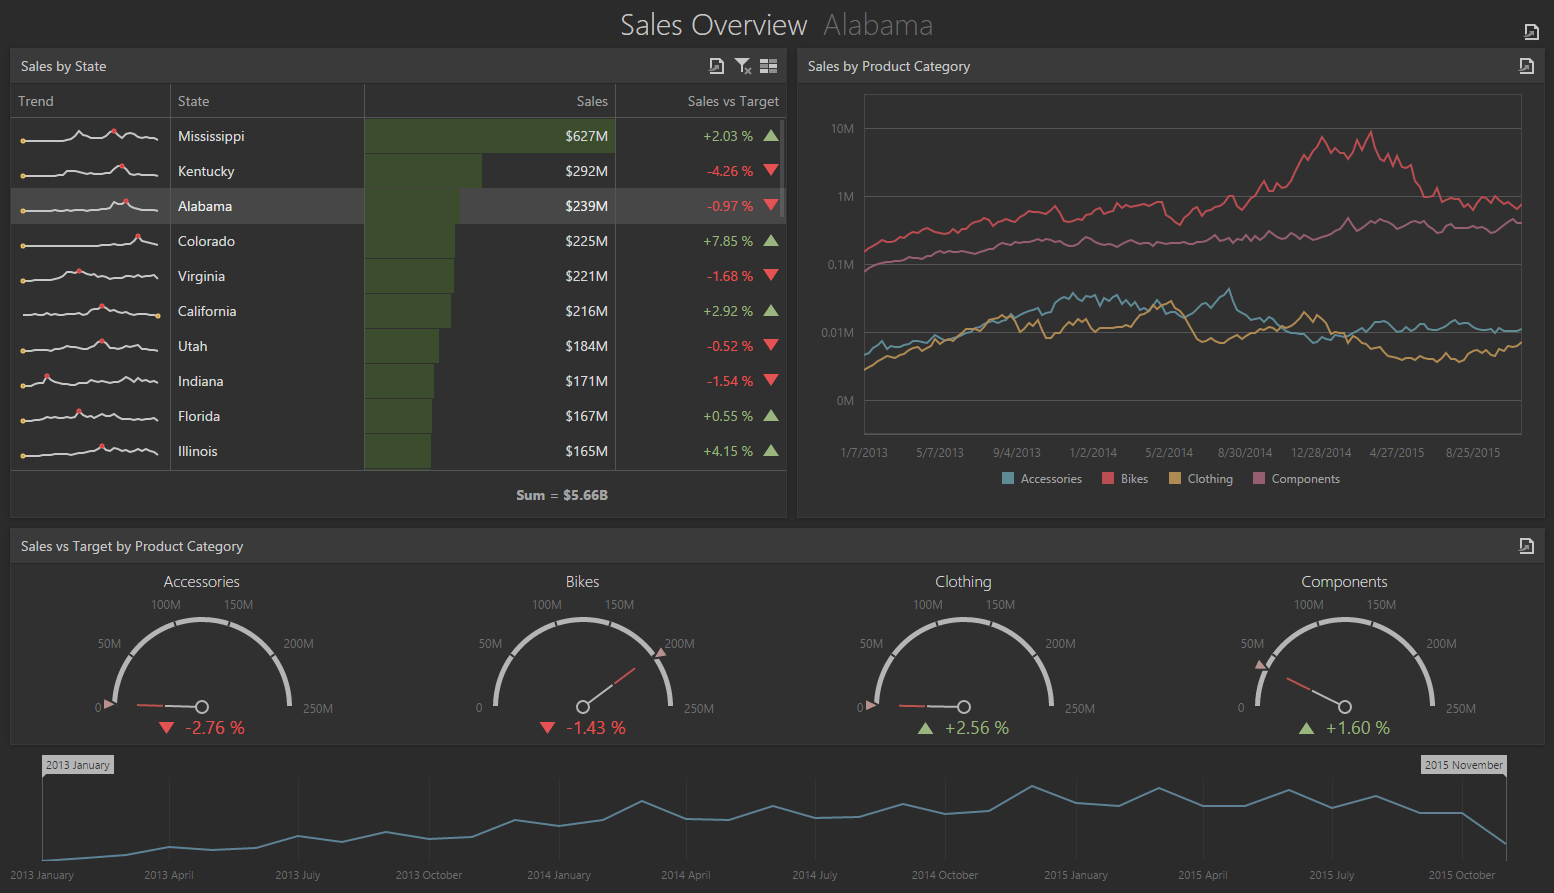
Dashboards - Conditional Formatting - Histograms
Conditional formatting settings for tables and summary tables (Grid and PivotGrid) were supplemented with histograms (bar) with the ability to specify the color of an individual bar depending on a condition. Also, for all tables, it is possible to manage summary values.
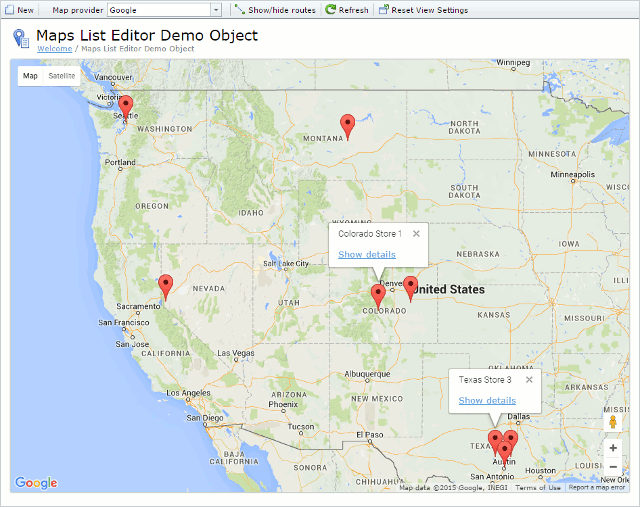
eXpressApp Framework (XAF)
The collection of additional modules received a replenishment in the face of the Maps module, designed to display business objects on a raster or vector map in web applications. This module is based on our dxMap and dxVectorMap widgets .
Reports module has received a number of improvements - HTML5 Document Viewer control integration for viewing reports, rendering acceleration due to XML markup storage , support for multiple selection for parameters of complex types.
In the last release, we showed a rather raw preview of the new XAF web theme optimized for touch devices. We have done a lot of work to improve the web UI, and now you can use the new XAF style in your “combat” applications.
Users of web applications can now more conveniently work with data in the grid, since there is a built-in support for batch data modification, master-detail mode, and adaptive column layout .
The validation rules now work on the client side (in those cases where the calculation of the rule does not require requesting additional data from the server). Accordingly, the user sees a warning immediately after changing the input focus, and not during the final saving of changes.
The location of the fields in the detailed form can now be set directly in the code of the business object, without opening the designer. To do this, use the new attribute DetailViewLayout .
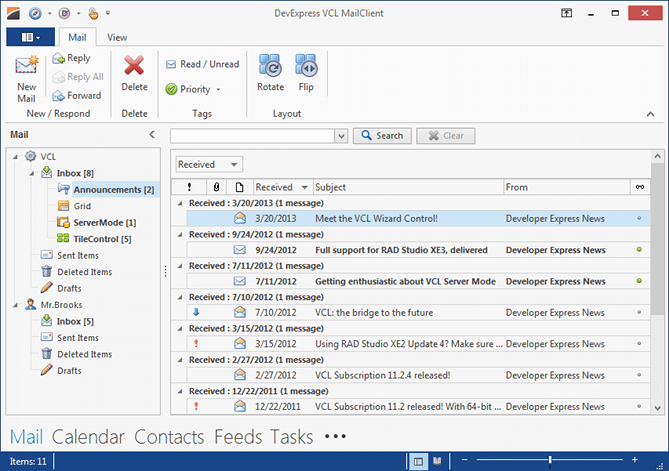
VCL - Office Navigation Bar
In this release, we have a new navigation component, Office Navigation Bar, which can integrate with our NavBar component and help you completely recreate the user interface of Outlook 2013.
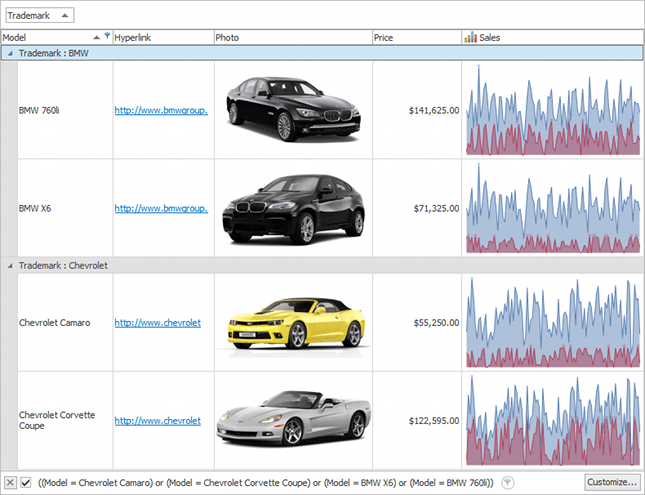
VCL - Sparkline Editor and Sparkline Lookup
Sparklines are used to display visual information in compressed form, which allows you to quickly see the trend and compare data in different cells. In this release in the VCL platform, we added two new components - Sparkline Editor and Sparkline Lookup, which can be used in two different scenarios: separately (either linked to or without a data source) or inside other components, such as Grid, Tree List, Pivot Grid or Vertical Grid.
A full version with a detailed description of all the new products is available on our website in the What's New in 2015 section.
Source: https://habr.com/ru/post/274275/
All Articles