Security Scanners: Automatic Vulnerability Classification
The growing number of threats is forcing developers of security analysis tools to constantly improve their solutions. Now on the information security market there is a wide range of security scanners from different manufacturers, which differ in their effectiveness. This makes it impossible to release new versions of scanners without a competitive analysis of similar products.
Positive Technologies has developed its own competitive analysis methodology for testing and comparing scanners according to objective criteria, such as the types and number of vulnerabilities found, the completeness of scanning various targets. In addition, a database of competitive analysis was created (DBCA - Database of Competitive Analysis), which collected unique vulnerabilities found in the process of manual checks and automatic scanning of synthetic targets, real sites, CMS, web applications and other information systems by security scanners ( WebEngine - built-in PT AF and PT AI , Acunetix , AppScan , etc.). DBCA is used to compare the results of scanning with new versions of Positive Technologies scanners with the results of third-party scanners and screening false positives (false positive).
')
However, filling a DBCA requires months of manual labor by highly qualified testing engineers. The process of setting up environments and scanning takes a lot of time, sometimes weeks. Validation of found vulnerabilities takes place even longer. So, three engineers of the QA department worked on filling out the current base for a year. In this regard, the need to accelerate and automate the work.
The solution was the use of the mathematical apparatus of neural networks (NA) and fuzzy measuring scales. We wrote about this in detail in the previous article “ Security Scanners: Automatic Validation of Vulnerabilities Using Fuzzy Sets and Neural Networks ”. Theoretical studies have become the basis of a practical experiment set by Positive Technologies engineers: Timur Gilmullin, Vladimir Sofin, Artem Yushkovsky.
The formal task of transforming the DBCA into a knowledge base was solved by using the NA (as a decisive rule) and fuzzy measuring scales (for linguistic evaluation of the classification results in a form understandable to man). Practically, DBCA was supplemented by rules and mechanisms for screening out false positives, pre-sorted according to the degree of confidence in their presence, assessed on a fuzzy measuring scale. This allowed us to speed up the work of testers in analyzing the results of scanning and screening out false positives.
Retrospective, acceptance criteria and main results
After completion of the initial filling of DBCA vulnerabilities, the database contained several tens of thousands of vulnerabilities. Of these, testing engineers classified only about half during the year. The results of our analysis showed that they performed up to 70% of unnecessary actions to screen out false positives for the entire scope of work.
With regular competitive analysis, the use of an automatic system for validating vulnerabilities gives a huge performance increase and increases the efficiency of manual labor - you can reduce up to 70% of the amount of work required! In addition, the use of the automatic system will free engineers for other priority tasks, which will increase the number of scanners participating in the competitive analysis and the number of scanned CMS.
From the testing side, the following acceptance criteria and performance requirements were obtained:
- The main criterion: after the introduction of an automated system for validating vulnerabilities, the number of false rejections (false rejects) should not exceed 10% of the total number of processed vulnerabilities.
- A new algorithm for confirming vulnerabilities will increase the number of confirmed vulnerabilities (confirmed) and reduce the number of slightly different from standard vulnerabilities (semi-confirmed) by at least 5-10%.
- The new algorithm for confirming vulnerabilities will give fewer errors than a simple algorithm that testing engineers already have, by at least 10%.
- An automatic vulnerability validation system will be introduced into the competitive analysis process.
During the experiment, engineers have developed:
- Vulnerability coding matrix. These are the rules for converting data about vulnerabilities and representing their properties in the form of a numeric or fuzzy vector. Such a matrix is unique for each specific subject area and problem to be solved.
- Software scripts for obtaining data from DBCA, presented in XML format.
- Software scripts for encoding obtained data on vulnerabilities in the form of numeric or fuzzy vectors (stored in text files of a specific format), according to the encoding matrix. These files are used when training the neural network.
- A trained neural network for the task of classifying vulnerabilities with additional training and retraining, in the XML format of the FuzzyClassificator program.
- Adapted to solve the task, the FuzzyClassificator scripts implement all stages of working with the neural network, including its creation, training and the stage of classification of a trained neural network.
- Mechanisms to manage all the validation processes for vulnerabilities based on the continuous integration system TeamCity.
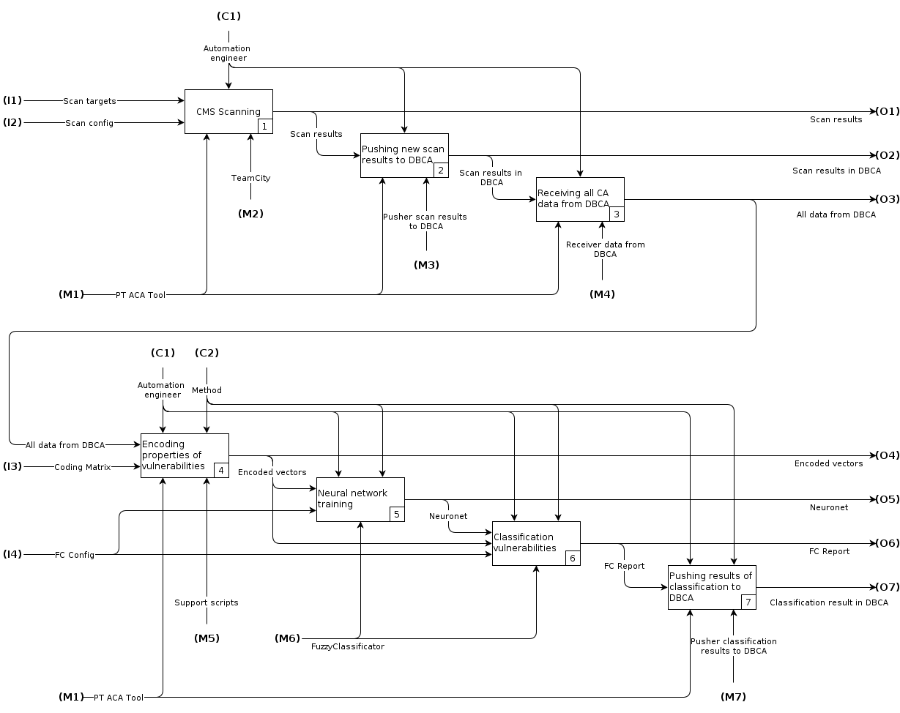
Functional Vulnerability Classification Scheme
The whole complex of process automation for the classification of vulnerabilities was described by the functional IDEF0 scheme.
Fig. 1 Functional IDEF0 Diagram
The diagram reflects the main stages of the classification of vulnerabilities:
- CMS scan.
- Recording results in DBCA.
- Retrieving all data from DBCA, including previously found vulnerabilities and current scan results.
- Encoding vulnerabilities into numeric vectors in a format understood by the FuzzyClassificator program.
- NA training with FuzzyClassificator on early found vulnerabilities.
- Obtaining classification results for new vulnerabilities found in the current scan iteration.
- Publish results to DBCA.
Detailed descriptions of all elements of the functional scheme are given under the spoiler.
Elements of the functional diagram

A universal fuzzy measuring scale was used as measuring scales for assessing the properties of information systems (Fig. 2).
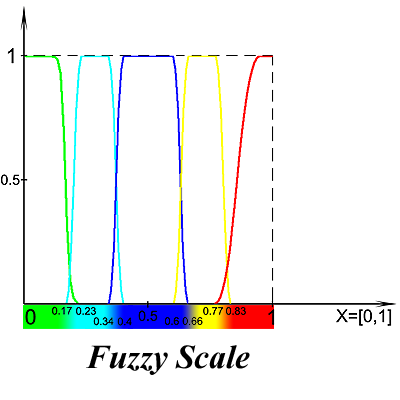
Fig. 2. Distribution of levels on a fuzzy universal scale
The fuzzy scale (FuzzyScale) is a set of ordered fuzzy variables, presented in the form of linguistic variables, describing some properties of an object:
FuzzyScale = {Min, Low, Med, High, Max}Here:
- Min is a fuzzy value meaning a minimal degree of confidence in something;
- Low is a slightly higher degree of confidence;
- Med is a moderate degree of confidence;
- High is a higher degree of confidence;
- Max is a fuzzy level, meaning the maximum degree of confidence in something.
Compared with other validation algorithms used vulnerabilities, which are based on a clear measuring scale, this approach helps to solve the problem of prioritizing vulnerabilities on a more human-understandable scale consisting of levels, which significantly reduces their further analysis.
Vulnerability properties coding matrix and its storage format
Any way to classify vulnerabilities involves coding, so one of the important steps in classifying vulnerabilities was encoding the input data. As the main element, we used the coding matrix of vulnerability properties (Coding Matrix). It is used to convert vulnerabilities received from the TFS database in XML format into a text DAT file of a special format that is fed to the input of the neural network of the FuzzyClassificator program. After constructing the matrix, writing scripts (support scripts) for encoding using a matrix is easy. Read more in the blog ( Input coding ).
For more effective training of the neural network, it was necessary to select the optimal matrix that describes the method of encoding the most significant properties of vulnerabilities supplied to the inputs of the neural network. The matrix was implemented using a simple JSON file.
Coding Matrix json-format:
{ "<PROPERTY_NAME_1>": { "values": { "unknown": 0, "<value_1>": 1, "<value_2>": 2, ..., <value_N>: N }, "comment": " , . PROPERTY_NAME - " }, ..., "<PROPERTY_NAME_M>": { "values": { "unknown": 0, "<value_1>": 1, "<value_2>": 2, ..., <value_K>: K }, "comment": " , : 0 ( ), 1, 2, ..." }, "<PROPERTY_NAME_X>": { "values": { "unknown": 0, "exists": 1 }, "comment": " , , (exists = 1) (unknown = 0) " } } Automating the classification of vulnerabilities in TeamCity
For the convenience of testers, the entire process, presented on the functional diagram, was automated in the system of integration TeamCity. The configuration part shown in fig. 3 illustrates an entry point for implementing blocks 4, 5, 6 (7) of the functional diagram.
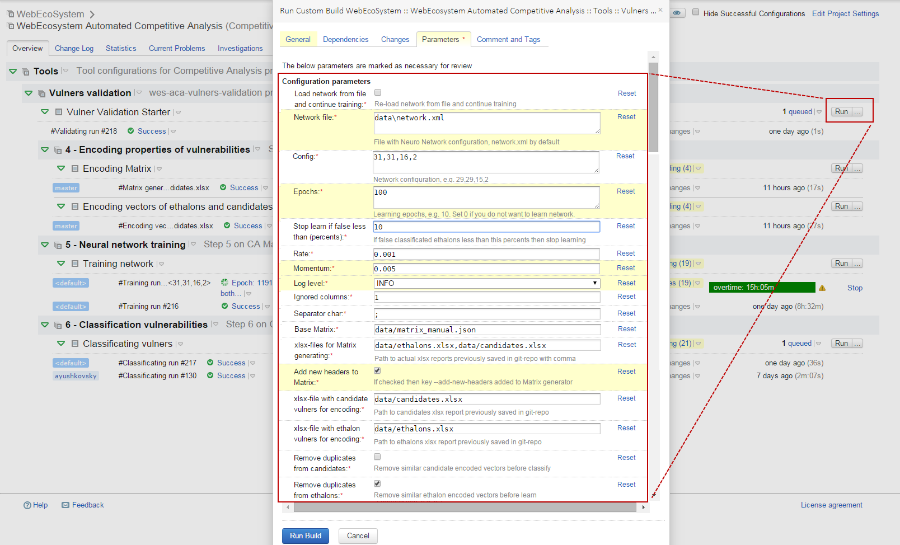
Fig. 3. Configuration in TeamCity, which launches the vulnerability classification process
After completing the vulnerability analysis process, TeamCity provides text files with reports on the classification of candidate vulnerabilities and statistics with an assessment of the quality of neural network training at the standards.
In addition, before obtaining the final results, it is possible to assess the quality of neural network learning by the errors that it gives out on the reference vectors. The training process takes place in a convenient format for the engineer: all the necessary information is displayed in the Training network configuration (see Fig. 4) in real time.
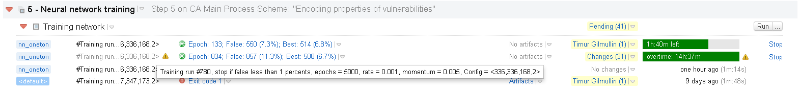
Fig. 4. Conclusion of intermediate results on the quality of training of neural networks
Parameters in fig. 4 reflect the main learning indicators on the reference vectors:
- Epoch - the current epoch of learning (or the last after graduation);
- False - the total number of erroneously classified reference vulnerabilities (rules for calculating statistics in training are given below);
- Best - the number of erroneously classified reference vulnerabilities for the best neural network in this training.
Report examples
For the convenience of interpreting the results, the statistics in all reports are divided into separate blocks, i.e., at the output, the tester gets a clear and detailed report. Under the spoiler are explanations for each unit.
Report blocks
In the Overview report header:
In the table Main statistics :
In the table of Neural network quality statistics (for ethalon vectors only) :
In the Classification Result table:
• Neuronet - the network used;
• Input file with encoded vectors - file with input data for training or classification (depending on the report);
• Network configuration - neural network configuration;
• Report legend - a description of fuzzy levels used to assess whether a vulnerability belongs to a class of confirmed or unproven vulnerabilities.
In the table Main statistics :
• Total classificated vectors' count - the number of processed vulnerabilities during classification;
• Allocation table of sorted levels vectors' count - a table of the distribution of the number of vectors of vulnerabilities among various fuzzy levels.
In the table of Neural network quality statistics (for ethalon vectors only) :
• False classificated vectors' count - the number of erroneously classified vulnerability vectors when training on standards, according to the rules for calculating statistics on the quality of training of a neural network (incomplete coincidence is counted as a correct result);
- a) False confirmed vectors' count - the number of vulnerability vectors for which only the Level Confirm level did not match the standard,
- b) False rejected vectors' count - the number of vectors of vulnerabilities in which only the Level Reject level did not match the standard,
- c) Both the number of vulnerabilities confirmed and rejected vectors' count - the number of vectors of vulnerabilities with which Level Confirm and Level Reject did not coincide with the standard at the same time;
• Allocation table of sorted levels levels false classificated vectors - the number of classification errors grouped by various fuzzy levels.
In the Classification Result table:
• TFSID - link to DBCA vulnerability;
• Level Confirm - the result of the classification of vulnerability by the neural network, showing the degree of confidence that the vulnerability is confirmed;
• Level Reject - the result of the classification of vulnerability by the neural network, showing the degree of confidence that the vulnerability is not confirmed;
• Interpreting as - how to interpret the result of the composition of two levels (Level Confirm, Level Reject), a clear final result of the classification:
- Confirmed - the neural network believes that vulnerability is more likely confirmed,
- Rejected - the neural network believes that vulnerability is more likely rejected,
- ERROR - classification error, which means that the neural network cannot unambiguously classify the vulnerability and requires manual validation.
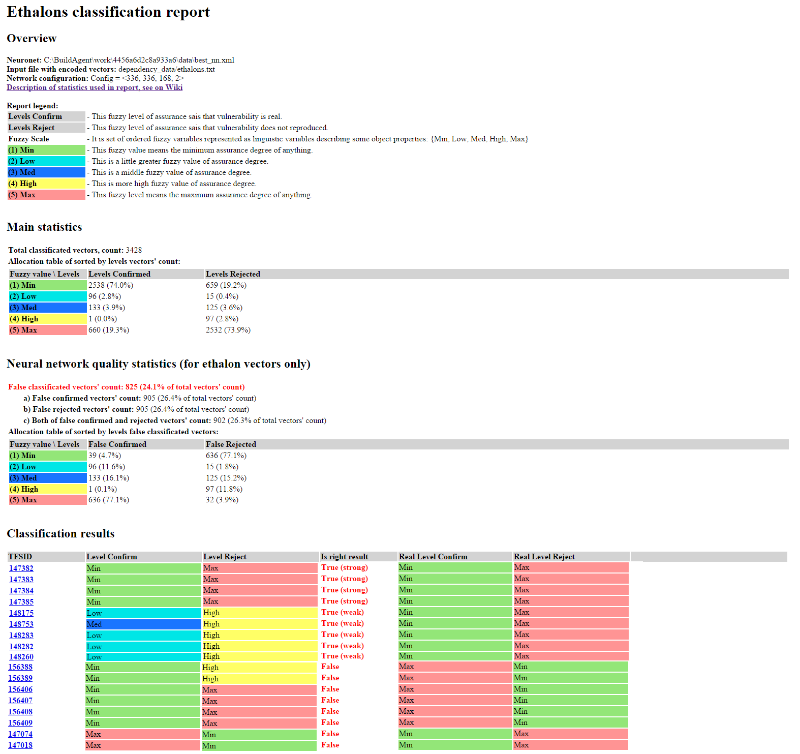
Fig. 5. An example of a report on the classification of standard vulnerabilities, containing statistics on the quality of training of a neural network.
In fig. Figure 5 shows an example of a standard vulnerability classification report. The data obtained by the neural network after training (the Classification Result block) is compared with the standard and the result is True or False (count the answer as correct or false). According to the results of the classification, the number of erroneously classified vulnerabilities is calculated when learning at the standards, according to the rule for calculating statistics on the quality of training of a neural network. We have reduced this rule to tab. 1, where indicated levels that can be considered the correct result in the classification, based on practical considerations.
Tab. 1. Interpretation of neural network responses during training
In the course of the study, we came to the conclusion that it is impossible to require a 100% coincidence of levels from a neural network when classifying vulnerabilities, since some levels are close in meaning to each other. For example, a person, having received Level Reject = High instead of Max as a result of classification, will count such a vulnerability as refuted. Therefore, if the result given by the neural network is “close” to the true value (High instead of Max and Low / Med instead of Min), then we consider it correct when learning True (weak), if the values are exactly the same, then True (strong). Note that the rules for real vulnerabilities are stricter than for false ones, since identifying real vulnerabilities is a higher priority. All other options not listed in the table are considered a false answer (False).
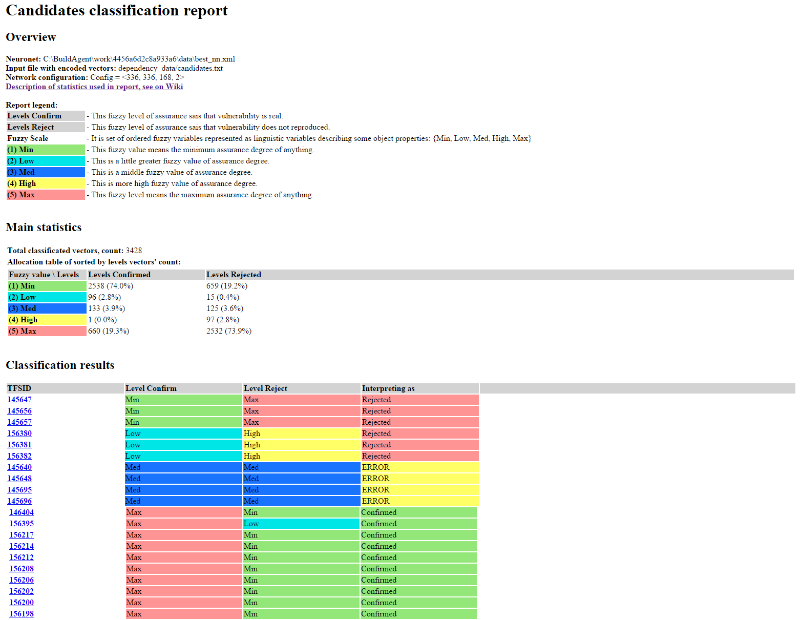
Fig. 6. An example of a report on the classification of vulnerabilities, candidates, containing the values of fuzzy levels and their interpretation
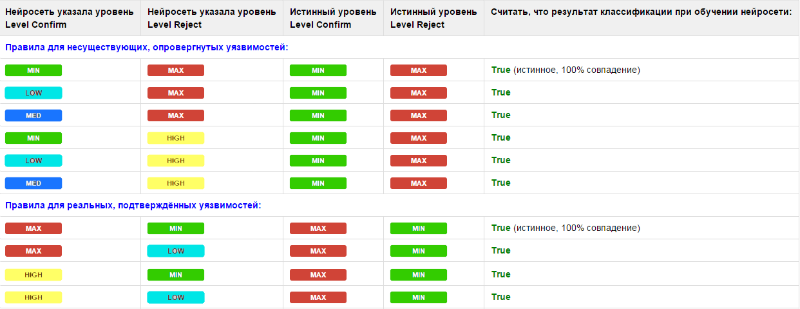
Similar to the report on the classification of vulnerabilities, standards looks like a report with the results of classification by candidates. The neural network provides the answer to how to interpret the fuzzy Level Confirm and Level Reject levels for each vulnerability: Confirmed, Rejected or ERROR, according to the rules for unambiguous interpretation of the results of fuzzy classification of vulnerabilities (see Table 2).
Tab. 2. Rules unambiguous interpretation of the results of fuzzy classification of vulnerabilities
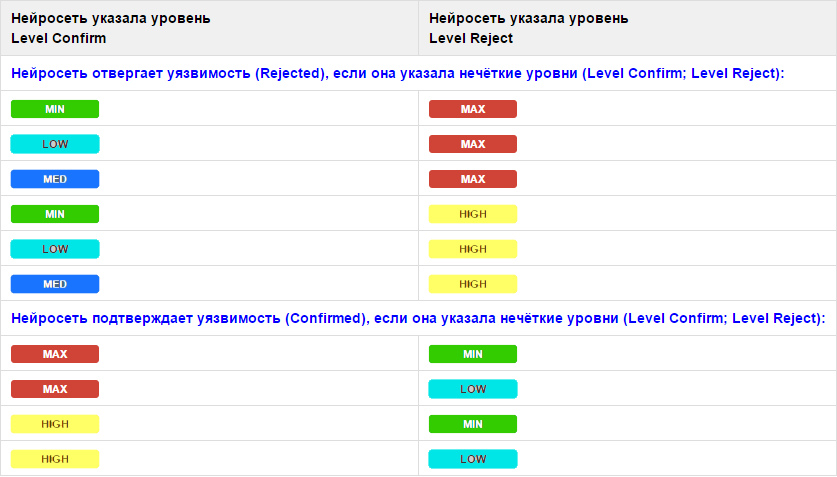
Using the rules allows you to give a clear answer in a human-readable form: the vulnerability is confirmed, refuted, or an ambiguous classification result is obtained - an error. In case of an error, manual classification is required. By analogy with the rules of table. 1, candidate vulnerabilities should be considered rejected if, according to the classification results, a fuzzy Level Reject level is high (Max, High) and a fuzzy Level Confirm level is medium or low (Med, Low, Min). Accordingly, the vulnerability will be confirmed with opposite results. The rules for confirmed vulnerabilities are also more stringent.
Research results
Working with the neural network involved several stages - training at the standards and analysis of vulnerabilities in the operating mode on the new scan results.
So, in the course of the experiment, several neural networks were trained simultaneously, but with different configurations. At the moment, the best neural network with the following configuration has been obtained as a result of training in TeamCity:
Config = <336, 336, 168, 2> . Its training took place during 1155 epochs on 11004 standard vectors of vulnerabilities. At the same time, according to the rules for interpreting responses (see Table 1), the neural network mistakenly classified only 555 (5.0%) of vectors in the learning mode.Analysis of vulnerabilities in the operating mode consisted of two stages. The first stage included the manual analysis of scan data and the classification of vulnerabilities. At the second stage, the analyzed vulnerabilities were proposed to the neural networks that had not previously been trained on them, for analysis (both as candidates for analyzing vulnerabilities and as benchmarks).
In the working mode, while classifying previously unknown vulnerabilities, the neural network produced the following results: out of 2998 analyzed vulnerabilities, 595 (19.8%) were mistakenly classified.
At the moment, all the formal requirements of the testing department are met, and we continue to work on improving the classification results: we optimize the parameters of the neural network, we filter out the “bad” properties from the coding matrix.
Full use of all the advantages of automatic classification of vulnerabilities using neural networks is expected in early 2016. However, now the results of the analysis of vulnerabilities are automatically recorded for vulnerabilities in the DBCA.
In fig. Figure 7 shows an example of a typical record of a vulnerability from DBCA, for which the neural network made the correct assumption that this vulnerability, found by the PT AI scanner, needs to be refuted as a false positive. This is indicated by the field values: “Level Confirm: 5 - Min”, “Level Reject: 1 - Max”, “Notes: Interpreting as: Reject”. Similarly, the results are recorded for all other vulnerabilities.

Fig. 7. Record in DBCA with the results of neural network classification
I express my gratitude to my colleagues: Positive Technologies QA-engineers Vladimir Sofin and Artem Yushkovsky for help in the practical implementation of some tools and a huge contribution to carrying out numerous experiments, as well as associate professor of the department of mathematical analysis, algebra and geometry, K. ped. n Kazan (Volga Region) Federal University Mansur Gilmullin for helping to prepare a theoretical base for research and experiments.
Author: Timur Gilmullin , Ph.D., DevOps Engineer Positive Technologies.
Source: https://habr.com/ru/post/274241/
All Articles