Tectograms - a new generation of mayndmap
The picture is clickable
In the field of organization of thoughts in the form of notes, there is a huge amount of software. The most widespread are three approaches and, accordingly, three types of programs:
For textual information (a plan, a list of tasks, a selection of links), a multilevel list is enough. The list is visually homogeneous and easy to scan. But it is worthwhile to place a picture in the text, as she immediately pulls attention to herself and breaks the flow of reading.

')
Mindmaps are realized in the form of a tree, the leaves of which can contain not only text, but pictures. The text should be short and the pictures should be small, otherwise the structure will deteriorate. If we illustrate each element, then with a large amount of data, there will be no order on the diagram. Mindmap is easy and fun to draw, but pretty hard to read.

We set the task to develop another way of presenting short notes (thoughts, ideas) in the form of a diagram that would be read as good as a list or a maydmap.
We will go from top to bottom, from the highest hierarchical level to the lowest. So, there is an element consisting of a title and a description. Newspaper headlines are typed in a much larger size than the main text; we will do the same:

An illustration can be inserted into this design; regardless of the actual size, we limit it to the width.

The hierarchy is visually represented by text of a qualitatively different size, so we will make the headers of the nested elements in the same size as the description of the upper element.

The nested elements will be shown below, so that they do not need connecting lines. You can arrange the elements in a row, column, in several lines (like words).

If we supplement the structure with inter-element connections, then also in the form of a matrix or a graph.

The device of a multi-level system is easy to read, zooming in and away the map. To navigate can not do without scaling. The resulting display method has much more in common with a regular map than that of the "mind maps". Let's call this method a system map , or a tectogram (Greek τεκτονικός - referring to construction).
Advantages: visual uniformity, clearly visible levels, at the same time look can cover 2-3 hierarchical levels. Compared to mindmaps, it is easier to read; compared with lists - great flexibility.
The main disadvantage of the format is that for active work it is convenient only in an interactive digital form. A pencil in a notebook can not draw this. But you can print as a poster, read only. On paper it makes sense to print tectograms of systems up to 5 levels deep. On the A4 format, two-level tectograms are well read, A2 - three-level, A1 - four-level.
Tectograph is a tool for creating system maps. You can take a look at the demo , or you can get the source code .
Now it is a tool for individual work. The system is saved in localstorage, it can be exported to a JSON file and imported from it.
There is a “simplified editor” in which the entire system is presented in text form in one field. In this format, there are some elements of formatting systems. This is done in order to be able to fix thoughts “in the stream” and not waste time on registration. It is convenient to distribute the diagram as a whole, then gradually edit the individual elements.
Emphasis is placed on working with tectogram content, styling is reduced to the choice of one of the predefined styles. You need beauty - you can export to SVG and bring it up to standard in a vector editor or make it up as a web page.
There are hotkeys, undo and redo actions.
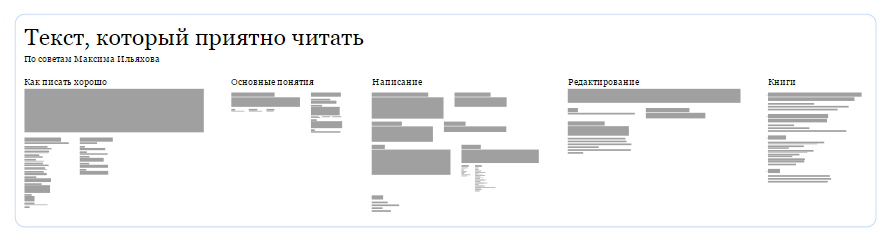
Like any other tool, the tectograph has its limitations. It is best suited for note-taking, systematization of thoughts, modeling programs, planning articles and speeches — everything that has a hierarchical structure.
A couple of examples (pictures are clickable):


For lists of cases, tables, flowcharts, illustrations Tectograph is most likely not suitable. Each of these data types has its own convenient tools. However, no one bothers to try. This is how a checklist might look like:

Library at Github
Demo
Works in Chrome and Firefox. There are problems with IE. Waiting for feedback and comments in the comments.
Soft for order
In the field of organization of thoughts in the form of notes, there is a huge amount of software. The most widespread are three approaches and, accordingly, three types of programs:
- Wiki - Hypertext Notes
- Multi-level lists - outliners (eng. Outliners)
- "Intellect cards" (mental maps, "mind maps", mind maps, mind maps)
For textual information (a plan, a list of tasks, a selection of links), a multilevel list is enough. The list is visually homogeneous and easy to scan. But it is worthwhile to place a picture in the text, as she immediately pulls attention to herself and breaks the flow of reading.
')
Mindmaps are realized in the form of a tree, the leaves of which can contain not only text, but pictures. The text should be short and the pictures should be small, otherwise the structure will deteriorate. If we illustrate each element, then with a large amount of data, there will be no order on the diagram. Mindmap is easy and fun to draw, but pretty hard to read.
We set the task to develop another way of presenting short notes (thoughts, ideas) in the form of a diagram that would be read as good as a list or a maydmap.
Redesign
We will go from top to bottom, from the highest hierarchical level to the lowest. So, there is an element consisting of a title and a description. Newspaper headlines are typed in a much larger size than the main text; we will do the same:
An illustration can be inserted into this design; regardless of the actual size, we limit it to the width.
The hierarchy is visually represented by text of a qualitatively different size, so we will make the headers of the nested elements in the same size as the description of the upper element.
The nested elements will be shown below, so that they do not need connecting lines. You can arrange the elements in a row, column, in several lines (like words).
If we supplement the structure with inter-element connections, then also in the form of a matrix or a graph.
The device of a multi-level system is easy to read, zooming in and away the map. To navigate can not do without scaling. The resulting display method has much more in common with a regular map than that of the "mind maps". Let's call this method a system map , or a tectogram (Greek τεκτονικός - referring to construction).
Advantages: visual uniformity, clearly visible levels, at the same time look can cover 2-3 hierarchical levels. Compared to mindmaps, it is easier to read; compared with lists - great flexibility.
The main disadvantage of the format is that for active work it is convenient only in an interactive digital form. A pencil in a notebook can not draw this. But you can print as a poster, read only. On paper it makes sense to print tectograms of systems up to 5 levels deep. On the A4 format, two-level tectograms are well read, A2 - three-level, A1 - four-level.
Tectograph
Tectograph is a tool for creating system maps. You can take a look at the demo , or you can get the source code .
Screenshot
Now it is a tool for individual work. The system is saved in localstorage, it can be exported to a JSON file and imported from it.
There is a “simplified editor” in which the entire system is presented in text form in one field. In this format, there are some elements of formatting systems. This is done in order to be able to fix thoughts “in the stream” and not waste time on registration. It is convenient to distribute the diagram as a whole, then gradually edit the individual elements.
Emphasis is placed on working with tectogram content, styling is reduced to the choice of one of the predefined styles. You need beauty - you can export to SVG and bring it up to standard in a vector editor or make it up as a web page.
There are hotkeys, undo and redo actions.
Like any other tool, the tectograph has its limitations. It is best suited for note-taking, systematization of thoughts, modeling programs, planning articles and speeches — everything that has a hierarchical structure.
A couple of examples (pictures are clickable):
For lists of cases, tables, flowcharts, illustrations Tectograph is most likely not suitable. Each of these data types has its own convenient tools. However, no one bothers to try. This is how a checklist might look like:
Library at Github
Demo
Works in Chrome and Firefox. There are problems with IE. Waiting for feedback and comments in the comments.
Source: https://habr.com/ru/post/273447/
All Articles