Oracle Database 12c: Performance Tuning
Database time
Before we talk about optimizing database performance, we need to explain how this performance is measured, especially since many people associated with databases still have a “response time” indicator, which many used to consider as a universal measure of database performance.

The problem with the so-called response time is that it, alas, is relative. For the end user, system administrator, network administrator and database administrator, it is different and depends not only on the net response time of the DBMS, but also on the performance of the business logic code on the application server, the performance of the web interface, the interaction of the network infrastructure components, the work of the firewall , load balancer, etc. Therefore, in order to adequately express database performance, you must use the Database Time indicator, which expresses the time spent by the DBMS on output The completion of a particular call (request), from the moment it enters the database until the last fragment of a sample of results is issued. The stricter definition of Database Time is the total time spent by user processes in active execution or active waiting for making DBMS calls.
')
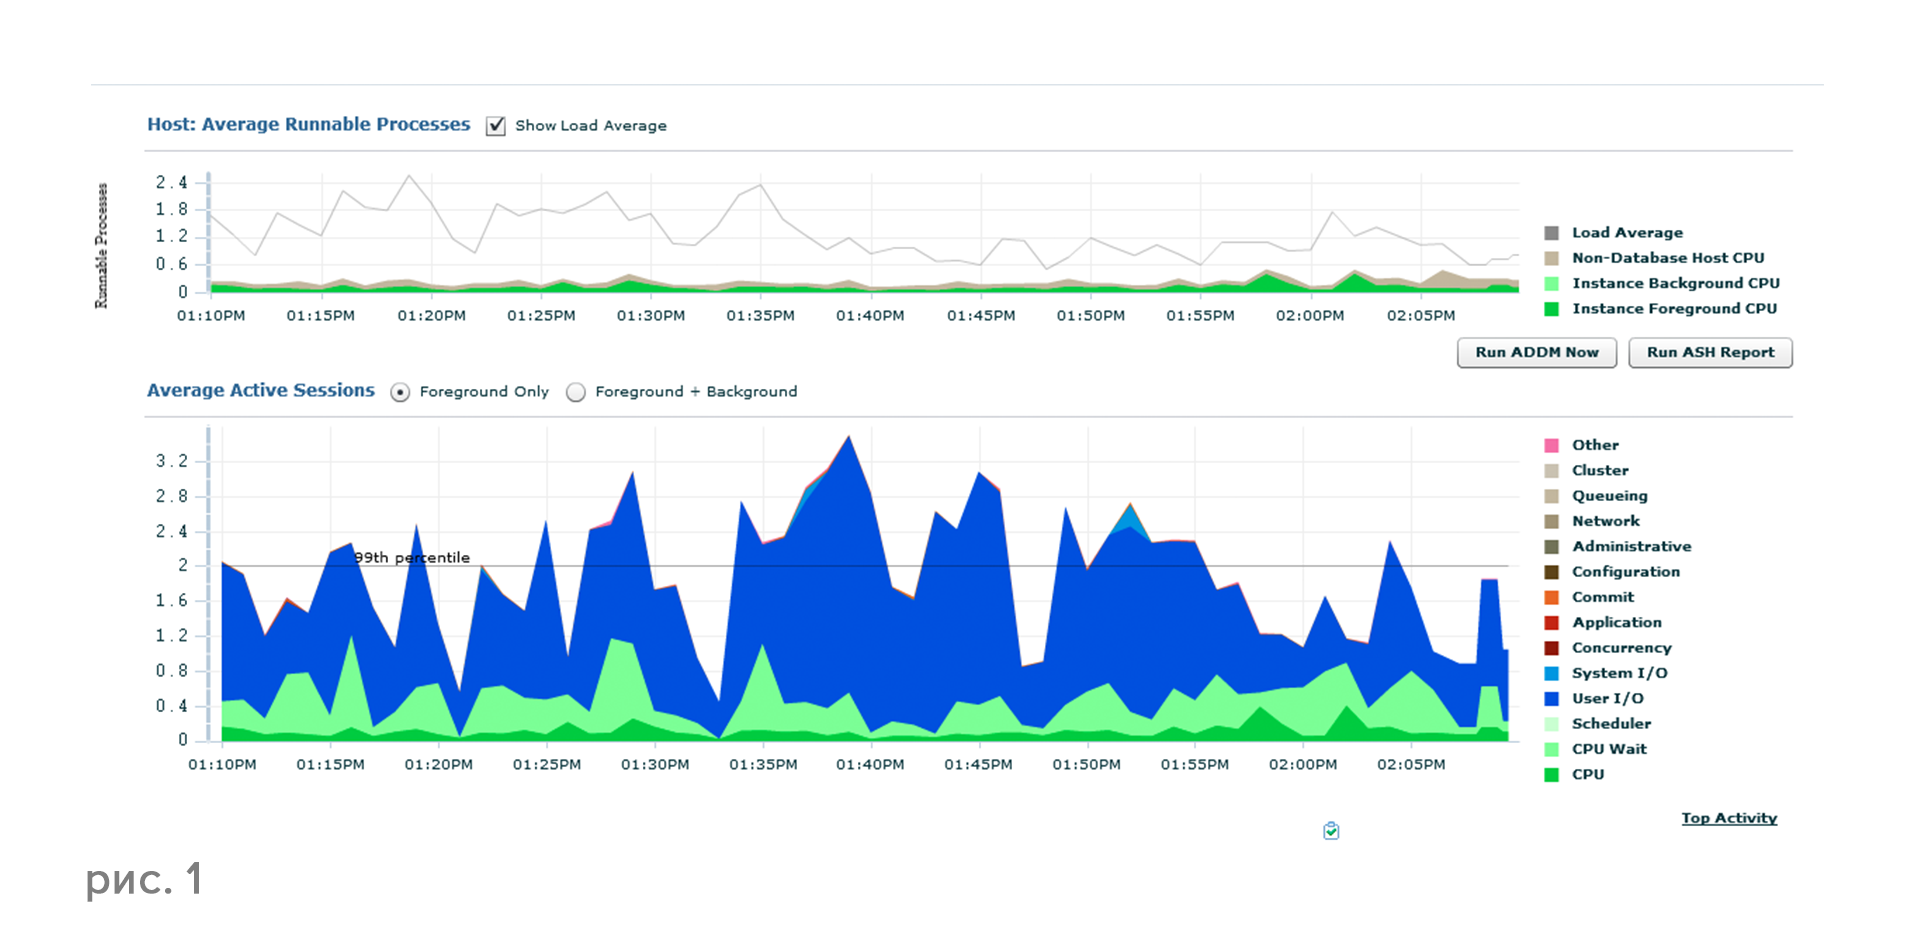
The Database Time concept is perfectly illustrated by the Top Activity page in the Enterprise Manager (Figure 1), where we see the number of active sessions and, in the form of a multi-colored graph, the distribution of the time spent by the DBMS, i.e. database time itself.
Customization tools: yesterday and today
Previously, the DBMS setup process was akin to wandering in the dark - administrators tried to use certain settings that, in their opinion, could affect the behavior of the optimizer, varied their values, focusing on the feedback from end users who did not always notice the changes for better or the worst side.
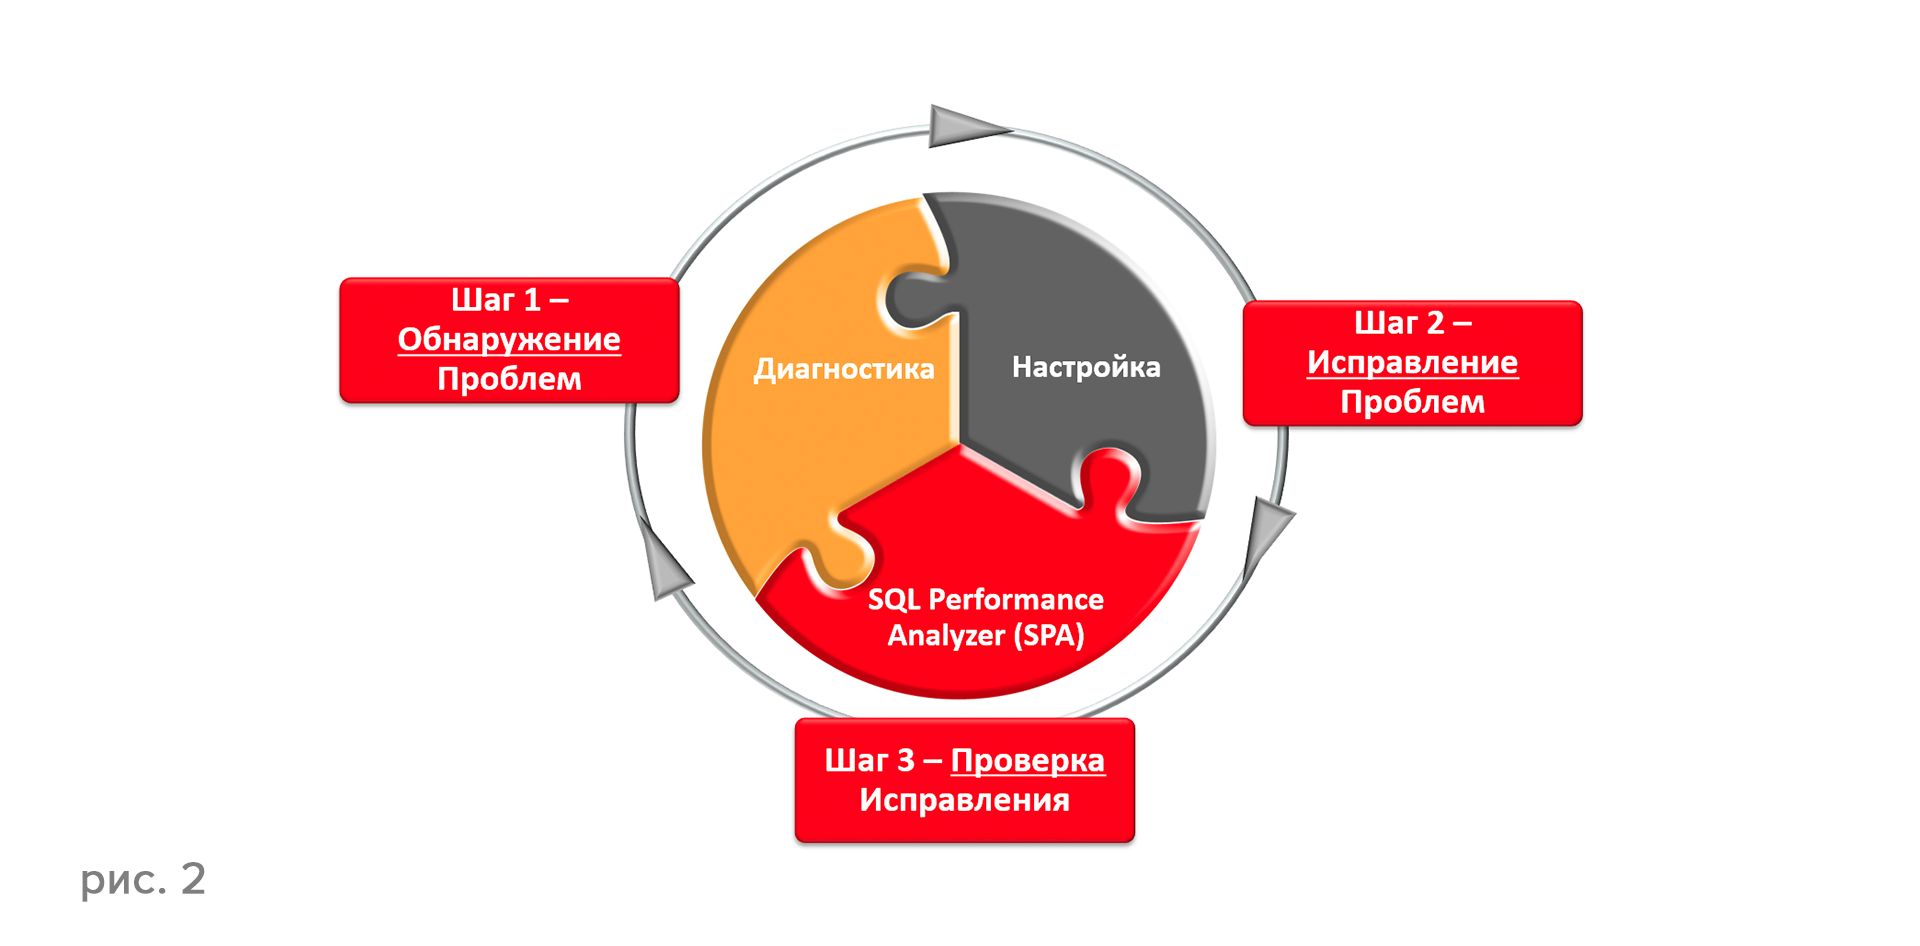
The current performance tuning methodology, called Find-Fix-Validate (Figure 2), allows you to accurately diagnose performance problems using DBMS performance analysis tools, solve them using the automatic tuning tools included in the Tuning Pack, and verify the measures taken by means of testing included in the package Real Application Testing.
We are looking for a problem
The latest versions of the Oracle DBMS, including, of course, Oracle Database 12c, are literally stuck to the performance sensors and, in addition to their core work (running queries, optimizing, delivering results, coordinating user actions), they constantly report what they do - publish wait events and call timing. Therefore, it is always accurately known how much time the DBMS took for one or another activity.
It must be said that Oracle has come up quite elegantly with the implementation of this opportunity and did not invent its own language to access diagnostic information, but designed it in the form of special Database tables, which can be accessed using the SQL language and the Enterprise Manager 12c graphical interface . Thus, monitoring, diagnosing and finding the root causes of various problems for users of the Oracle DBMS is extremely simplified.
There are quite a few hundreds of tables that contain the necessary information, the statistics in them are rather fragmented and, moreover, cumulative. But, of course, there is no need to compare the indicators manually, because for a comparative analysis of the obtained data a special diagnostic repository Automatic Workload Repository (AWR) was developed, which periodically (hourly by default) removes diagnostic information from the tables - various waiting classes, metrics, basic statistics, statistics on SQL queries and so on. AWR data is stored in the database and used for diagnostic reports. AWR Baselines technology allows you to create reference time intervals by comparing business transactions, such as closing the trading day, reporting period, payroll, etc., with the intervals of AWR images and periodically perform a comparative performance analysis for the selected interval. This technology allows faster analysis of load variations and makes it easier to diagnose database performance.
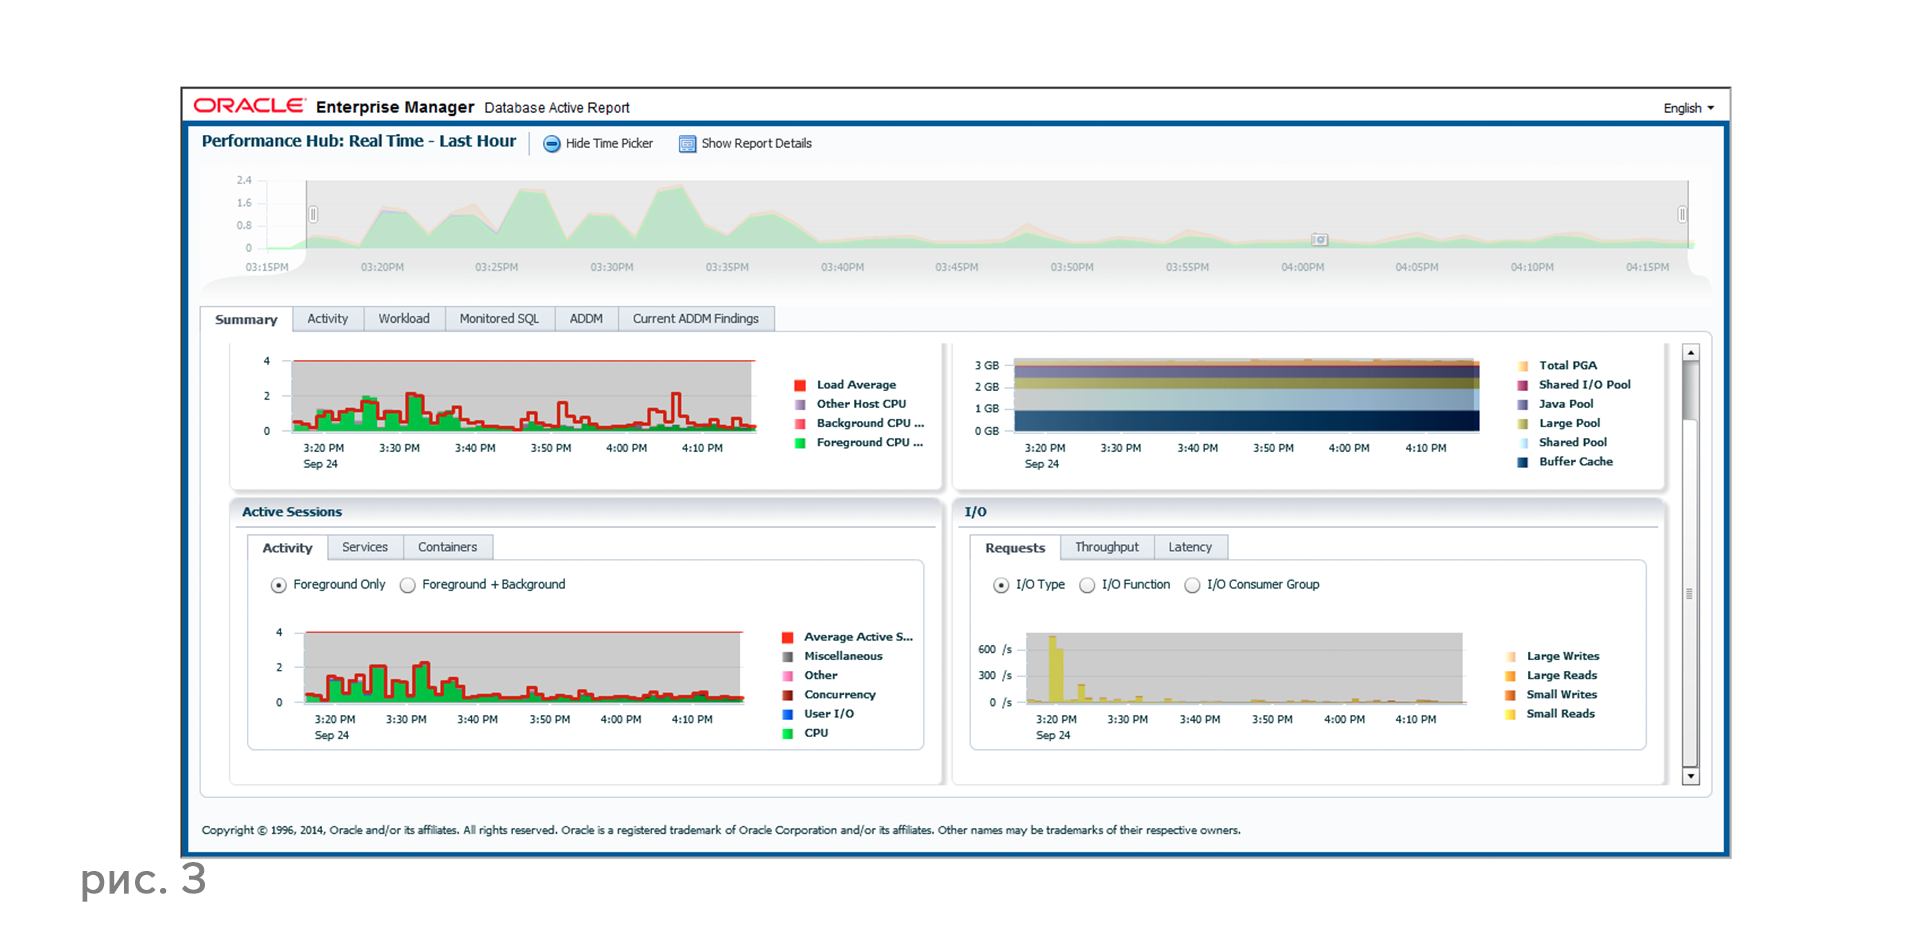
The AWR report is saved in HTML format by default (Figure 3, left). There is a new type of report - it is called Performance Hub - which displays the statistics of the database in a convenient and visual graphical form (Figure 3, right).
In Oracle Database 12.1.0.2, another new, very convenient form of AWR report has appeared - Active-HTML-report. It combines the navigation and granularity features of Enterprise Manager for offline analysis, it can be saved and sent by mail, like other active reports, no Enterprise Manager is required to view it.
AWR Warehouse is the central repository for long-term storage of AWR data. It is stored in a separate, dedicated Database. Thus, you can extend the storage period of AWR snapshots to infinity to analyze the chronology, see what was a year ago, 2 years ago, etc. The AWR Warehouse is integrated into all screens of the Enterprise DB Manager and allows you to get a comparative report for any period of time.
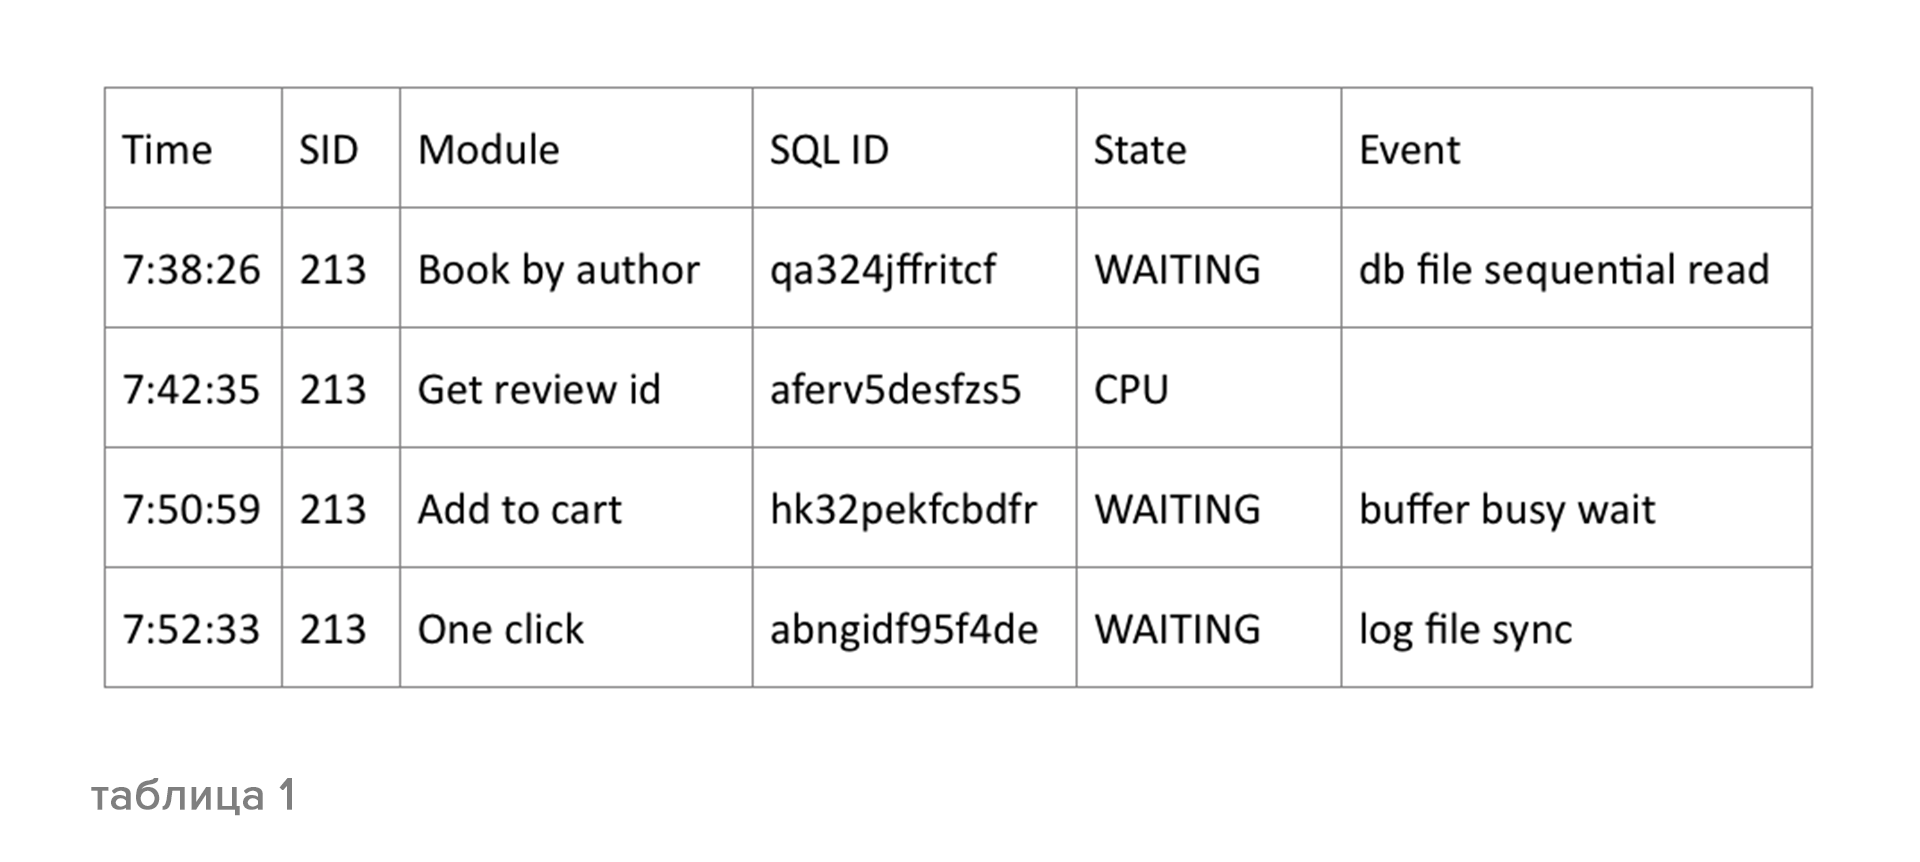
Active Session History (ASH) functionality is a monitoring tool that appeared in Oracle Database 10g. ASH takes snapshots of active sessions every second and writes them into a special memory structure (see Table 1). In practice, this is real-time monitoring. Enterprise Manager 12c has a very convenient graphical interface to Active Session History, called ASH Analytics.
The Automatic Database Diagnostic Monitor (ADDM) advisor built into the database helps to interpret diagnostics and find the root cause of poor performance. By itself, an AWR report is a fairly voluminous document that is easily confused. ADDM helps to interpret the statistics stored in the Workload Repository and find the root cause of the problems. ADDM analyzes Database Time consumption, relates it to session activity, and creates a report with specific recommendations. It is important that ADDM not only informs you about the performance problems of the database, but identifies the causes of the problems and ranks them by degree of influence.
Finally, in Oracle Database 12, an improved version of Real-Time ADDM appeared that automatically starts when thresholds of a number of parameters are exceeded, for example, the number of sessions, excessive CPU time, conflicts, and other events that reduce the performance of the database. The new Real-Time ADDM features automatic detection and analysis of problems in real time, automatic diagnostics of serious performance problems.
ADDM reports are stored in the AWR repository for historical analysis. Real-Time ADDM is also an emergency monitoring tool that, if a normal connection to the database is impossible — if it is “frozen dead” —can make a special diagnostic connection and remove diagnostics directly from the DBMS memory. The adviser built into the database will help in diagnosing problems and determine their cause. It is always better to start the analysis with the ADDM report, because it contains information from the AWR and from the ASH in a convenient form for initial performance analysis.
For a detailed analysis of the execution of SQL queries, Enterprise Manager has a Real-Time SQL Monitoring window that allows you to monitor how a particular SQL query is executed, what plan it runs on, and at which step the execution plan spends the most resources. Real-Time SQL Monitoring has some very interesting indicators, such as Actual Rows and Estimated Rows. Using Real-Time SQL Monitoring, you can also control the execution of PL / SQL procedures.
Fix the problem
Practice shows that most of the database performance problems arise from SQL queries — either incorrectly written or, for various reasons, inefficiently executed. Incomplete statistics, new optimizer version, incorrect parameters, conflicts - there are a thousand reasons why SQL queries can be performed incorrectly. Oracle SQL Tuning Advisor tool provides recommendations for improving the performance of problematic SQL queries using the same Cost Based Optimizer (CBO) SQL query optimizer, but in a special tuning mode, giving the CBO more time for comprehensive analysis and verification. The analysis uses real and historical AWR-data and identifies alternative plans for query execution. If, when using a parallel SQL profile, the execution of a SQL query is accelerated two or more times, SQL Tuning Advisor will recommend it. Also, SQL Tuning Advisor will check various recommendation options and you will receive a report in Enterprise Manager about which SQL query has been analyzed and what recommendations for its configuration have been proposed.
The new version of SQL Access Advisor, which appeared in Oracle Database 12c, can significantly reduce the analysis time for large SQL loads. SQL Access Advisor analyzes not single SQL statements, but SQL load for a certain period of time. Now it works much more efficiently and analyzes the database objects ten times faster.
Both SQL Access Advisor and SQL Tuning Advisor have a graphical interface in Enterprise Manager.
Check the result
The SQL Performance Analyzer (SPA) tool included in Real Application Testing provides testing in Oracle Database 10.2, 11g, and 12c, allows you to predict the effect of system database changes on the SQL response time, determines SQL performance results for each test execution of SQL load, analyzes differences in performance and compares the performance results of specific SQL queries. At the same time, it has a minimal impact on the performance of the working system when capturing SQL load in SQL Tuning Set (STS).
The new SQL Performance Analyzer feature - SPA Quick Check in Enterprise Manager allows you to quickly check for changes, say, optimizer parameters, affecting query plans. For example, if you have a thousand queries in a set, and the plans, as a result, change only in ten of them, then SPA Quick Check will first identify these ten requests and conduct comparative testing for them.
Separately, it would be worthwhile to talk about the proactive approach. on how to avoid problems with the DBMS - on the management of query plans, but this is a separate topic that goes beyond the scope of this article.
Information sources
To learn more about performance tuning, first of all you should study the documentation for the Oracle Database, for a start, the “2 Day + Performance Tuning Guide” document, which gives an overview of everything we discussed in this article. The Performance Tuning Guide is about tuning performance at the database instance level. Setting up SQL queries is described in detail in the “SQL Tuning Guide” document. Another document, the Testing Guide, is a guide to the Real Application Testing package and the various possibilities for using the SQL Performance Analyzer. We also recommend taking a five-day training course at Oracle University, which is called “Oracle Database 12c: Performance Management and Tuning”.
Source: https://habr.com/ru/post/273435/
All Articles