Detection of insider trading: Algorithms for identifying and patterns of illegal transactions
How exactly do insiders behave on the exchange? Do their transactions depend on their position in the company (general or financial director), does the behavior of insiders change over time (did it affect, for example, the crisis of 2008)?
A group of researchers from the Georgia Institute of Technology conducted a study based on data from 12 million transactions completed by 370,000 insiders from 1986 to 2012. The purpose of this work was to identify patterns of behavior of players in the stock market, through which regulators could detect and thwart illegal insider trading. We present to you the highlights of this document.
What is insider trading
According to the generally accepted definition, insider trading is trading in financial instruments and making profit based on information obtained within the company due to the position or role of the attacker in it. It is believed that insider trading hurts financial markets because it reduces liquidity and undermines the general confidence of economic participants in each other. The authorities of various countries are actively fighting insider trading.
')
However, most of the transactions made by insiders are not illegal at all. Among the "insiders" are directors, managers and owners of shares of the company. These people, in principle, have the right to trade on the stock exchange, illegal insider trading becomes only when important non-public information is used as the basis for making a decision about a transaction.
In various countries there are all sorts of rules that require insiders to report on their transactions. And in the case of a significant number of transactions, to identify among them those that fall under the description of the illegal trade is not so easy.
Data Mining to the rescue
The researchers decided to apply for solving the problem of Data Mining. As mentioned above, the data set includes information on more than 12 million transactions on American exchanges that were made by more than 370 thousand insiders from 1986 to 2012. The database was stored in SQLite, the total amount of data was 5.61 gigabytes.
| Insiders | 370,627 |
|---|---|
| Companies | 15 598 |
| Transactions | 12 360 325 |
| Sale | 3 206 175 |
| Purchase | 1,206,038 |
Each entry in the dataset consists of the name and company insider fields, the transaction price, the person’s role in the company, and information about it (including the sector of the economy and address). There are a large number of definitions and codes that denote various positions, but there is no clear hierarchy. Therefore, insiders may accidentally or intentionally indicate in the documents an incorrect description of their position, which makes it difficult to further analyze their transactions.
Researchers have solved this problem by entering four symbols, each of which combines codes of positions held close to each other:
- CEO - CEO;
- CFO - financial director;
- D - director;
- OO is another leader.
Figures 1 and 2 show the cumulative distribution for the number of companies to which insiders belong and the number of transactions they have committed. As a rule, an insider is related to a small number of companies and does not make particularly large transactions, but there are also a small number of people who are associated with many organizations and make volume transactions.
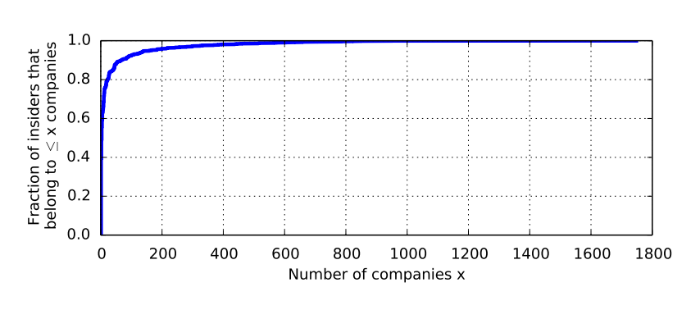
Fig. 1: Empirical cumulative distribution of the number of companies the insider relates to

Fig. 2: Empirical cumulative distribution of the number of transactions performed by insiders (the x-axis has a logarithmic scale)
What is this analysis for?
Analysis of insider transactions may be useful from various points of view, for example:
- Understanding the risks - several different studies have shown that those managers who buy and sell their company's shares on the exchange eventually start making decisions about their main job, which are dictated by their purchases or sales on the stock market. For example, such a CEO, having gathered to buy shares, can contribute to the issuance of a press release, which tells about these or other problems of the company - this knocks down the price of its shares and helps it save money. And if he wants to sell shares, the company's news flow, on the contrary, may become overly positive.
- Detection of fraud and illegal transactions - the use of a mining date technique allows you to identify possible insider transactions, the purpose of which is to deceive the company's investors.
Patterns of insider behavior in the stock market
Researchers have put forward two hypotheses about important factors affecting the legality or illegality of insider actions in the stock market. The first of these is the time factor. If an insider makes deals in the period before or after important corporate news, then with a high degree of probability, the decision to make a transaction is dictated by knowledge of some information that is not available to other market participants. If the deals are always made in the same month for several years in a row, then most likely it is a matter of simply diversifying the portfolio of financial instruments. The second important factor is the relationship between traders. If the network of insiders trades in the same way, then they are likely to share information with each other.
Based on these assumptions, the proposed analysis algorithm is constructed. First of all, trends in the time series of transactions are studied. At the time of the transaction affects many factors, so the information about them is divided into the type of transaction, the code of the insider role in the company and the company's economic sector.
Analysis of transaction types reveals some interesting patterns. For example, insiders sell shares more often, and not buy - this is due to the fact that many managers receive shares for their work through, for example, options in a company. Therefore, insiders sell shares more often to balance their securities portfolio (Fig. 4).
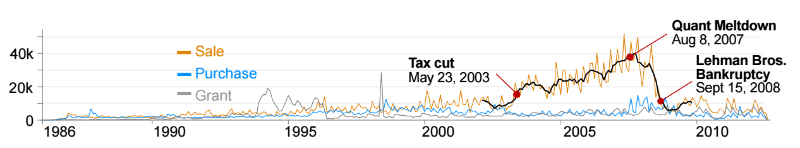
Fig. 4: Schedule of distribution of transactions of different types (Sell - sale, Purchase - purchase, Grant - receipt of shares of insiders using the option, for example)
In addition, insiders who occupy different positions in the company, trading on the stock exchange also in different ways (Fig. 5). The behavior of general directors (CEO) is more volatile - for example, in the existing set of data, transactions indicate that after 2003, American CEOs aggressively sold shares, and then after 2008 they stopped doing so. Conversely, sales activity on the part of the company's shareholders began to increase only on the eve of the 2008 financial crisis.

Fig. 5: Breakdown of transactions by insider roles in a company
Affects the activity of trade and the economic sector, which represents a particular company. For example, shares of technology companies are buying and selling more often. An interesting point is that the activity trend of transactions of this type of shares coincides with the sales schedule from Figure 4 (cross-correlation coefficient p <0.1) - this is because such companies (among them there are many startups) include their own shares in employee compensation.
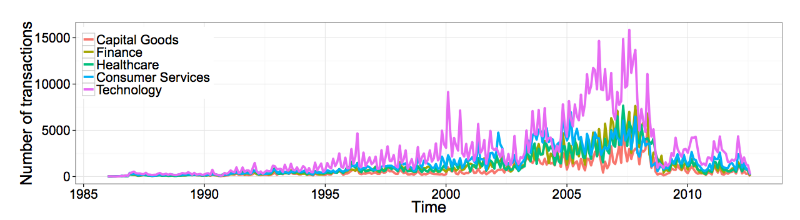
Fig. 6: Breakdown of transactions by sector
Further, the patterns within certain transaction sequences were studied. What part of insiders sells shares after their purchase, and who continues to buy or sell further? To answer these questions, it is necessary to analyze the transaction intervals between successive transactions.
If the insider sold the shares after their purchase, then such a combination is called sale-then-purchase and is denoted as S → P. The following three types are described as purchase-then-sale (purchase and sale, P → S), sale-then-sale (sale and sale, S → S), and purchase-then-purchase (purchase and purchase, P → P) . Visualization graphs make it clear that the patterns S → P and P → S are less common than the pairs P → P and S → S. This can be explained by the fact that many insiders are employees who are given shares for their work, which means they can sell them from time to time (hence selling for sale).
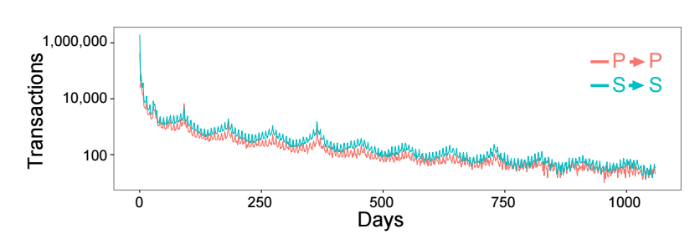
Fig. 7: The time between successive transfers of the same type: P → P and S → S
Sometimes, insiders may want to accumulate more stocks in their hands, forcing them to buy them several times in a row.

The highest interval between transactions P → S and S → P is about 180 days. At the same time, those deals of pairs S → P and P → S that are within this interval are profitable in 45% of cases, and those that lie outside of it - in 70%.
Analysis of transaction correlations and stock prices
Is it possible to reasonably assume that a certain set of insiders conducts transactions using information that is inaccessible to other bidders? To do this, you need to examine all transactions made by an insider with the shares of a certain company C and compare them with the prices of the shares of this company at the close of trading on the day of the transaction.
If the insider made the transaction at the TP price, and the CP closing price was clearly higher, or if the insider sold the shares at the TP price, and the closing price of the CP turned out to be strictly less, then such transactions can be “informed” - the trader buys when the price is low, and sells when high.
A separate question is how to determine the level of awareness of a particular person. That is, how to make sure that a positive result of the transaction is not just luck. This can be done using algorithm 1.
Algorithm 1
First, an empty set T is created, into which separate sets will later be inserted, consisting of the values of the transaction of the insiders (line 1). Then the procedure begins to examine each transaction one by one (lines 2-19). Also, a set of s i is first created for each insider I (line 3) and for each company whose shares it was trading (lines 4-18). A set of transactions is called “split” (split) if they occurred on the same day, were of the same type (sale or purchase) and at the same price. If the transaction set was deemed to be broken, then all transactions are summarized and treated as one transaction (line 5).
Then, the closing price and the dollar volume (trading volume multiplied by the closing price) are determined - lines 6-7. Because it is important to find the "signals" that prompted the insider to make a deal. To do this, you need to normalize each transaction. To do this, you need a normalized value - the number of shares bought or sold is multiplied by the price and divided by the dollar volume. Typically, this ratio is greater than 0 and less than 1. After its calculation, the transaction price is compared with the closing price. If an insider buys or sells when the price is low or high compared to the closing price, then the ratio value is added to the set s i (lines 9-18) - this value will be called “signal”. When there are a lot of signaling transactions in the data set, it is suspicious. Further, the Bonferroni correction is used to correct the number of erroneous signaling results.

After starting the algorithm for the data sets available to the researchers, he returned 29 insiders for whom statistically significant results were achieved.
Building a network of insiders
It can be assumed that insiders from different companies can form networks with other people who have access to important corporate information in order to share such data for performing transactions on the exchange. To determine who enters such networks, you need to build a graph in which insiders will be nodes - the edges connect those that follow similar patterns in trading. In this way, reasonable assumptions can be made that they exchange information.
In order to understand how similar the behavior of insiders is, you need to create a similarity function, the input of which is the transaction time information of two compared traders who are insiders for the same company, and which yields a certain value indicating the level of timing similarity these operations.
The transactions of a trader T, who is an insider in company C, are represented by the set T c = {t 1 , ....., t m }, where t j is the date of the transaction. This trader may be an insider in more than one company, but Tc contains data on transactions related to the shares of this particular organization. The procedure for building a network of insiders is described in algorithm 2.
Algorithm 2
It all starts with the formation of an empty G network. Then, for each company shares, all transaction dates are compared with all possible pairs of insiders. That is, for each company C, a set of transactions is compared with the date x c and y c for each possible pair of traders X and Y, which are insiders of this company C. To exclude from the analysis of insiders with a small number of transactions, only insiders with a perfect number of transactions are considered not less than h z . Then the function of similarity will be as follows:

where I (x, y) is a function that returns 1 if x = y and 0 otherwise. S (x c , y c ) equals 1 if insiders X and Y always trade on the same date and 0 if they have no common transaction dates. If the similarity between x c and y c is greater than the threshold hm, we include a node for each of the insiders X and Y in the network G (if they are not already represented there) and create an edge between them.
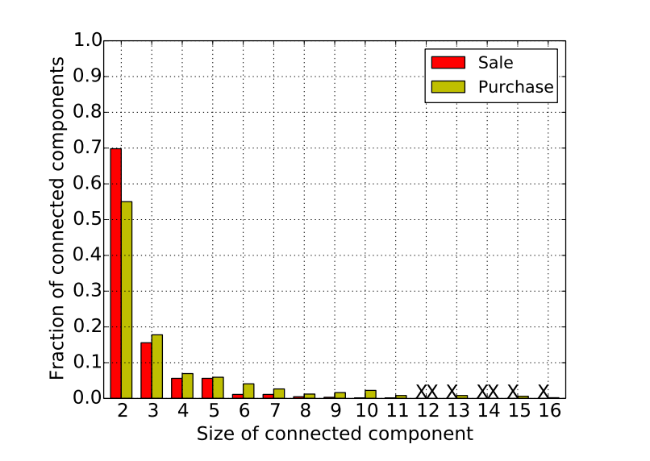
The table below presents the parameters for simple sales networks (Sale) and purchases (Purchase). Both networks have the same number of nodes (insiders), but there are more edges in the Purchase network - more traders have similarities in trading. At the same time, there are more related components in the Sale network than in the Purchase network.

Fig. 9: Examples of connected components from the Sale network, insiders form clusters of various shapes
Next, we study the dimensions of the connected components, that is, the number of insiders in them. The figure below shows the distribution of the connected components of a certain size. It can be seen that most of them have a size of 2, which indicates that the majority of traders in the network usually do not perform operations on the same dates. However, there are still large related components in the Purchase network:

The largest component of traders found by researchers - they traded shares of an electrical company
An insider can be one for several companies and have some similarities in actions on the stock exchange with the insiders of each of these companies. In this case, several companies are considered as a combined component - as in the triangle in Figure 9.
It is also important to understand whether insiders of the same positions are integrated within such a component. Figure 10 below shows all the combinations of role pairs (for example, the edges between the CEO and CFO, CEO-CFO). For example, in both networks, we observe that if the insider is the CEO, then the probability is higher that he is connected to another OO in another company. This is an interesting point - the CEO is the pinnacle of the corporate hierarchy, but it turns out that such top managers tend to interact with not so high-ranking insiders. At the same time, middle-level insiders are more often associated with people of a similar position. All of this indicates the existence of both vertical and horizontal flow of insider information exchange.
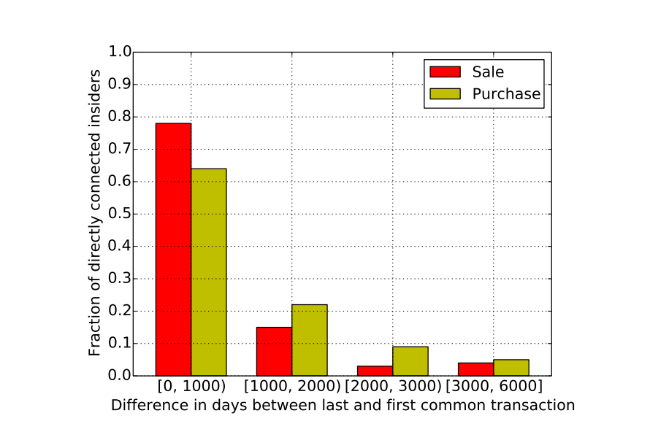
It also analyzes the constancy of similar behavior in the trading of insiders - the difference in days between the last and the first similar transaction is calculated. Previously, h z was set at level 5, so insiders must have at least five similar transactions. The result of this analysis is presented below:
Finally, the collective behavior of insiders and their neighbors on the network is studied. In addition to the information that insiders and their neighbors on the network performed the same operations on specific days, data are analyzed on what time of these days the transactions took place.
Identify anomalies based on network information
For further analysis of the Sale and Purchase networks, it seems logical to evaluate how each of their nodes is connected to other networks. However, since there are more than 1000 nodes in each network, it is difficult to carry out such an analysis. It is more logical to note a certain number of potentially "interesting" nodes based on certain criteria that distinguish them from all other elements.
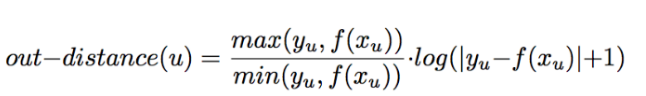
The analysis is carried out on the level of egosets (egonets), where the ego is a specific network node, and its corresponding egoset is a subgraph isolated from the ego and its direct neighbors. This approach allows one to find anomalies in ordinary weighted graphs and obtain easily interpretable results. For this, two metrics are distinguished for each egoset: the number of neighbors (degree) of the ego V and the number of edges in the ego network Eu, where u is the ego.
For many real networks, there should be a power dependence between V u and E u . There is a power relationship in the Sale and Purchase networks for the relationship between V u and E u . In the figure below, the red line of the power dependence is the least squares median values of each data set.

This red line is the norm with which nodes will be compared to detect anomalies.If y u is the number of edges in the state network u and f (X u ) is the expected number of such edges according to a power connection, then if there are x u nodes in the state network u , then the distance of the node u from the norm is calculated as:
Important notes
Such a network analysis of insider actions reveals non-obvious interesting facts that are difficult to detect in any other way. For example, if you look at a long chain of insiders from the Sale network, then at first glance it seems that they are insiders from companies that are not connected with each other. However, if you take a closer look, it turns out that they all work in one investment company, which can act in the interests of those firms with which initially it seems that insiders are connected. This way you can find hidden links.

The study also showed that insiders belonging to the same family are more likely to trade in a similar way. About 7% of directly connected insiders in networks have the same last name. Manual validation of a subset of these insiders suggests that they are indeed relatives.
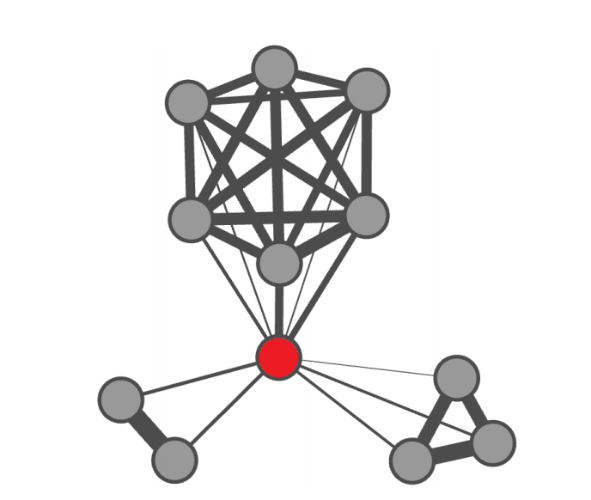
The researchers also found an interesting anomalous structure. The described method marks nodes (or egos), whose neighbors or ego-networks differ from common patterns for all nodes. The figure below shows one such node from the Purchase network and its neighbors. The red ego in the middle is connected to all the other nodes. The thickness of the edges is proportional to the size of the similarity function. That is, the thicker the line, the more similar the behavior on the exchange for the two relevant insiders.
In this particular case, the insider, marked in red, is connected to three groups at once - one can assume that this person actually performs some kind of intermediary functions for the implementation of insider transactions of groups of people from a particular company.
Source: https://habr.com/ru/post/273337/
All Articles