How to create software for a microtomograph for 5233 man-hours
I want to tell in more detail about the interesting project of the Edison company . The developers were given the task of writing software for the microtomograph, they did an excellent job with it, and then they stuffed seeds, bolts, capacitors and a mole into this tomograph. Serious uncles need this tomograph to check diamonds and not buy full of holes.
 And today is December 16, the birthday of Johann Radon , Austrian mathematician, rector of the University of Vienna, who in 1917 introduced the integral transformation of a function of many variables, akin to the Fourier transform used today in all tomographs.
')
Johann Radon was a professor at 6 universities (and in one of them, even without a department), was president of the Austrian Mathematical Society. In Austria, the Institute of Computational and Applied Mathematics and the medal were named after him.
About how the development of software for the tomograph and what tasks were solved in the process - under the cut.
Microtomograph
Scientists from Tomsk State University have created a microtomograph. It allows you to learn about the internal structure of various materials with micron accuracy. For example, diamonds.
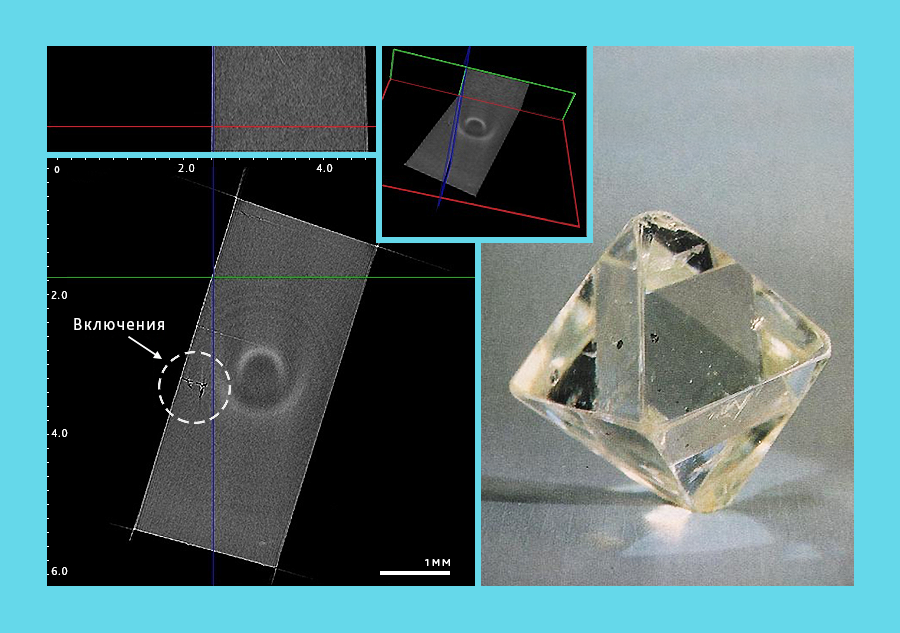
Fig. Diamond quality
The tomograph can enlighten the material with a resolution of up to microns. It is 100 times thinner than a human hair. After scanning, the program creates a 3D model, where you can look not only at the outer side of the part, but also find out what's inside.
Tomograph device
List of the main technical characteristics of the device.
• Number of detector permitting elements: 2048 x 2018 cells with a size of one element of not more than 13.3 x 13.3 μm.
• Resolution: 13 microns.
• Overall dimensions: 504 x 992.5 x 1504 mm.
• Weight: 450 kg.
• Field of view: 1 mm.
• Operating wavelength range: 0.3–2.3 A.
• Accuracy of positioning of electromechanical motion modules in the PMT positioning system: ± 1 µm.
• Compliance with safety requirements: GOST 12.1.030-81.
• X-ray protection: 1–3 µSv / h.
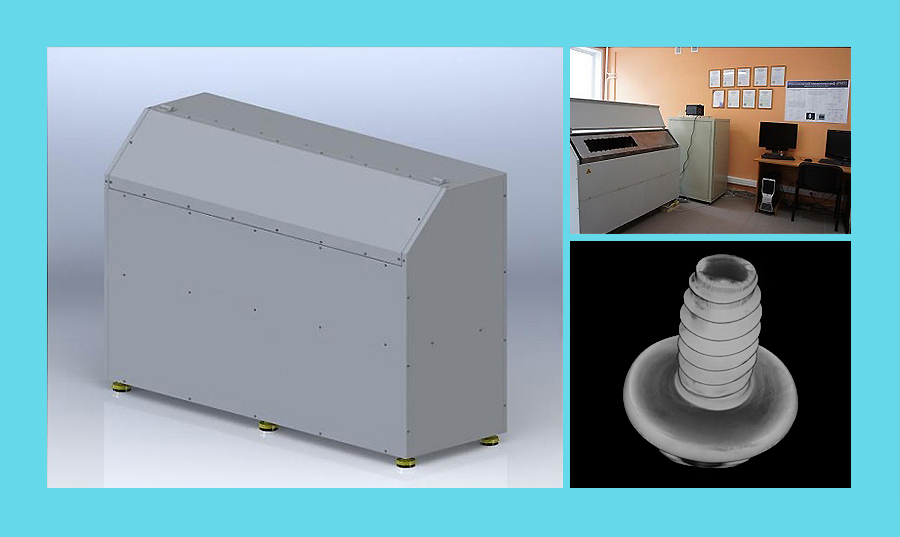
Fig. Appearance
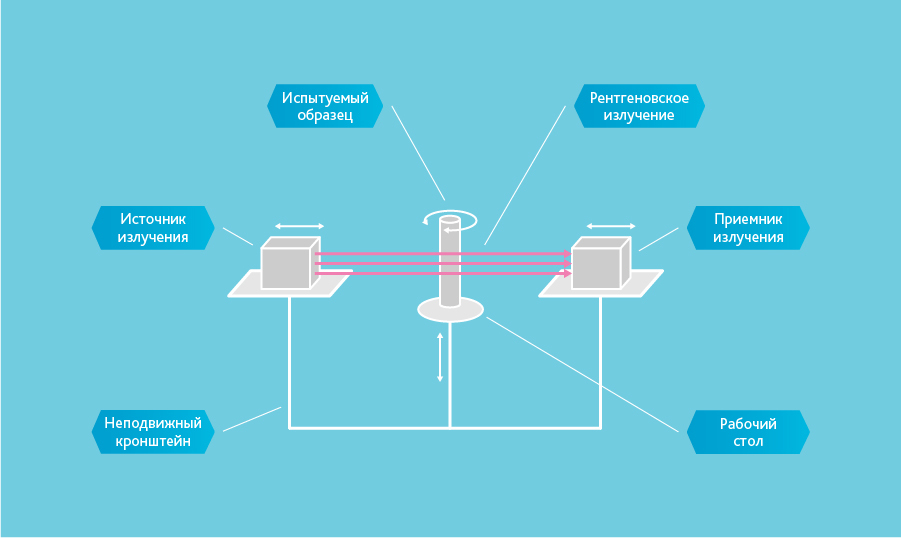
Fig. The principle of operation of the electro-mechanical part
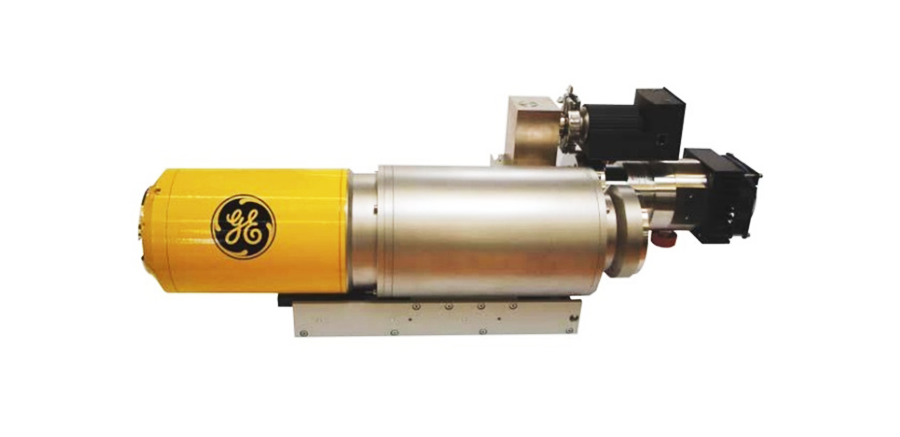
Fig. X-ray source
• Voltage: 20–160 kV.
• Current: 0–250 μA.
• Power: 10 watts.
• Diameter of focal spot: 1–5 microns.
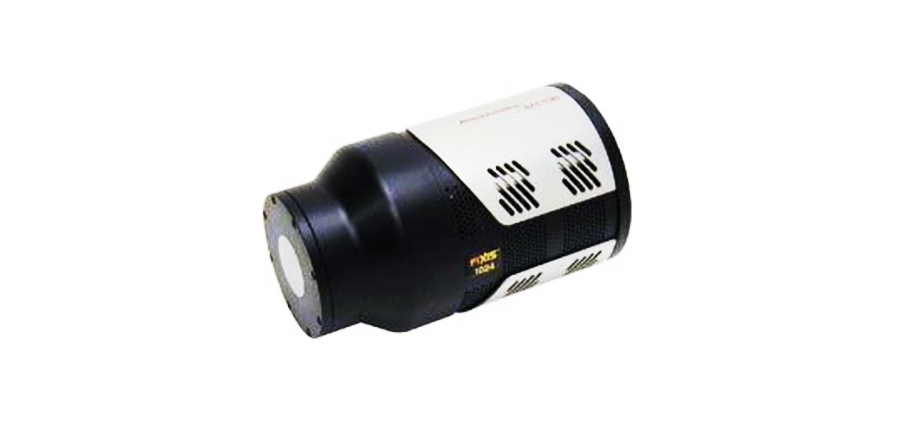
Fig. Positioning
• Rotor stroke: SAMD - 360 °, LEMD - 100 mm.
• Positioning accuracy, not less: ± 0.5 µm.
• The speed of the rotor: from 0.01 to 20 mm / s.
• Power: 0.7 kW at 70 V.
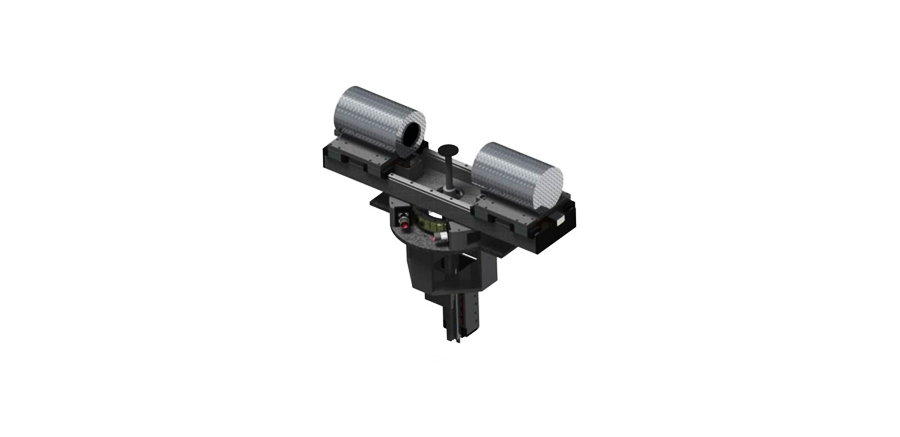
Fig. X-ray detector based on CCD
• Sensitive area of the CCD: 2048 x 2048 pixels.
• Geometrical pixel size: 13 x 13 microns.
• Geometrical size of the sensitive area of the CCD: 26.6 x27.6 mm.
• Built-in two-speed ADC: 16 bit, 100 kHz and 16 bit 2 MHz.
• Number of detector permitting elements: 2048 x 2018 cells with a size of one element of not more than 13.3 x 13.3 μm.
• Resolution: 13 microns.
• Overall dimensions: 504 x 992.5 x 1504 mm.
• Weight: 450 kg.
• Field of view: 1 mm.
• Operating wavelength range: 0.3–2.3 A.
• Accuracy of positioning of electromechanical motion modules in the PMT positioning system: ± 1 µm.
• Compliance with safety requirements: GOST 12.1.030-81.
• X-ray protection: 1–3 µSv / h.
Fig. Appearance
Fig. The principle of operation of the electro-mechanical part
Fig. X-ray source
• Voltage: 20–160 kV.
• Current: 0–250 μA.
• Power: 10 watts.
• Diameter of focal spot: 1–5 microns.
Fig. Positioning
• Rotor stroke: SAMD - 360 °, LEMD - 100 mm.
• Positioning accuracy, not less: ± 0.5 µm.
• The speed of the rotor: from 0.01 to 20 mm / s.
• Power: 0.7 kW at 70 V.
Fig. X-ray detector based on CCD
• Sensitive area of the CCD: 2048 x 2048 pixels.
• Geometrical pixel size: 13 x 13 microns.
• Geometrical size of the sensitive area of the CCD: 26.6 x27.6 mm.
• Built-in two-speed ADC: 16 bit, 100 kHz and 16 bit 2 MHz.
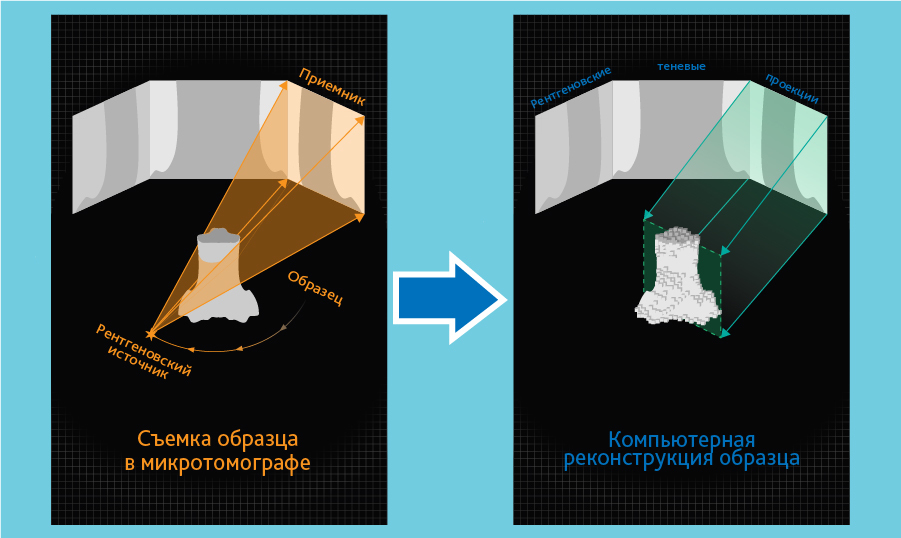
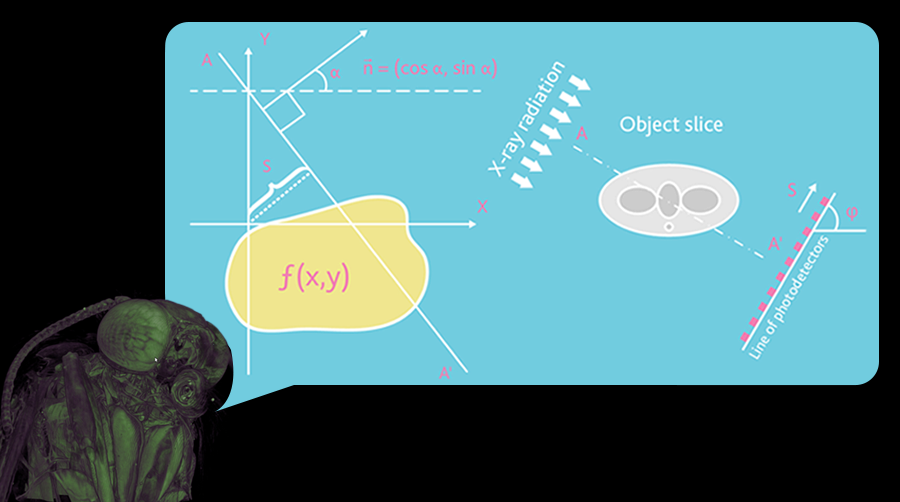
Fig. Illustration of digitization and reconstruction
Used math algorithms.
- Inverse Radon transform.
- Marching / Walking Cubes.
- Gauss filter.
- Filtering / convolution, normalization of projections.
Implementation and technology.
- C ++ / Qt.
- Ubuntu, Windows.
- CUDA.
- Volumetric-voxel model rendering.
- Own format for storing images with grayscale depth of 12 bits.
- Separation of reconstruction on the client-server.
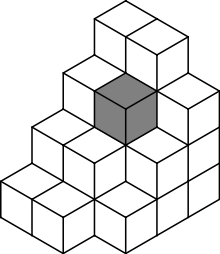
- Saving bulk data in the form of "Oktoderev".
Labor costs: 5233 man-hours.
Debugging was performed on raw data (projection images) obtained from a tomograph.
Algorithms
First of all, it was necessary to choose the mathematical apparatus for solving the problem. The main algorithm - the inverse Radon transform - was laid in the formulation of the problem,
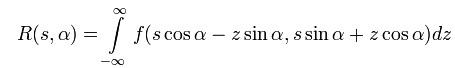
however, it was necessary to adapt it to the peculiarities of our work and use several additional, auxiliary algorithms. For example, in view of the fact that the object was illuminated by one “light bulb,” the formulas for the inverse Radon transform had to be adapted to conical, rather than direct, projections. The standard algorithm assumes that the object is illuminated by a beam of parallel x-rays coming from an infinitely distant source. In reality, the source of the rays is a point source, therefore the beam of rays has the shape of a cone. In this regard, the algorithm of the inverse Radon transform required a coordinate transformation from a conical system to a rectangular one.
At the first stage of calculations, preliminary filtering / convolution, normalization of projections is performed. This is necessary in order to mute the noise on the projections, and the density to more clearly distinguish.
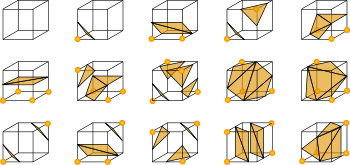
To build 3D-models of surfaces of objects in a standard format for viewing in 3D-editors Compass, SolidWork, 3D Max Studio, the “ Marching (Walking) Cubes ” algorithm was used. The essence of the algorithm is that it runs through a scalar field, at each iteration it looks at 8 neighboring positions (cube vertices parallel to the coordinate axes) and determines the polygons needed to represent the part of the isosurface passing through the cube. Further, polygons forming a given isosurface are displayed on the screen.
The Gauss filter in the project is understood as matrix image processing filters using a convolution matrix. The convolution matrix is a matrix of coefficients that is “multiplied” by the pixel value of the image to obtain the desired result. The filter is used to smooth voxel data and slice projections, which, in turn, improves the quality of the generated 3D models ( Habrapost 1 , Habrapost 2 ).
Implementation and technology
During the work, a number of specialized technical solutions were also created: a library for volume-voxel rendering of the model; video recording when performing operations with the model; 12-bit deep gray image storage; saving bulk data in the form of Oktoderev'ev; polygonization algorithms 3D-model.
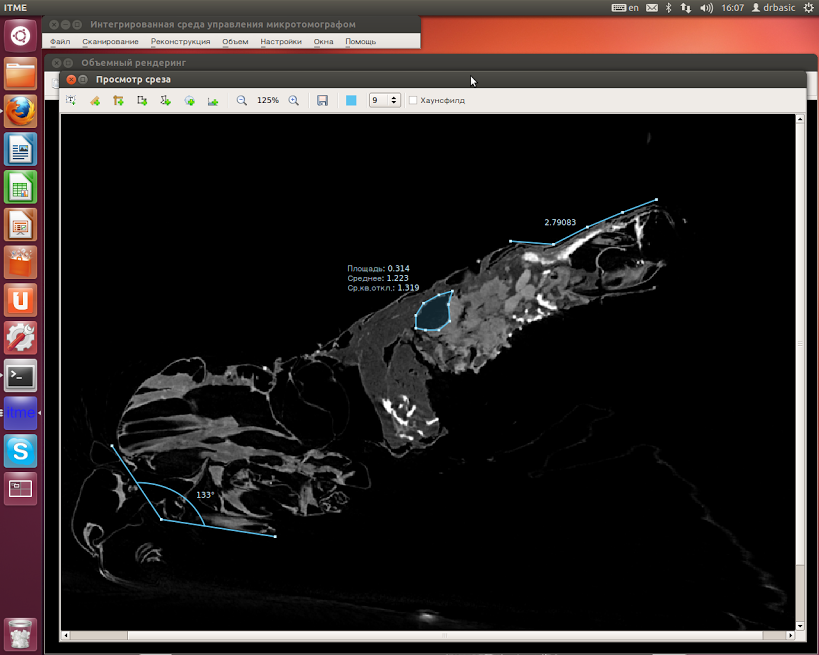
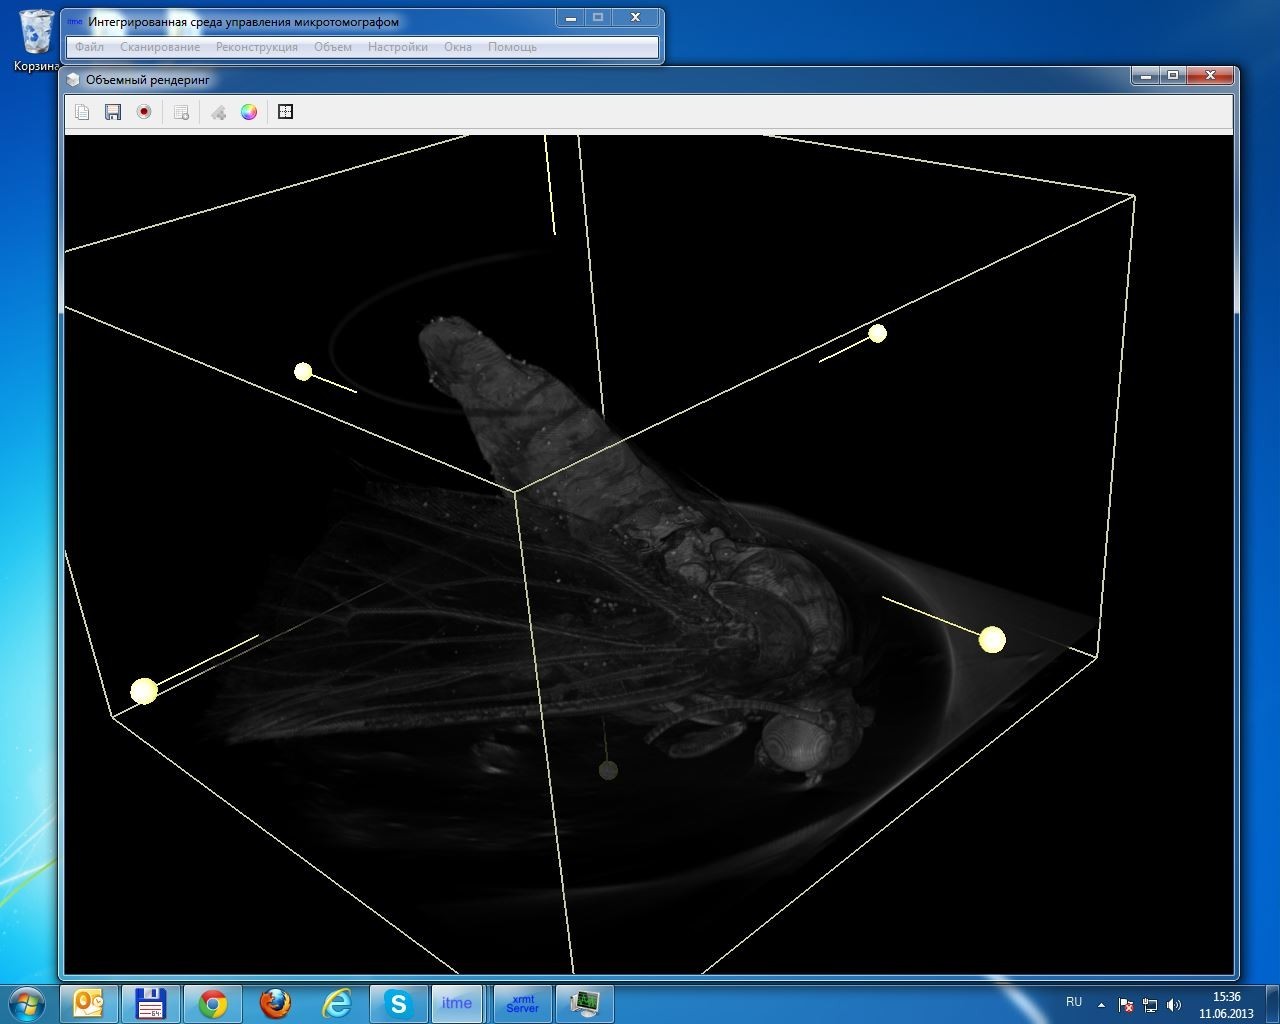
Volumetric-voxel model rendering in the project was used to view the model with the ability to rotate and scale in real time. A voxel is a three-dimensional pixel. Also, using voxel rendering, the operator is provided with convenient tools for determining the viewing area with an automatic increase in the level of detail and the ability to position the section plane at any angle in two clicks. On the basis of the cutting plane, you can later obtain a slice image with maximum resolution.
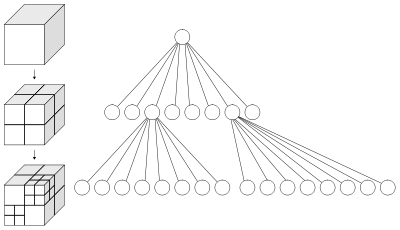 Oct tree (octant tree, octal tree, English octree) is a type of tree data structure in which each internal node has exactly eight “descendants”. Octal trees are most often used to divide three-dimensional space, recursively dividing it into eight cells. In the project, an octree tree allows you to display data in preview mode when there is no need for data that is not visible to the user. For example, volumetric rendering receives a dataset for display with detail depending on the selected area using an octree, which provides a high FPS when the entire model is visible, and at the same time an increase in detail if some smaller part of the model is selected.
Debugging
Next was the optimization stage. For one object, the tomograph produces 360 images, each with a resolution of up to 8000 * 8000. Since the volume of data processed is large, the solution of the problem “head on” would be completely unsatisfactory. This was taken into account at the design stage, but after receiving the first version, the algorithms had to be optimized and adapted several times. The task required that the time for creating a three-dimensional model of the microstructure did not exceed 2 hours, therefore the optimization stage was laid initially. During the testing of the first version, we faced the fact that the use of a standard format for storing projection images is not suitable for a project. The input data contains TIFF images with 16-bit coding for grayscale. Such a depth of color for calculations is redundant, and disk space, network channel, RAM and processor time processing of such images requires a lot. On the other hand, the standard 8-bit color depth was not enough for us to maintain the accuracy of the reconstruction. Therefore, an image storage format with a 12-bit color depth was developed.
In the technical project was laid horizontal scaling calculations. The reconstruction of the 3D model, that is, the main computing task, was divided into small task packages, which the central software module distributed over the network of servers in the cluster. The servers used CUDA technology, which allows to use the computing power of graphics processors for calculations. The time required to calculate a single model is reduced in proportion to the number of servers in a cluster, since computing tasks are perfectly parallelized, and all servers are 100% loaded.
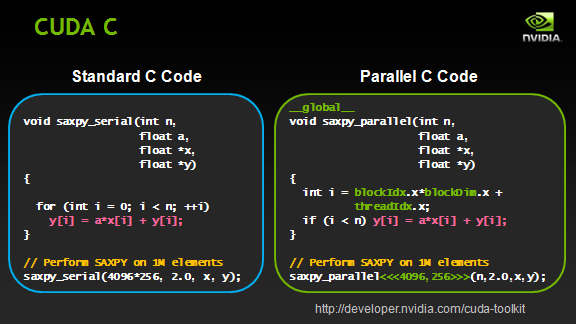
The CUDA architecture is applicable not only for high-performance graphics computing, but also for various scientific computing using nVidia graphics cards. Scientists and researchers make extensive use of CUDA in various fields, including astrophysics, computational biology and chemistry, fluid dynamics modeling, electromagnetic interactions, computed tomography, seismic analysis, and much more. CUDA has the ability to connect to applications using OpenGL and Direct3D. CUDA is cross-platform software for operating systems such as Linux, Mac OS X and Windows.
In our project, CUDA is used for the main process - reconstruction of volumetric data from projections. Since GPUs have a specialized instruction set, the reconstruction calculations fit well on graphics cards through CUDA technology. On a CPU, this task is solved longer, both at the development stage and at the execution stage.
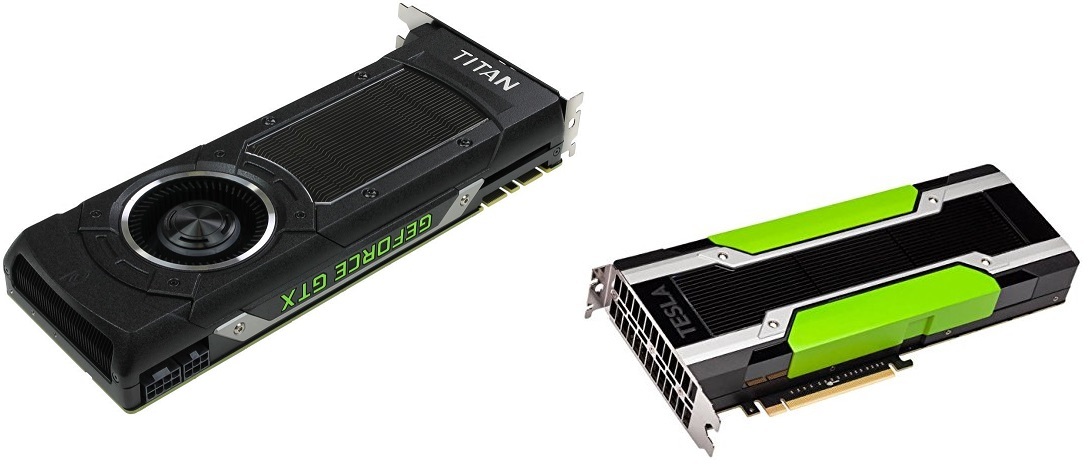
Cards supported by our software:
- Nvidia Tesla K80 24GB (scientific);
- EVGA GeForce GTX TITAN X 12GB (gaming).
The task stipulated that the software should work in the environment of Microsoft Windows XP / Vista / 7, Linux. In this regard, the cross-platform solution was laid initially. C ++ / Qt was chosen as the development language, which allowed us to have a single source code and build software for different operating systems.
Video

More projects:
How to create software for a microtomograph for 5233 man-hours
SDK for the introduction of support for e-books in FB2 format
Control access to electronic documents. From DefView to Vivaldi
Integrating two video surveillance systems: Axxon Next and SureView
Read more about the development of x-ray tomograph software
Sphere: how to monitor billions of kilowatt-hours
Developing a simple plugin for JIRA to work with a database
To help DevOps: a firmware builder for network devices on Debian for 1008 hours
Windows Service Auto Update for Poor AWS
Source: https://habr.com/ru/post/273295/
All Articles