Intel GPA and Android gaming performance improvement
The competition in the mobile entertainment market is huge. Fans of games, when they come across “brakes”, do not stint on angry reviews: “How is that? Hardly pulls on my new phone, where should everything fly? In the furnace of the developers! Let's get some quick games! ” Sometimes gamers, of course, go too far, but there is no smoke without fire. And if your new game got a portion of “sweet words”, this is a serious reason to think about improving its performance. And even better when FPS and other such things are on the agenda even before the game enters the market.
This guide presents a step-by-step example of analyzing performance, finding bottlenecks and optimizing graphics output in an Android game that uses OpenGL ES 3.0 . An example of a game that we use in experiments is called “City Racer”. This is a city car racing simulator. Performance analysis of the application is performed using the Intel Graphics Performance Analyzers toolkit (Intel GPA).

Game City Racer
The urban environment and the car are built from about 230,000 polygons (690000 peaks). It applies the overlay of diffuse materials, illuminated by a single source of directional light without shadows. The demonstration materials for this article contain the program code, project files and graphic resources that are necessary to build and run the application. The optimizations considered here can be turned on and off, and the source and advanced versions of the game are presented in the code.
')
At the core of this material is the Intel Graphics Performance Workshop for the 3rd Generation Intel Core Processor (Ivy Bridge) , which comes with the GPA. We transferred the ideas and techniques of this guide to OpenGL ES 3.0.
During the review of the material we will go through the successive steps to optimize the game. At each step, the application is analyzed using GPA tools to find bottlenecks. Then, in order to solve the problem found, we improve the application, after which the performance is measured again - to evaluate the effect of optimization. We stick to the work plan here, which is used in the tutorial found in the Developer's Guide for Intel Processor Graphics .
To build the City Racer game example, Android API 20 and Android NDK 10 are used . Performance analysis is performed using the Intel GPA toolkit.
Intel GPA is compatible with most Android devices. However, from those that are built on the x86 platform, you can get the most detailed information about the profiled metrics.
Looking ahead, we want to note that during the optimization, the graphics performance of City Racer increased by 83%.
The City Racer demonstration game is logically divided into two parts. The first is responsible for the simulation process of auto racing, the second - for the withdrawal of graphics. Simulation of the race includes the simulation of acceleration, braking, turning the car. Here is a system built on the principles of artificial intelligence, responsible for following the route and avoiding collisions. The code implementing this functionality is in the files track.cpp and vehicle.cpp, it is not optimized.
The graphics output components, the second logical part of the game, include code for drawing car models and a game scene using OpenGL ES 3.0. and our own self-developed CPUT engine. The initial version of the code is a typical first attempt to create a working application. Some of the architectural solutions used to write it limit performance.
Model grids and textures are loaded from the Media / defaultScene.scene file. Separate grids are marked according to whether they are part of a scene that is placed in advance, an object that is placed in the game world during the game, or a car, the output parameters of which are calculated during the simulation. In the gaming space, you can use several types of cameras. The main camera follows the car. An additional camera allows the user to freely inspect the scene. Performance analysis and code optimization are aimed at working with the camera that follows the car.
For the purposes of this tutorial, City Racer, when it starts, is in pause mode. This allows you to go through all the profiling steps using identical data sets. You can remove the game from the pause, either by resetting the Pause flag in its interface, or by writing the g_Paused variable to false. This variable can be found at the beginning of the CityRacer.cpp file.
City Racer is a functional, but non-optimized application prototype. In the initial state, it is able to generate a picture that we need, but we are not satisfied with the performance of the output of City Racer graphics. The game has a lot of technical techniques and architectural solutions that limit the speed of visualization. They are similar to those found in a typical game under development. The goal of the optimization phase when creating a game is to search for bottlenecks and eliminate them one by one by modifying the code and re-measuring performance after each change.
Please note that in this tutorial, we’ve covered a small set of improvements that City Racer can undergo. In particular, they concern only the optimization of the source code of the game, and we do not change the resources, such as models and textures. A story about optimizations affecting graphics or other game resources would make our story too cumbersome, so we are not doing this here. However, with the help of Intel GPA, you can identify problems with game resources. When developing and fine-tuning a real game, resource optimization is just as important as code optimization.
The performance values that we give here are obtained on an Android device that has an Intel Atom (Bay Trail) processor. If you repeat our tests, the results may vary, but the relative performance changes should be the same. The game improvement procedures described should result in a comparable performance increase.
The code, its source and improved versions, is in the CityRacer.cpp file. The use of optimizations can be turned on and off in the program interface or by modifying the values of some variables in this file.

Enable and disable optimizations in the game interface
The following code from CityRacer.cpp shows the variables responsible for enabling and disabling optimizations. The state of the code corresponds to the state of the above fragment of the interface.
In the manual, we will describe various optimization techniques. Each variable allows you to switch between optimized and non-optimized code. If you read the manual and simultaneously check what you learned on your device, you can gradually turn on the use of optimized code variants and monitor the performance changes.
The first step is to compile City Racer and install it on an Android device. If your system has a properly configured Android development environment, then everything you need can be done using the buildandroid.bat file, which is located in the CityRacer / Game / Code / Android folder.
After the game is installed on the device, launch Intel GPA Monitor, right-click on the icon in the system notification area and select System Analyzer.
System Analyzer will display a list of platforms to which you can connect. Select your Android x86 device and tap the Connect button.

Choosing a platform for performance analysis
When System Analyzer connects to the device, it displays a list of applications that can be profiled. Select City Racer and wait for the game to launch.

Application List displayed by System Analyzer
When the program starts, click on the frame capture button to take a snapshot of the GPU frame for analysis.

Capture GPU frame for analysis
Open Frame Analyzer for OpenGL and select the frame you just captured City Racer. This will allow to analyze the performance of the GPU in detail.
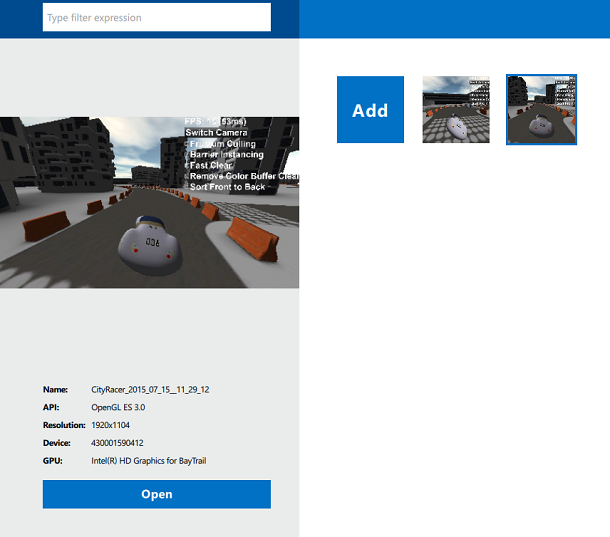
Run Frame Analyzer to test GPU performance
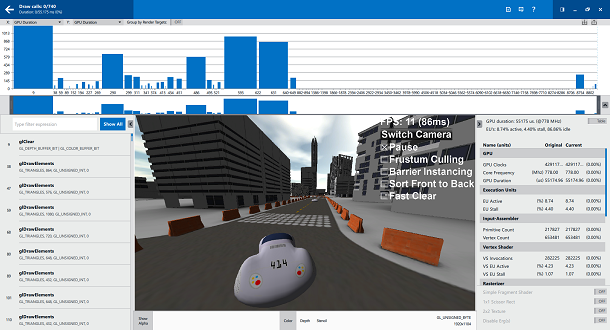
OpenGL Challenge Timeline
On the timeline, which is located in the upper part of the screen, uniformly distributed “ergs” are shown - the units in which the work on image output is measured. Usually they correspond to the OpenGL drawing commands. In order to switch to a more traditional display of the time scale, select the GPU Duration parameter along the X and Y axes. With this setting, we can quickly understand which of the ergs occupy the most time of the video core. This will allow you to figure out exactly what should be focused on optimization efforts. If none of the ergs is selected, the panel on the right displays the total time needed by the GPU to output the frame. In our case, this is 55 ms.
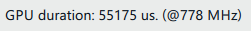
The time required for the GPU to output the frame
Looking at the drawing commands calls, we can find out that the output of many elements is being executed, which, in fact, are not visible on the screen. By changing, when viewing the frame analysis results, the data displayed on the Y axis on Post-Clip Primitives, we can see gaps that help us to understand which drawing calls are wasted because the objects they draw are completely hidden by others. .
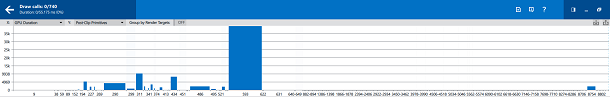
Analysis of the output of objects that are completely covered by other objects
Buildings in City Racer are grouped according to their spatial location. Groups that are not visible, we can not display, without loading the GPU work associated with them. If, in the game interface, you set the Frustum Culling flag, each call to the drawing command, before it is passed to the video core, passes the "visibility check" in the code that is executed on the central processor.
Set the Frustum Culling flag, capture another frame for analysis using System Analyzer and take a look at it using Frame Analyzer.

Analysis of the frame obtained after optimization
Analyzing the frame, we can see that the number of drawing calls has decreased by 22% - from 740 to 576. The total time required for the GPU to output a frame has decreased by 18%.

The number of calls for drawing commands after optimization of clipping on the pyramid of visibility
Frame output time after optimization
Clipping along the visibility pyramid reduces the total number of ergs, however, during the frame analysis, you can observe a large number of small drawing operations (highlighted in yellow). Together, these operations seriously burden the video core.
Small drawing operations
Having figured out which specific objects correspond to small ergs, we found out that their main number falls on the output of concrete blocks, which the route is limited to.
Blocks that make up small drawing operations
You can eliminate most of the unnecessary load on the video core by combining disparate operations to remove blocks in one operation. When the Barrier Instancing flag is set, the drawing of blocks present in the scene is performed as one operation. This eliminates the need for the central processor to send the video core a command to draw each block separately.
If, after turning on the Barrier Instancing flag, capture a frame using System Analyzer and analyze it in Frame Analyzer, you can notice a serious performance increase.

Analysis after optimization of the output of small objects
After analyzing the frame, we see that the number of drawing calls has been reduced by 90%, namely, from 576 to 60.

Drawing commands before optimization
Drawing commands calls after optimization
Now the total video core operation time required for frame output has been reduced by 71%, to 13 ms.
Frame output time after optimization
The term “overdraw” refers to the repeated drawing of the same pixels of the resulting image. Pixel redrawing can affect the pixel fill rate and increase the frame output time. After examining the Samples Written metric, we can see that each pixel of the image in each frame is redrawn, on average, 1.8 times (Resolution / Samples Written).
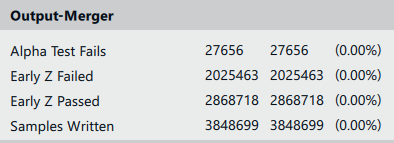
Samples Written before optimization
Sorting drawing calls from close to distant objects is a fairly simple way to reduce the redraw effect. With this approach, the video core pipeline will not redraw the pixels displayed in the previous step.
Set the flag Sort Front to Back, capture a frame using System Analyzer and analyze it using Frame Analyzer.

Analysis of the results of the application of sorting call drawing commands
As a result, the Samples Written metric has decreased by 6%, and the operating time of the GPU has decreased by 8%.

Samples Written after optimization

Frame output time after optimization
Studying the timeline, we noticed that the very first erg requires maximum GPU time for one operation. Having selected it, we see that this is not a call to the draw command, but a call to the glClear screen cleaning command.

First erg
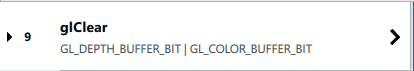
Action performed in the first erg
The video core from Intel has a built-in ability to perform the so-called "quick cleaning". It takes a small portion of the time required for standard cleaning. Quick cleanup can be performed by using black or white when calling glClearColor, which are set, respectively, as (0, 0, 0, 0) or (1, 1, 1, 1).
Set the Fast Clear flag and perform the traditional procedure for capturing a frame using System Analyzer and its analysis using Frame Analyzer.
Frame analysis after using fast cleanup
After analyzing the frame, we see that the time of the GPU required to perform the cleaning operation has decreased by 87%. Namely, it takes about 1.2 ms for normal cleaning, and only 0.2 for fast cleaning.
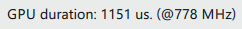
GPU operating time required for routine cleaning

GPU operation time required for fast cleanup
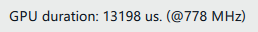
As a result, the total frame output time was reduced by 24% - to 9.2 ms.

GPU total running time
We took a typical mobile game that is in early development. The game was analyzed using Intel GPA and made changes to the code, designed to increase performance. We summarize the results of the various stages of optimization in the table.
When evaluating any performance test results, you should consider that test software and workloads can be optimized, for example, only for Intel processors. Test applications, such as SYSmark and MobileMark, calculate performance metrics based on measurements taken on specific computing systems. Anything can affect the results: the components of these systems, the installed software, and the test suite itself, and their sequence as well.
Any change to each of these factors may lead to a change in the test results. Therefore, taking on the basis of information from test reports any decisions, for example, on the purchase of equipment, you should collect as much information from various sources as possible. It is necessary to take into account that, for example, tests of the processor “A”, working in tandem with the operational memory “B”, may differ from the tests of the same processor in the system in which the memory “C” is installed. To learn more about system performance, look here .
If we sum up all the optimizations applied to City Racer, it turns out that the frame rate has increased by 300% - from 11 frames per second - to 44. Looking at this result, it is worth remembering that we started with a very non-optimal application from the beginning. Therefore, if we use the same chain of improvements that we have brought here in a real project, the performance gain may not be as significant.
Mobile game, of course, is not only performance. But no matter how ingenious the idea, no matter how well the game balance is calculated, no matter how incredible colors the picture shines, a low FPS can kill anything.
We optimized the City Racer training game in this tutorial in order to give you the best weapon to combat the "brakes": recommendations from the Developer's Guide for Intel Processor Graphics and Intel GPA. We wish you five star reviews of your games.
This guide presents a step-by-step example of analyzing performance, finding bottlenecks and optimizing graphics output in an Android game that uses OpenGL ES 3.0 . An example of a game that we use in experiments is called “City Racer”. This is a city car racing simulator. Performance analysis of the application is performed using the Intel Graphics Performance Analyzers toolkit (Intel GPA).
Game City Racer
The urban environment and the car are built from about 230,000 polygons (690000 peaks). It applies the overlay of diffuse materials, illuminated by a single source of directional light without shadows. The demonstration materials for this article contain the program code, project files and graphic resources that are necessary to build and run the application. The optimizations considered here can be turned on and off, and the source and advanced versions of the game are presented in the code.
')
Preliminary Information
At the core of this material is the Intel Graphics Performance Workshop for the 3rd Generation Intel Core Processor (Ivy Bridge) , which comes with the GPA. We transferred the ideas and techniques of this guide to OpenGL ES 3.0.
During the review of the material we will go through the successive steps to optimize the game. At each step, the application is analyzed using GPA tools to find bottlenecks. Then, in order to solve the problem found, we improve the application, after which the performance is measured again - to evaluate the effect of optimization. We stick to the work plan here, which is used in the tutorial found in the Developer's Guide for Intel Processor Graphics .
To build the City Racer game example, Android API 20 and Android NDK 10 are used . Performance analysis is performed using the Intel GPA toolkit.
Intel GPA is compatible with most Android devices. However, from those that are built on the x86 platform, you can get the most detailed information about the profiled metrics.
Looking ahead, we want to note that during the optimization, the graphics performance of City Racer increased by 83%.
About City Racer
The City Racer demonstration game is logically divided into two parts. The first is responsible for the simulation process of auto racing, the second - for the withdrawal of graphics. Simulation of the race includes the simulation of acceleration, braking, turning the car. Here is a system built on the principles of artificial intelligence, responsible for following the route and avoiding collisions. The code implementing this functionality is in the files track.cpp and vehicle.cpp, it is not optimized.
The graphics output components, the second logical part of the game, include code for drawing car models and a game scene using OpenGL ES 3.0. and our own self-developed CPUT engine. The initial version of the code is a typical first attempt to create a working application. Some of the architectural solutions used to write it limit performance.
Model grids and textures are loaded from the Media / defaultScene.scene file. Separate grids are marked according to whether they are part of a scene that is placed in advance, an object that is placed in the game world during the game, or a car, the output parameters of which are calculated during the simulation. In the gaming space, you can use several types of cameras. The main camera follows the car. An additional camera allows the user to freely inspect the scene. Performance analysis and code optimization are aimed at working with the camera that follows the car.
For the purposes of this tutorial, City Racer, when it starts, is in pause mode. This allows you to go through all the profiling steps using identical data sets. You can remove the game from the pause, either by resetting the Pause flag in its interface, or by writing the g_Paused variable to false. This variable can be found at the beginning of the CityRacer.cpp file.
Optimization potential
City Racer is a functional, but non-optimized application prototype. In the initial state, it is able to generate a picture that we need, but we are not satisfied with the performance of the output of City Racer graphics. The game has a lot of technical techniques and architectural solutions that limit the speed of visualization. They are similar to those found in a typical game under development. The goal of the optimization phase when creating a game is to search for bottlenecks and eliminate them one by one by modifying the code and re-measuring performance after each change.
Please note that in this tutorial, we’ve covered a small set of improvements that City Racer can undergo. In particular, they concern only the optimization of the source code of the game, and we do not change the resources, such as models and textures. A story about optimizations affecting graphics or other game resources would make our story too cumbersome, so we are not doing this here. However, with the help of Intel GPA, you can identify problems with game resources. When developing and fine-tuning a real game, resource optimization is just as important as code optimization.
The performance values that we give here are obtained on an Android device that has an Intel Atom (Bay Trail) processor. If you repeat our tests, the results may vary, but the relative performance changes should be the same. The game improvement procedures described should result in a comparable performance increase.
The code, its source and improved versions, is in the CityRacer.cpp file. The use of optimizations can be turned on and off in the program interface or by modifying the values of some variables in this file.
Enable and disable optimizations in the game interface
The following code from CityRacer.cpp shows the variables responsible for enabling and disabling optimizations. The state of the code corresponds to the state of the above fragment of the interface.
bool g_Paused = true; bool g_EnableFrustumCulling = false; bool g_EnableBarrierInstancing = false; bool g_EnableFastClear = false; bool g_DisableColorBufferClear = false; bool g_EnableSorting = false; In the manual, we will describe various optimization techniques. Each variable allows you to switch between optimized and non-optimized code. If you read the manual and simultaneously check what you learned on your device, you can gradually turn on the use of optimized code variants and monitor the performance changes.
Optimization
The first step is to compile City Racer and install it on an Android device. If your system has a properly configured Android development environment, then everything you need can be done using the buildandroid.bat file, which is located in the CityRacer / Game / Code / Android folder.
After the game is installed on the device, launch Intel GPA Monitor, right-click on the icon in the system notification area and select System Analyzer.
System Analyzer will display a list of platforms to which you can connect. Select your Android x86 device and tap the Connect button.
Choosing a platform for performance analysis
When System Analyzer connects to the device, it displays a list of applications that can be profiled. Select City Racer and wait for the game to launch.
Application List displayed by System Analyzer
When the program starts, click on the frame capture button to take a snapshot of the GPU frame for analysis.
Capture GPU frame for analysis
Frame examination
Open Frame Analyzer for OpenGL and select the frame you just captured City Racer. This will allow to analyze the performance of the GPU in detail.
Run Frame Analyzer to test GPU performance
OpenGL Challenge Timeline
On the timeline, which is located in the upper part of the screen, uniformly distributed “ergs” are shown - the units in which the work on image output is measured. Usually they correspond to the OpenGL drawing commands. In order to switch to a more traditional display of the time scale, select the GPU Duration parameter along the X and Y axes. With this setting, we can quickly understand which of the ergs occupy the most time of the video core. This will allow you to figure out exactly what should be focused on optimization efforts. If none of the ergs is selected, the panel on the right displays the total time needed by the GPU to output the frame. In our case, this is 55 ms.
The time required for the GPU to output the frame
Optimization number 1. Clipping on the pyramid of visibility
Looking at the drawing commands calls, we can find out that the output of many elements is being executed, which, in fact, are not visible on the screen. By changing, when viewing the frame analysis results, the data displayed on the Y axis on Post-Clip Primitives, we can see gaps that help us to understand which drawing calls are wasted because the objects they draw are completely hidden by others. .
Analysis of the output of objects that are completely covered by other objects
Buildings in City Racer are grouped according to their spatial location. Groups that are not visible, we can not display, without loading the GPU work associated with them. If, in the game interface, you set the Frustum Culling flag, each call to the drawing command, before it is passed to the video core, passes the "visibility check" in the code that is executed on the central processor.
Set the Frustum Culling flag, capture another frame for analysis using System Analyzer and take a look at it using Frame Analyzer.
Analysis of the frame obtained after optimization
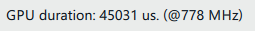
Analyzing the frame, we can see that the number of drawing calls has decreased by 22% - from 740 to 576. The total time required for the GPU to output a frame has decreased by 18%.
The number of calls for drawing commands after optimization of clipping on the pyramid of visibility
Frame output time after optimization
Optimization №2. Output of small objects
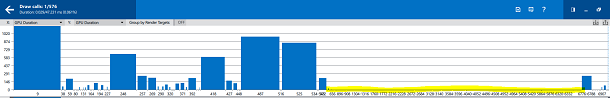
Clipping along the visibility pyramid reduces the total number of ergs, however, during the frame analysis, you can observe a large number of small drawing operations (highlighted in yellow). Together, these operations seriously burden the video core.
Small drawing operations
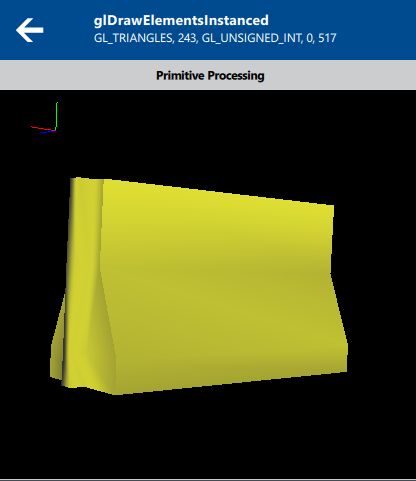
Having figured out which specific objects correspond to small ergs, we found out that their main number falls on the output of concrete blocks, which the route is limited to.
Blocks that make up small drawing operations
You can eliminate most of the unnecessary load on the video core by combining disparate operations to remove blocks in one operation. When the Barrier Instancing flag is set, the drawing of blocks present in the scene is performed as one operation. This eliminates the need for the central processor to send the video core a command to draw each block separately.
If, after turning on the Barrier Instancing flag, capture a frame using System Analyzer and analyze it in Frame Analyzer, you can notice a serious performance increase.
Analysis after optimization of the output of small objects
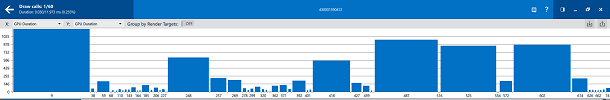
After analyzing the frame, we see that the number of drawing calls has been reduced by 90%, namely, from 576 to 60.
Drawing commands before optimization
Drawing commands calls after optimization
Now the total video core operation time required for frame output has been reduced by 71%, to 13 ms.
Frame output time after optimization
Optimization number 3. Sort objects from close to far
The term “overdraw” refers to the repeated drawing of the same pixels of the resulting image. Pixel redrawing can affect the pixel fill rate and increase the frame output time. After examining the Samples Written metric, we can see that each pixel of the image in each frame is redrawn, on average, 1.8 times (Resolution / Samples Written).
Samples Written before optimization
Sorting drawing calls from close to distant objects is a fairly simple way to reduce the redraw effect. With this approach, the video core pipeline will not redraw the pixels displayed in the previous step.
Set the flag Sort Front to Back, capture a frame using System Analyzer and analyze it using Frame Analyzer.
Analysis of the results of the application of sorting call drawing commands
As a result, the Samples Written metric has decreased by 6%, and the operating time of the GPU has decreased by 8%.
Samples Written after optimization
Frame output time after optimization
Optimization №4. Quick clean
Studying the timeline, we noticed that the very first erg requires maximum GPU time for one operation. Having selected it, we see that this is not a call to the draw command, but a call to the glClear screen cleaning command.
First erg
Action performed in the first erg
The video core from Intel has a built-in ability to perform the so-called "quick cleaning". It takes a small portion of the time required for standard cleaning. Quick cleanup can be performed by using black or white when calling glClearColor, which are set, respectively, as (0, 0, 0, 0) or (1, 1, 1, 1).
Set the Fast Clear flag and perform the traditional procedure for capturing a frame using System Analyzer and its analysis using Frame Analyzer.
Frame analysis after using fast cleanup
After analyzing the frame, we see that the time of the GPU required to perform the cleaning operation has decreased by 87%. Namely, it takes about 1.2 ms for normal cleaning, and only 0.2 for fast cleaning.
GPU operating time required for routine cleaning
GPU operation time required for fast cleanup
As a result, the total frame output time was reduced by 24% - to 9.2 ms.
GPU total running time
findings
We took a typical mobile game that is in early development. The game was analyzed using Intel GPA and made changes to the code, designed to increase performance. We summarize the results of the various stages of optimization in the table.
| Optimization | Before | After | Improvement, in% |
| Clipping on the pyramid of visibility | 55.2 ms | 45.0 ms | 18% |
| Object Output Optimization | 45.0 ms | 13.2 ms | 71% |
| Sort objects | 13.2 ms | 12.1 ms | eight% |
| Quick clean | 12.1 ms | 9,2 ms | 24% |
| Overall GPU optimization result | 55.2 ms | 9,2 ms | 83% |
When evaluating any performance test results, you should consider that test software and workloads can be optimized, for example, only for Intel processors. Test applications, such as SYSmark and MobileMark, calculate performance metrics based on measurements taken on specific computing systems. Anything can affect the results: the components of these systems, the installed software, and the test suite itself, and their sequence as well.
Any change to each of these factors may lead to a change in the test results. Therefore, taking on the basis of information from test reports any decisions, for example, on the purchase of equipment, you should collect as much information from various sources as possible. It is necessary to take into account that, for example, tests of the processor “A”, working in tandem with the operational memory “B”, may differ from the tests of the same processor in the system in which the memory “C” is installed. To learn more about system performance, look here .
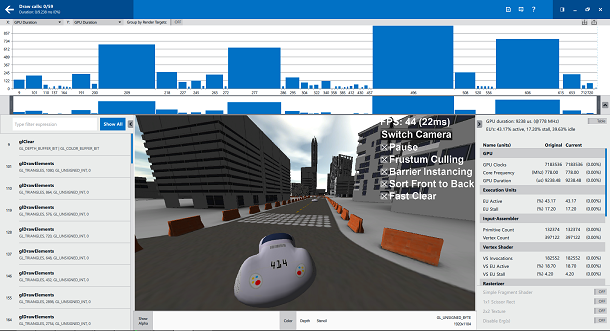
If we sum up all the optimizations applied to City Racer, it turns out that the frame rate has increased by 300% - from 11 frames per second - to 44. Looking at this result, it is worth remembering that we started with a very non-optimal application from the beginning. Therefore, if we use the same chain of improvements that we have brought here in a real project, the performance gain may not be as significant.
Mobile game, of course, is not only performance. But no matter how ingenious the idea, no matter how well the game balance is calculated, no matter how incredible colors the picture shines, a low FPS can kill anything.
We optimized the City Racer training game in this tutorial in order to give you the best weapon to combat the "brakes": recommendations from the Developer's Guide for Intel Processor Graphics and Intel GPA. We wish you five star reviews of your games.
Source: https://habr.com/ru/post/273233/
All Articles