Accelerate your application. PERFMATTERS !.
My rules
Every time I have a performance problem, I follow these rules:
- Always measure - eye optimization is a bad idea. When you have watched the same animation several times, it seems to you that it runs faster. The numbers do not lie. Use the tools I’ll talk about and measure the behavior of your application several times before and after making changes.
- Use slow devices - If you want to find all the weak points, slow devices will help you more. New and productive devices will not show your potential performance problems and not all of your users have top devices.
- Tradeoffs - Performance Optimization entirely consists of tradeoffs. You optimize one in exchange for another. In many cases, this other trade-off can be time spent finding and correcting performance, it can also be the quality of your bitmap images or the amount of data you need to store in a particular data structure. Get ready to sacrifice something.
System Tracing (Systrace)
System tracing is one of the best tools that you may not use. Because developers are not sure what to do with the data that it provides.
System tracing shows an overview of what is happening on the phone. This tool reminds us that the phone that we are holding in our hands is a powerful computer that can do many things at once. In the latest SDK tool updates, this tool has been improved by generating hints from data, helping us to find problems. Let's see what the trace file looks like:
')

You can generate a trace file using the Android Device Monitor tool. For android Studio Tools> Android> Android Device Monitor. For Eclipse Window> Perspectives> DDMS, click the System Trace (Systrace) button on the panel. Set the options and click OK. More detail here .
Interesting Warnings (Alerts) and Frames (Frames), showing tips generated from the collected data. Let's take a look at my tracing and select one of the warnings above:
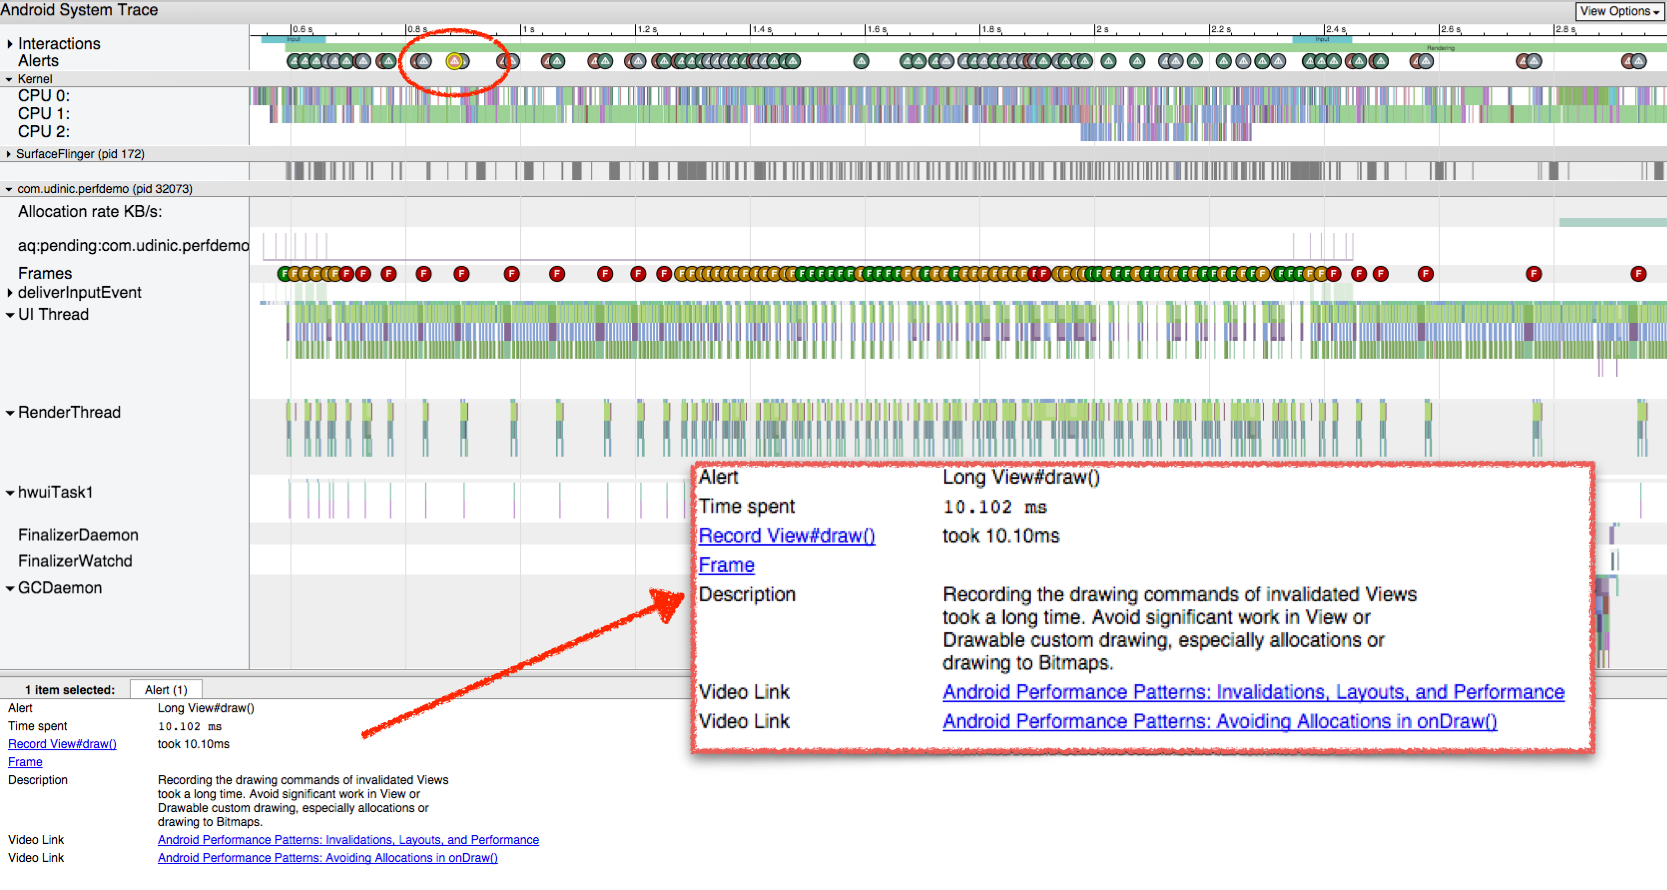
The warning says that there was a long call to View # draw (). We provide a description, links to documentation and even video links on relevant issues.
Looking at the Frames column, we see below the designation of each rendered frame, which is colored green, yellow and red to indicate performance problems during the rendering of this frame. Let's select one of the red frames.
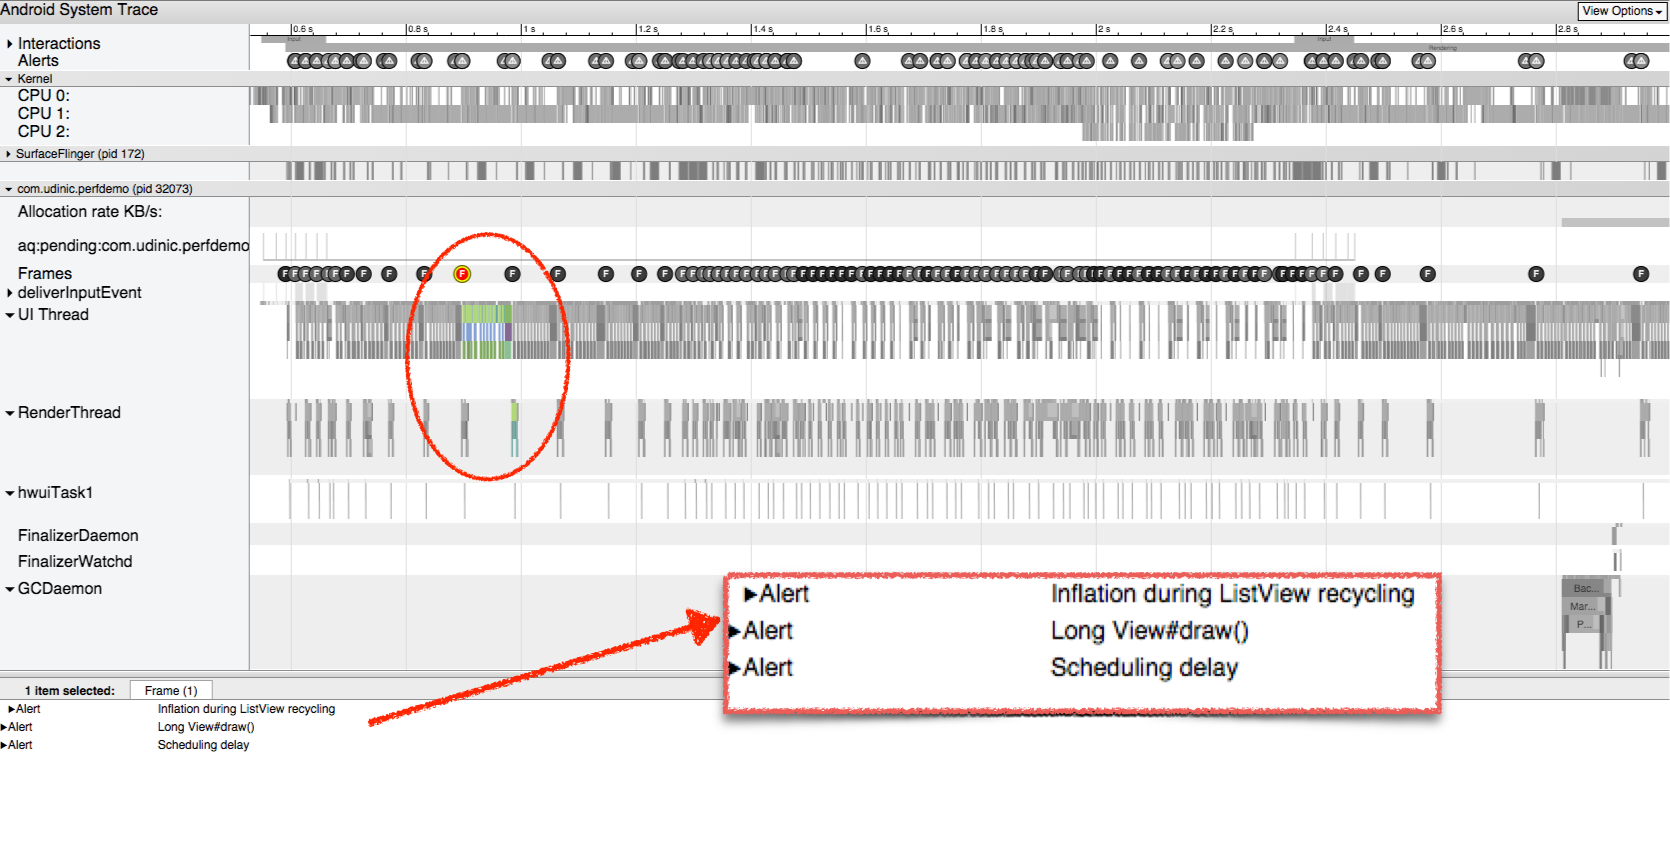
Below we see all the warnings for this frame. They were 3 and one of them we saw earlier. Let's zoom in on this frame and expand the warning below: Filling in during the recycling ListView (“Inflation during ListView recycling”).
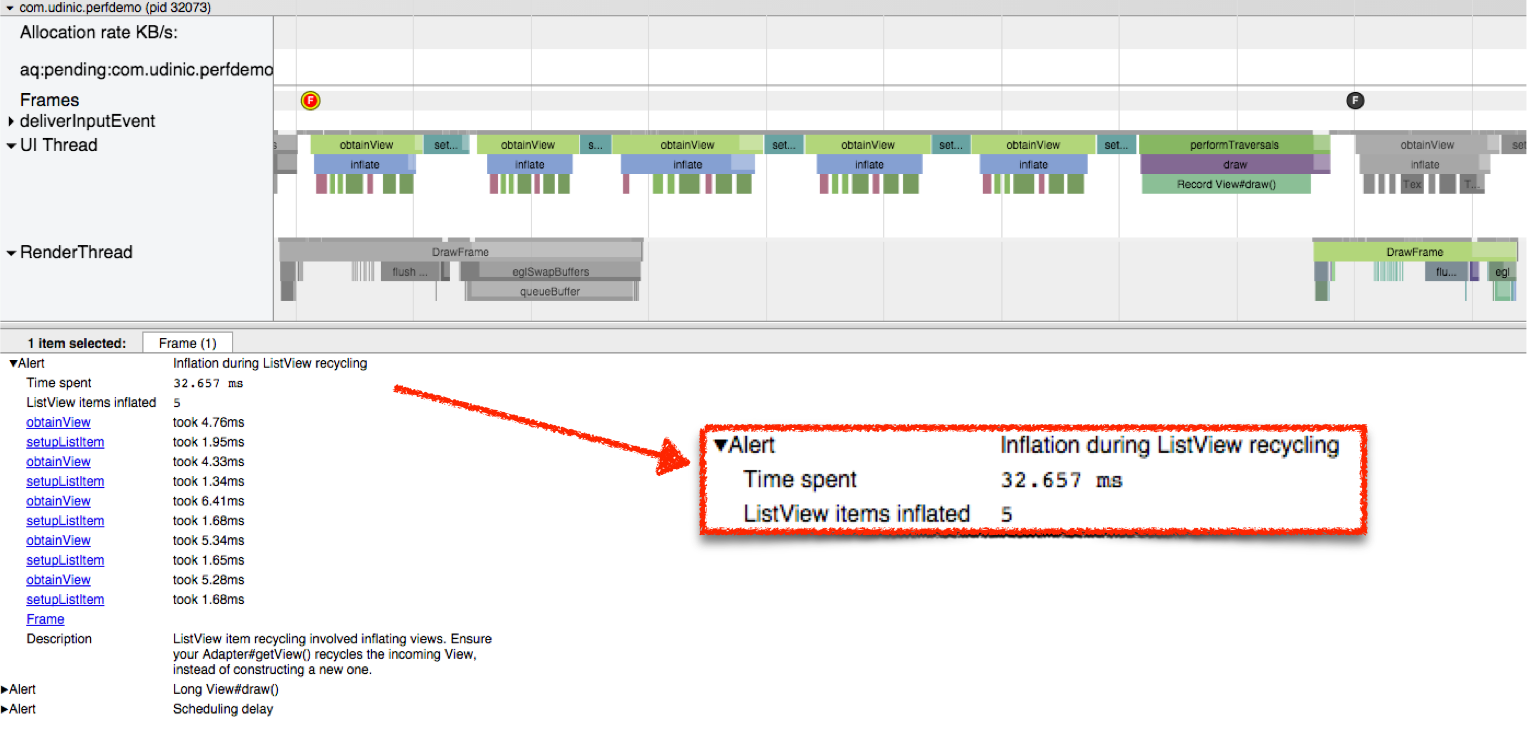
We see that this part was 32 milliseconds, and this is beyond the boundary of 16 milliseconds, the requirement for achieving 60 frames per second. There is more time information for each item in the ListView in this frame — about 6 milliseconds spent on each of the 5 items. The description helps us understand the problem and even provides a solution. On the graph above, we see the entire visualization and we can even increase a piece of the layout filling to view the views that took a lot of time when filling the layout.
Another example of a slowly rendered frame:

After selecting a frame, we can press the m key to highlight it and see how long this part took. Looking up, we see that the rendering of this frame took 19 milliseconds. Expanding the warning, we will see that there was a delay of the schedule (“Scheduling delay”).
Schedule latency means that the thread processing this part did not go to the processor queue for a long time. Consequently, it took more time to complete the work of this thread. Choosing a longer segment in this frame shows more specific information:
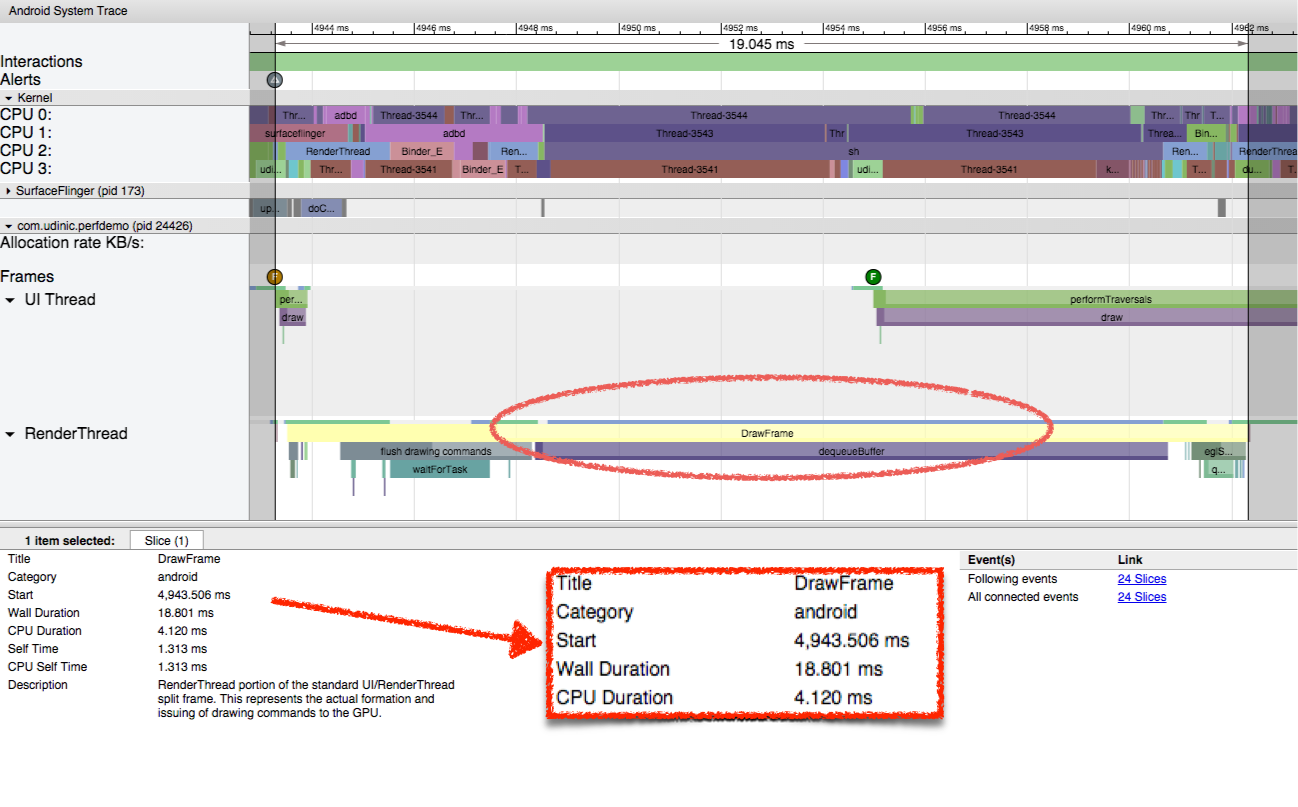
Wall time (Wall duration) is the time elapsed from the beginning to the end of this part of the frame. It is so called because it is like looking at a wall clock from the beginning of the flow.
The processor time is the time spent by the processor on processing this part.
There is a big difference between wall time and processor time. The first took 18 milliseconds, and the second 4 milliseconds. Which is a bit strange, so now is the right time to see what the processor has been doing all this time:

All four cores were pretty busy. Selecting one of the streams shows that the reason is the com.udinic.keepbusyapp application. In this case, another application loaded the processor, refusing to allocate time to our application. This scenario is usually temporary, as other applications in the background do not often take away the work of the processor, these threads can be a different process in your application or even your main thread. Since the System Tracing (Systrace) survey tool is a limit to how far we can go. To find the cause of what loads the processor in our application, we will use another Trace Viewer tool.
View Trace (Traceview)
View Trace analysis tool, showing the running time of each method. Let's see what the trace file looks like:

The tool can be run from Android Device Monitor or from code. More details here. developer.android.com/tools/debugging/debugging-tracing.html
Let's look at the various columns:
Name (Name) - the name and color of the method on the chart.
Inclusive CPU Time (Inclusive CPU Time) - the time the processor processes this method and its children (all the methods it calls)
Exclusive CPU Time - The processor's time for processing this method, excluding the methods called inside it.
Inclusive / exceptional real time (Inclusive / Exclusive Real Time) - time from the beginning to the end of the method operation. Same as wall time in System Trace (Systrace).
Calls + Recursion (Calls + Recursion) - the number of times the method was called and also the number of recursive calls.
Processor / Real time per Call (CPU / Real time Per Call) - average Processor / Real time spent on the method call. Other fields over time show the total time of all method calls.
I opened the application in which the scrolling did not work smoothly and for a long time. I started the tracing, scrolled a little and stopped the tracing. I found the getView () method and opened it, this is what I saw:
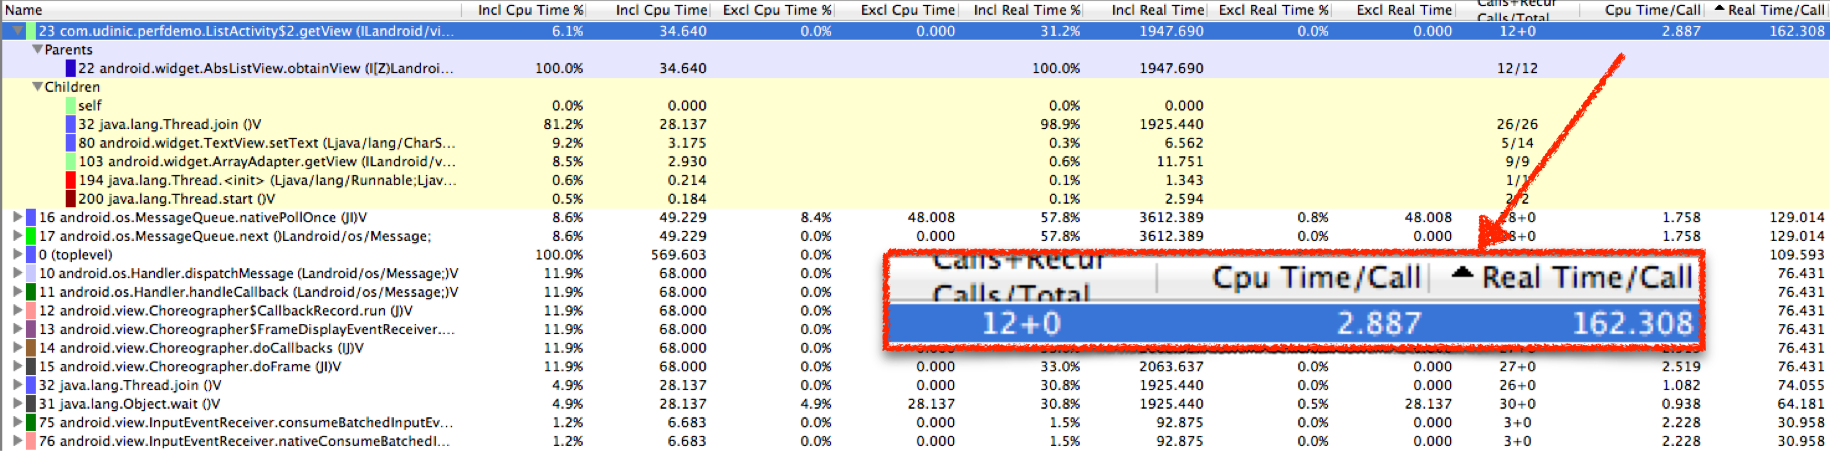
This method was called 12 times, the processor spent about 3ms for each call, but the actual time to complete each call was 162ms! Of course this is a problem ...
Looking at the children of this method, we see the distribution of time between different methods. Thread.join () took 98% of the inclusive time. We use this method when we need to wait for the completion of another thread. One of the other children is Thread.start (), which suggests that the getView () method starts a thread and waits for it to end.
But where is the flow?
We cannot see what this thread did as a child of getView (), since getView () does not do this work directly. To find this, I was looking for a method called Thread.run (), which is called when a new thread starts. I followed on until I found the culprit:

I found out that the time to call the BgService.doWork () method took ~ 14ms, and we have 40 of them! There is a chance that each getView () calls BgService.doWork () more than once and explains why each getView () call takes a long time. This method loads the processor for a long time. Looking at the exceptional processor time, we see that it used 80% of the total time in the trace. Sorting by exceptional processor time is also a good way to find loaded methods in a trace. They may be involved in your performance problem.
The following critical methods, such as getView (), View # onDraw (), and others, help us find the reasons why our application is slow. But sometimes, something else loads the processor, taking away valuable processor cycles, which could be spent on a smoother drawing of our interface. The garbage collector runs arbitrarily, clearing unused objects and usually does not affect the application running in the foreground. If the garbage collector starts up too often, it can cause brakes in the application and maybe this is our fault.
Memory Analysis (Memory Profiling)
Android Studio has been greatly improved lately with a large number of tools to help find performance problems. The Memory tab in the Android window shows the amount of memory allocated in the heap over time. Here's what she looks like:

When we see small drops in the graph, garbage collection occurs, removing unused objects and freeing up space on the heap.
On the left side of the chart, there are two tools available: Heap Dump and Memory Allocation Tracker.
Heap dump
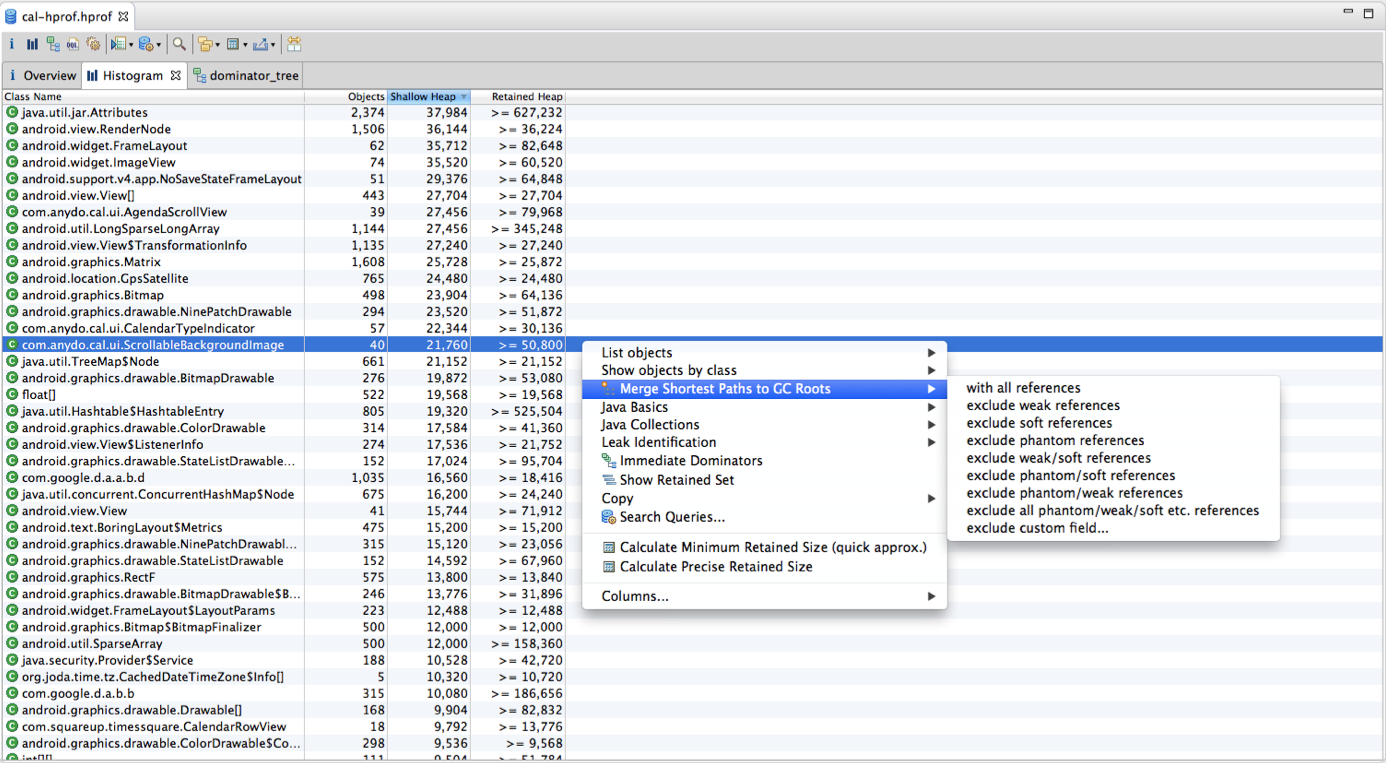
In order to consider what is now in the heap, we can use the heap dump button. As a result, a snapshot of what is now in the heap is made, and it will show it in a special report screen in Android Studio:

On the left, we see a histogram of instances on the heap, grouped by class name. For each instance, there is the number of objects in memory, the size of these instances (Shallow size) and the size of these objects stored in memory. The latter tells us how much memory can be freed if these instances are released. This view shows the amount of memory in our application, helping us identify large data structures and object associations. This information can help us create more efficient data structures, freeing object connections to reduce allocated memory, and ultimately, reducing memory as much as possible.
Looking at the histogram, we see that MemoryActivity has 39 instances, which is strange for activity. Selecting one of the instances on the right, we will see all the links to this instance in the Link Tree below.

One of these is part of an array of the ListenersManager object. Looking at other instances of activity, we see that all of them are held by this object. This explains why a single object of this class takes up so much memory.

Such situations are commonly called Memory Leaks, since the activities were cleanly destroyed and this unused memory cannot be removed by the garbage collector due to this link. We can avoid such situations by making sure that our objects are not referenced by other objects that exist longer. In this situation, the ListenersManager should not keep this link after the activity has been destroyed. The solution will be to remove this link before the activity is destroyed, in the onDestory () callback method.
Memory leaks and other large objects take up a lot of space on the heap, reducing the available memory; as a result, the garbage collector will trigger a lot of events to attempt to free memory. These garbage collector events take up the processor, which causes performance degradation in your application. If the amount of available memory is not enough for the application and the heap can no longer grow, there will be a more dramatic result - OutOfMemoryException, which causes your application to crash.
More advanced Eclipse Memory Analyzer Tool (Eclipse Memory Analyzer Tool):
This tool can do the same as Android Studio, as well as identify potential memory leaks and provide an improved instance search, such as searching for all Raster images of more than 2Mb in size, or all empty Rect objects .
Another great tool is the LeakCanary library, which ensures that your objects do not have leaks. You will receive a reminder of what happened and where.

Memory Allocation Tracker
The memory allocation tracker is started / stopped using other buttons to the left of the memory graph. It will generate a report of all instances located in memory during this time interval, grouped by class.
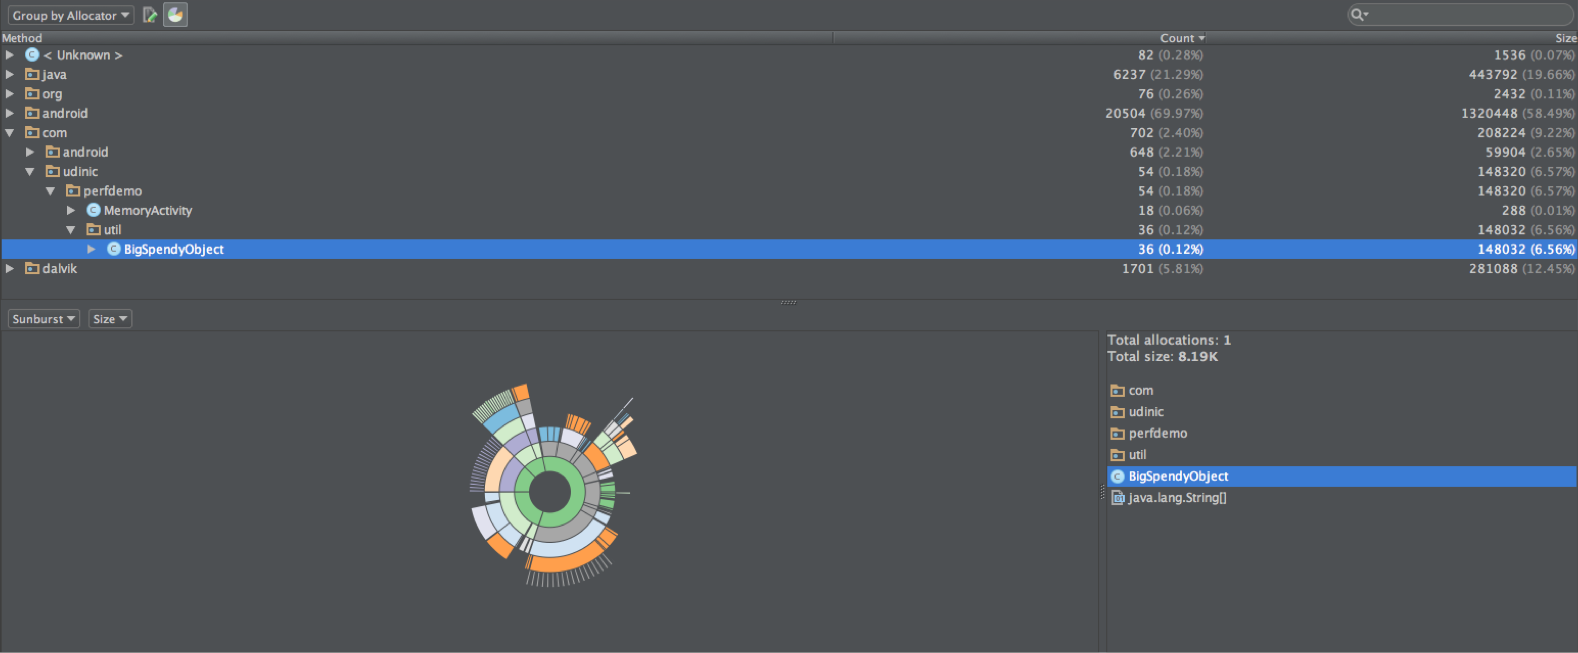
or by the method:
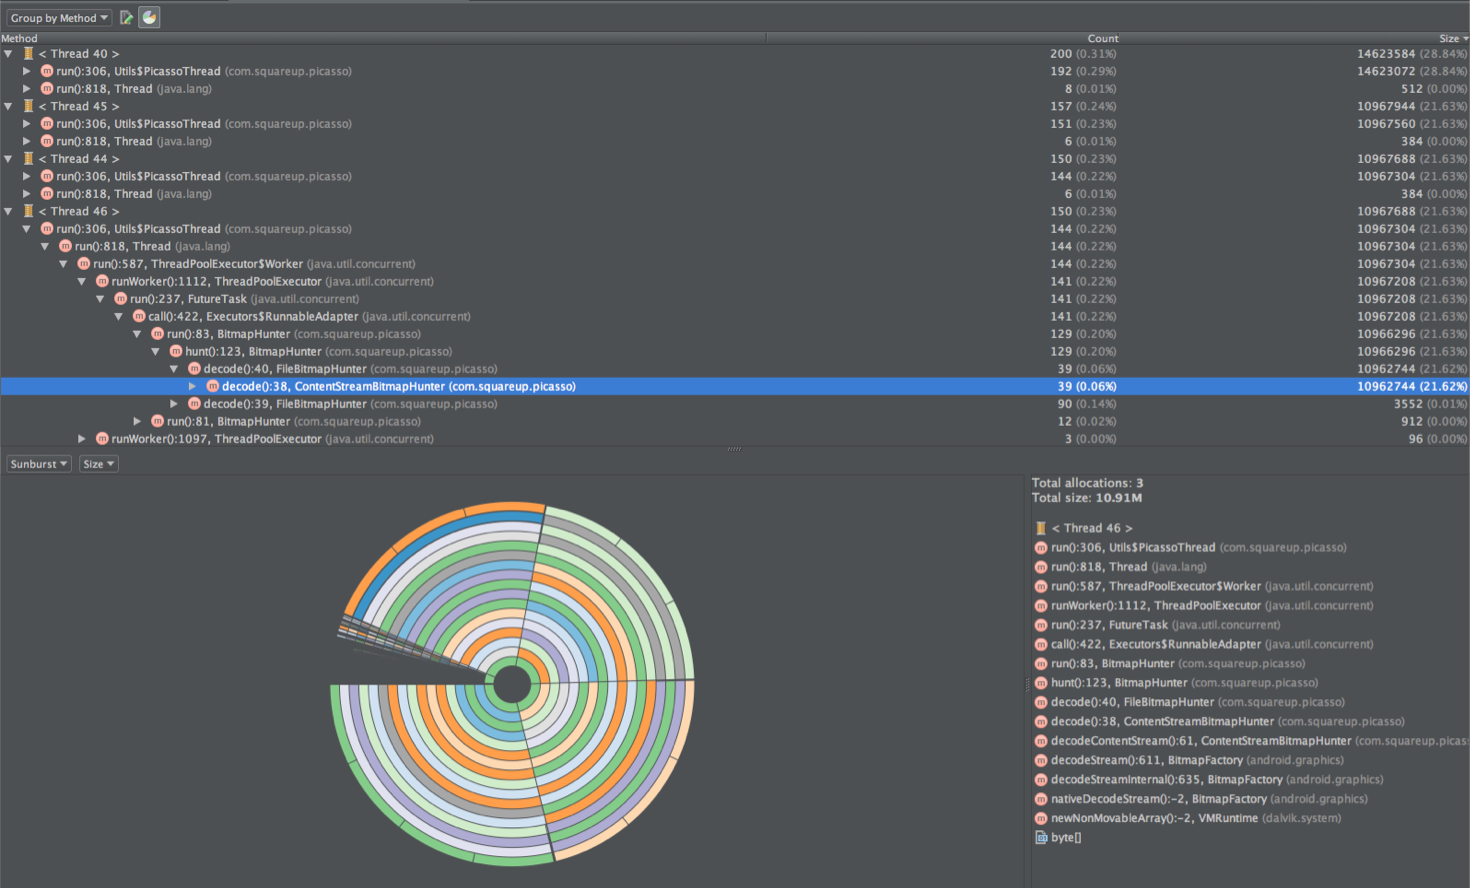
There is also a good visualization showing the largest instances in memory. Using this information, we can find time-critical methods for which too much memory is allocated and they can trigger many garbage collector events. We can also find many instances of a single class with a short lifespan, where we can decide to use a queue of objects to reduce the total number of memory allocations.
General memory tips
Here are some quick tips / tutorials that I use when writing code:
Enums are a hot topic for performance discussions. There is a Video about it, showing the size of the enumeration, and a discussion of this video and some information in it that is misleading. Do enumerations take up more memory than regular constants? Of course. This is bad? Not necessary. If you are writing a library and you need strict type safety, this may justify the use of enumerations instead of other solutions, such as @IntDef . If you just have a bunch of constants that can be grouped together, then it may not be wise to use for this enumeration. As always, there is a trade-off that needs to be taken into account when you make a decision.
Auto-boxing - auto-packaging is an automatic conversion from primitive types to their object representation (for example, int -> Integer). Every time a primitive type is “packed” into an object representation, a new object is created (shock, I know). If we have a lot of them, the garbage collector runs more often. It is easy to skip the number of auto-packages that occur, because for us this happens automatically when an object of a primitive type is assigned. The solution is to be consistent with these types. If you use primitive types everywhere in your application, try to avoid their unreasonable autopacking. You can use memory analysis tools to find many objects representing primitive types. You can also use Trace Browsing and search for Integer.valueOf (), Long.valueOf (), etc.
HashMap vs. ArrayMap / Sparse * Array - as well as the problem of autopacking, using HashMap requires us to use objects as keys. If we use the primitive type “int” in the application and it auto-package in Integer when interacting with HashMap, maybe we can just use SparseIntArray. In case we still need keys in the form of objects, we can use the ArrayMap class. It is similar to HashMap, but it works differently inside , using memory more efficiently, but reducing its speed. These two options have less memory than HashMap, but it takes more time to get items or allocate memory than HashMap. If you have less than 1000 items, the difference is not noticeable when the program is executed, which makes them not a bad option for your use of key / value pairs.
Context Awareness - as shown earlier, it is easy to create a memory leak in activities. You may not be surprised that the activity is the most common case of leaks to Android (!). Also, these leaks are very expensive, as they contain the entire hierarchy of the user interface, which in itself can take up a lot of space. Many operations on the platform require a Context object, and you usually send an Activity. Make sure you understand what is happening with this Activity. If the link to it is cached, and this object lives longer than the Activity itself, without removing this link, then you have a memory leak.
Avoid non-static inner classes ; their initialization creates an implicit reference not an outer class. If an instance of an inner class object needs more time than an outer one, then the outer class will remain in memory, even if it is no longer needed. For example, creating a non-static class in the Activity class that is inherited from AsyncTask, then launch AsyncTask, and during its operation kill activity. This AsyncTask will keep this activity until it finishes its work. Decision- do not do so, declare a static inner class if necessary.
Graphic Processor Analysis (GPU Profiling)
A new addition to Android Studio 1.4, a tool for analyzing graphics processor rendering.
In the Android window, go to the GPU tab, and you will see a graph showing the time each frame is drawn on your screen:

Each bar on the graph represents one rendered frame, and the colors represent different phases in the drawing process:
Drawing (blue) - represents the View # onDraw () method. This part creates / updates DisplayList objects (In Wikipedia, the display list (or display file) is a sequence of graphic commands that define the output image that is later converted to OpenGL commands that the graphics processor understands. Large values may be due to complex views that require more time to create their display lists, or if many views are canceled in a short amount of time.
UI Thread Prep The UI Prepare (purple) - In Lollipop Preparation (purple) - another stream has been added to Lollipop to help the interface flow draw the interface faster. This thread is called RenderThread. He is responsible for converting display lists to OpenGL commands and sending them to a graphics processor. At this time, the UI thread can continue processing the next frame. In this step, the time is shown for which the UI thread transfers all resources to the RenderThread stream. If we have a lot of resources to transfer, for example, many display lists or they are large, this step may take longer.
Process (red) —execute display lists to create OpenGL commands. This step may take longer if there are a lot of display lists or display lists that are complex, due to the need to redraw many views. A view can be redrawn due to a cancellation, or it appears when the imposed view shifts.
Execution (yellow) - sending OpenGL commands to the graphics processor. This part is a blocking call, since the processor sends a buffer with these commands to the graphics processor, expecting to get a clean buffer for the next frame. The number of buffers is limited, and if the graphics processor is too busy, the processor will wait for the graphics processor to become free. Therefore, if at this step we see large values, perhaps this means that the graphics processor was too busy drawing our interface, which is probably too difficult to draw in a short time.
In Marshmallow, more colors have been added to indicate new steps, such as Measurement / Layout, input processing, and others:

But before using this feature, you must enable graphics processor drawing from developer options:
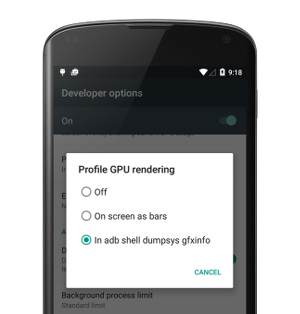
This will allow the tool to use ADB commands to get the necessary information, so we use:
adb shell dumpsys gfxinfo <PACKAGE_NAME>
We can get all of this data and ourselves make a schedule. The command shows other useful information, such as the number of views in the hierarchy, the size of all display lists, and more. In Marshmallow, we can see even more statistics.
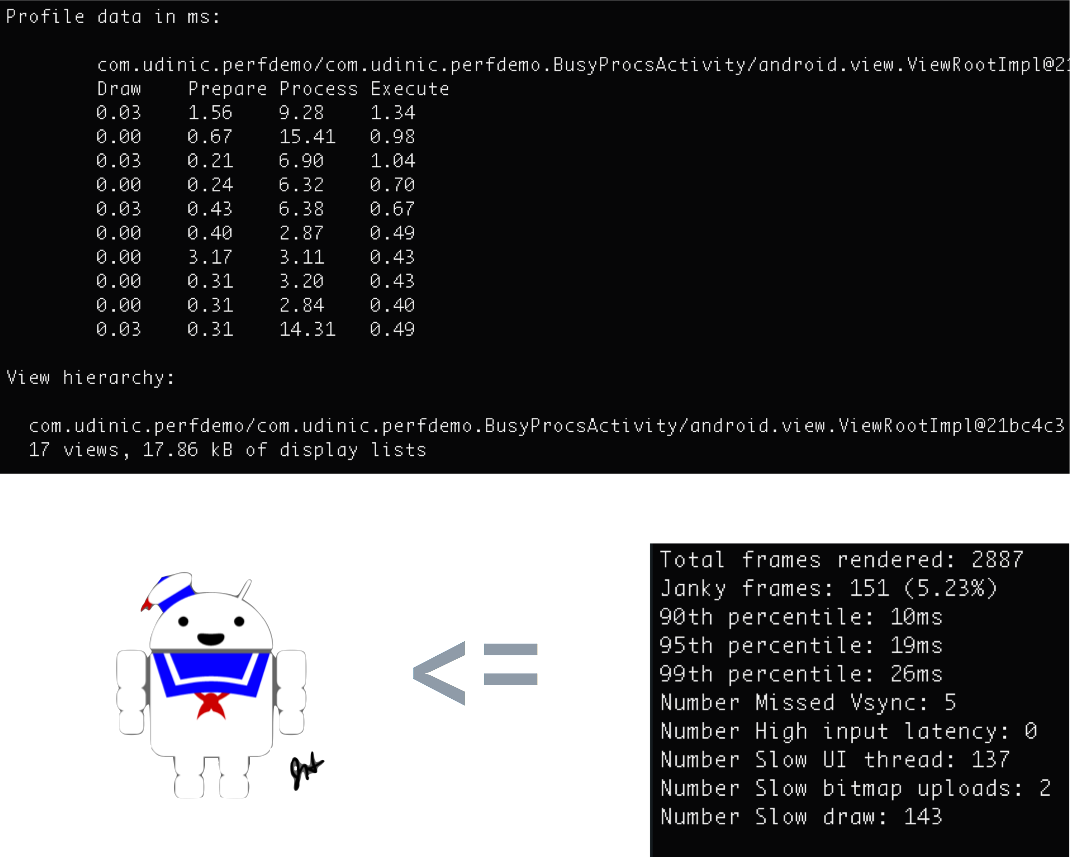
If we have an automatic interface testing, we can make our build server run this command after certain interactions (list scrolling, heavy animations, etc.) and see if there are changes in values over time, such as redundant frames. This can help identify performance problems after pushing some commits, giving us time to identify the problem before the application goes into production. We can even get more accurate rendering information using the “framestats” keyword, as explained here .
But this is not the only way to see this chart!
As you saw in the developer options in the “Profile GPU Rendering” section, there is an option to view the graph as “Stripes on the screen”. Turning it on will show a graph for each window on our screen, along with a green bar to determine the threshold of 16 ms.

In the example to the right, we see some frames crossed the green line, which means that it took more than 16ms to draw them. So on these strips the blue color prevails, we understand that either there were many views for drawing or they were complex or both. In this scenario, I scrolled through a list of news feeds that support various types of views. Some views have been canceled, and some are harder to draw than others. A possible reason for some frames to cross this threshold is that there is a complex view to render at the moment.
Hierarchy Viewer
I love this tool, and it saddens me that many do not use it at all!
Using the Hierarchy Browser, we can get performance statistics, see the full view hierarchy on the screen, and have access to all view properties. You can also get a dump of the theme data, see all the values used for each style attribute, but this is only available when you launch the Hierarchy Browser as a separate application, not from the Android Monitor. I use this tool when designing my layouts and when I want to optimize them.

In the center we see a tree representing the hierarchy of views. The view hierarchy may be broad, but if it is too deep (about 10 levels), the cost may be costly layout / metering phases. Whenever a view is measured, in View # onMeasure () or when it has all child views, in View # onLayout (), these commands apply to child views that repeat the same actions. Some layouts repeat each step twice, for example, RelativeLayout and some LinearLayout configurations, and if they are nested, the number of passes increases exponentially.
Below on the right we see the “drawing” of our layout, marking the location of each view. We can select a view here or in a tree and see all its properties on the left.
When I create a layout, sometimes I'm not sure why a particular view ended where it is now. Using this tool, I can track it in the tree, select it and see where it is in the preview window. Looking at the final measurements of the views on the screen, I can create interesting animations and use this information to move things neatly. I can find lost views that other views have inadvertently overlapped with, and much more.
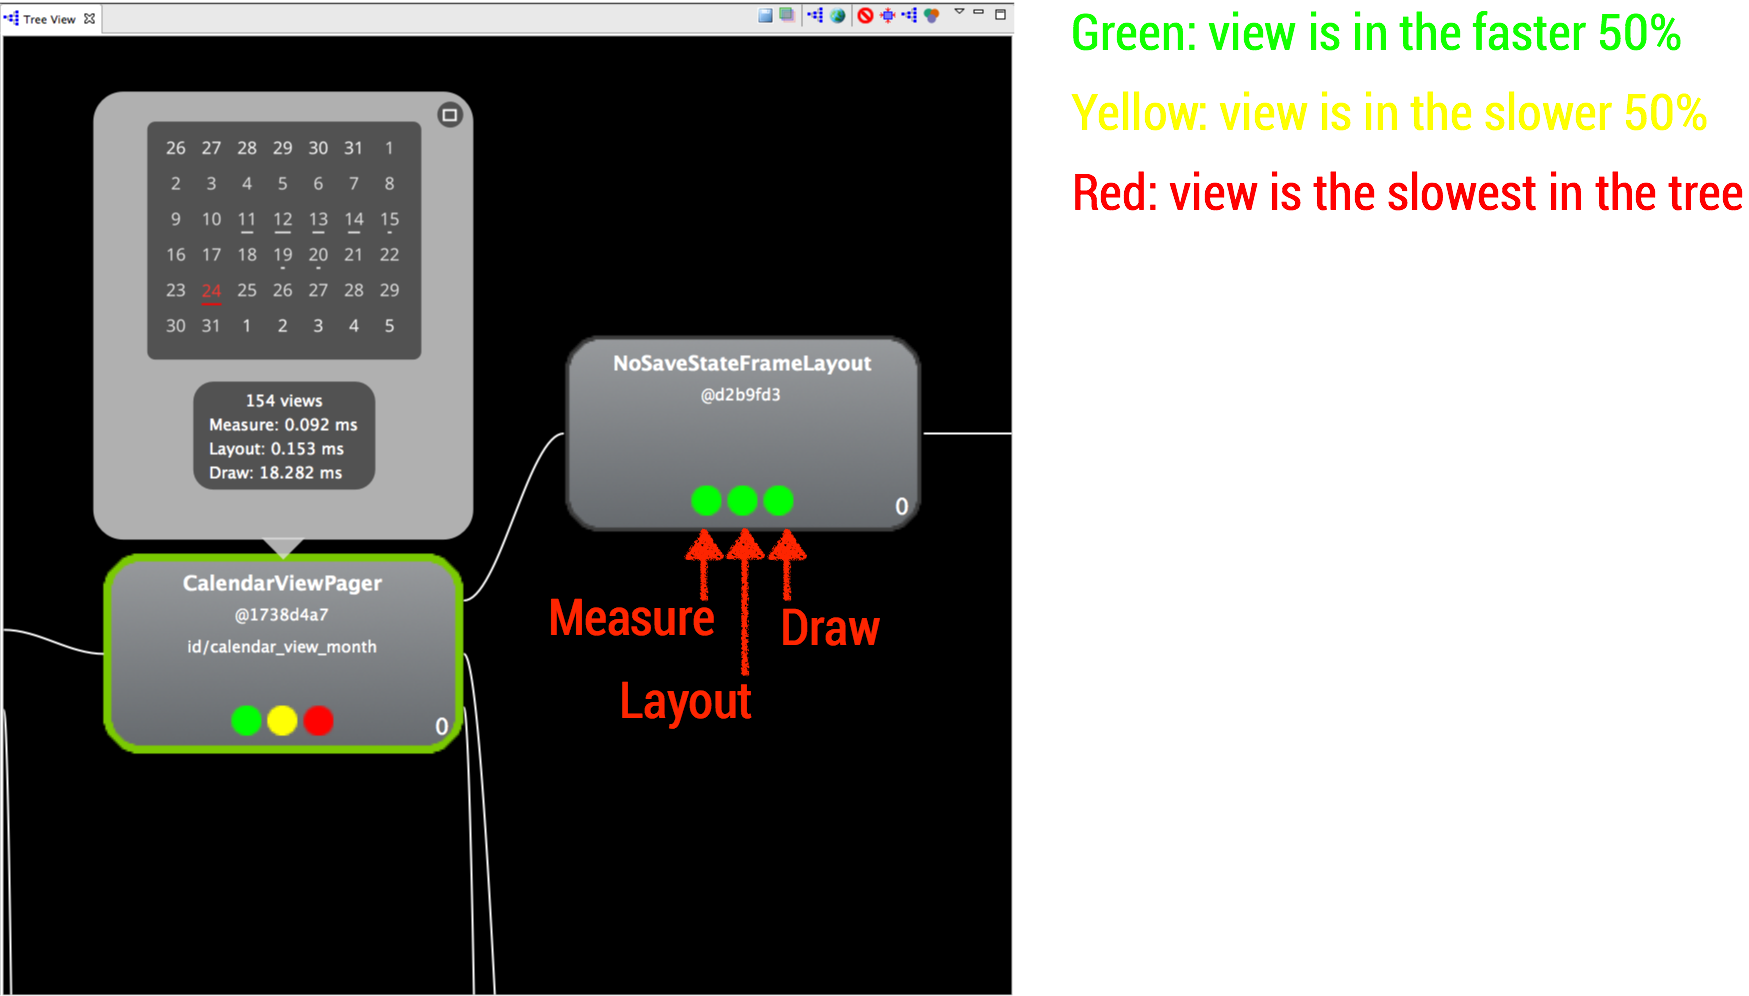
For each view, we have the time of its measurement / layout / rendering and all its child views. The colors indicate how this view is presented compared to other views in the tree; this is a good way to find the weakest link. Since we also see a preview of this view, we can walk around the tree in steps to create it, finding redundant steps that we can remove. One of the things that have a big impact on performance is called Overdraw.
Overdraw
As you saw in the Graphical Processor Analysis GPU (Profiling) section - phase The execution represented in yellow on the graph may take longer to complete if the graphics processor needs to draw a lot of objects on the screen, increasing the rendering time of each frame. Overlays occur when we draw one on top of another, for example a yellow button on a red background. The graphics processor must first draw a red background and then a yellow button on top, making overlaying inevitable. If we have many layers of overlay, this causes the graphics processor to work more and be farther from the target of 16 ms.

Using the item “Debugging GPU Overlays” in the Developer options, all overlays will be colored to indicate the complexity of the overlay in this area. Overlaying 1x / 2x is normal, even some light red areas are fine, but if we see too much red on the screen, this can be a problem. Let's look at a few examples:

In the example on the left, the list is drawn in green, which is usually good, but there is an overlay on top that makes it red and this is a problem. In the example on the right, the entire list is in red. In both cases, there is an opaque list with a 2x / 3x overlay. These overlays can be in case there is a full-screen background color in the window containing your Activity / Fragment, list and and each list item. This problem can be solved by setting the background color for only one of them.
Note: The default theme declares a full-screen background color for your window. If your activity has an opaque layout that occupies the entire screen, you can remove the background of the window to remove a single overlay layer. You can do this in a thread or in code by calling getWindow (). SetBackgroundDrawable (null) in onCreate ().
Using the Hierarchy Browser, you can export all layers of the hierarchy to a PSD file and open it in Photoshop. Examining the different layers in Photoshop will reveal all the overlays in the layout. Use this information to remove redundant overlays, and do not be content with green, seek blue!
Alpha
The use of transparency can affect performance in order to understand why, let's see what happens when the alpha view is set. Consider the following layout:

We see a layout containing 3 ImageViews superimposed on each other. In the direct / simple implementation, setting the alpha using the setAlpha () command is passed to all child views, ImageViews in this case. Then, these ImageViews will be drawn with this alpha value in the frame buffer. Result:

We did not want to see it.
As the ImageView is rendered with the alpha value, all the overlay images are mixed together. Fortunately, the operating system has a solution to this problem. The layout will be copied to an off-screen buffer, alpha will be applied to the entire buffer and the result will be copied to the frame buffer. Result:

But we paid the price for it.
Drawing a view in an off-screen buffer, before drawing it in the frame buffer, is the virtual addition of another undefined overlay layer. The operating system does not know exactly when to apply this approach or the direct approach shown earlier, thus making the default more complex. But there are still ways to set the alpha and avoid the complexity added by the screen buffer:
- TextViews - Use setTextColor () instead of setAlpha (). Using the alpha channel for the text color leads to a direct drawing of the text using this channel.
- ImageView - Use setImageAlpha () instead of setAlpha (). Same reason as for TextView.
- — , . , . hasOverlappingRendering() false, / . , onSetAlpha() true.
(Hardware Acceleration)
When the hardware acceleration was introduced in Honeycomb, we had a new drawing model for drawing our application on the screen. It introduced DisplayList structures that write view drawing commands for fast rendering. But there is another super feature that developers sometimes miss or do not use correctly - the View layers.
Using the view layer, we can draw the view in an off-screen buffer (as you saw earlier using the Alpha channel) and process as needed. This feature is mainly good for animations, since we can animate complex views faster. Without animation layers, the view cancels it after changing the animated property (for example, x coordinates, scale, alpha value, etc.). For complex views, this cancellation is sent to all child views, and they will then redraw themselves by performing an expensive operation. I use the layer of the view provided by the Hardware, the texture for our view is created in the graphics processor. There are several operations that we can apply to this texture without canceling it, such as x / y position, rotation, alpha, and others. It all meansthat we can animate a complex view without even canceling it during the animation! This makes the animation smoother. Here is an example of how to do this:
// Object animator view.setLayerType(View.LAYER_TYPE_HARDWARE, null); ObjectAnimator objectAnimator = ObjectAnimator.ofFloat(view, View.TRANSLATION_X, 20f); objectAnimator.addListener(new AnimatorListenerAdapter() { @Override public void onAnimationEnd(Animator animation) { view.setLayerType(View.LAYER_TYPE_NONE, null); } }); objectAnimator.start(); // (Property animator) view.animate().translationX(20f).withLayer().start(); Really simple?
Yes, but you need to remember a few things when using hardware layers:
- Clean up your view - hardware layers consume space on your graphics processor, a component with limited memory. Try and use them only when they are needed, for example, in animation, and then clean them. In the ObjectAnimator example above, I applied a listener to remove the layer after the animation ends. In the example of the animator Properties, I used the withLayers () method, which automatically creates a layer at the beginning and deletes it at the end of the animation.
- If you change your view after applying a hardware layer, it will invalidate the hardware layer and re-draw the entire view into the external screen buffer. This will happen after changing a property that is not optimized for hardware layers (the following are now optimized: rotation, scaling, x / y, movement, rotation point and alpha. For example, if you animate a view with support for the application layer, changing the background color during its movement along screen, will lead to constant updates of the hardware layer. Updating the hardware layer has overhead costs, from which you probably should not use it.
For the second problem, there is a way to display these hardware layer updates. Using Developer options, we can enable "Show updates to the hardware layer."

When it is turned on, the View view glows green when the hardware layer is updated. I used it once when my ViewPager didn't scroll as smoothly as I expected. After enabling this developer option, I went ahead and ran the ViewPager, and this is what I saw:

During the entire scroll, both pages were green!
This means that a hardware layer was created for them, and the pages were canceled while scrolling through the ViewPager. I updated the scrolling of pages using the parallax effect on the background and gradually animated objects on the page. However, I did not create a hardware layer for the ViewPager pages. After reading the ViewPager source code, I found that after the user started scrolling, a hardware layer is created for both pages and is deleted after the scrolling stops.
While it makes sense to create a hardware layer for the pages while scrolling, for me it was bad. Usually, these pages do not change when the ViewPager scrolls, and since they can be quite complex, the hardware layers help draw them quickly enough. It was not a case for my application, and I had to remove this hardware level using the small hack I wrote .
The hardware layers are not silver bullet. It is important to understand how they work and how to use them correctly, or you may experience a more significant problem.
DIY (DIY)
While preparing for all these examples, I wrote a lot of code to simulate these situations. You can find weight in this Github repository and also on Google Play . I divided different scenarios into different activities, and documented as far as possible to understand what types of problems you can find using this Activity. Read the Activities javadoc, open the tools and play with the application.
Additional Information
With the development of the Android OS, ways are being developed to optimize your applications. New tools are presented with the Android SDK and new features added to the OS (such as hardware layers). It is important to stay abreast of the latest changes and consider trade-offs before changing something.
YouTube has a super Android Playlist Patterns (Android Performance Templates) , with a large number of short videos from Google’s engineers, explaining various topics related to performance. You can find a comparison of various data structures (HashMap vs ArrayMap), optimization of bitmap images and even optimization of network requests. I highly recommend viewing them all.
Join the Google+ Android Performance Patterns community and talk about performance with others, including Google’s engineers, share ideas, articles and questions.
More interesting links:
- Learn how Architecture Graphics works on Android . it has everything about how Android draws your interface, explaining various system components, such as SurfaceFlinger, and how they communicate with each other. It's a long read, but worth it.
- A conversation with Google IO 2012 , showing how the drawing model works and how the brakes occur when our interface is rendered.
- Talk Android Performance Workshop with Devoxx 2013, showing some of the optimizations made in Android 4.4 for the drawing model, and showing various tools to optimize performance (System tracing, Overlay, etc.)
- Excellent article on Preventative Optimizations , and how they differ from immature (Premature) optimizations. Many developers do not optimize parts of their code, as they think the changes will be minor. One thing to keep in mind is that if everything is folded up, a big problem can arise. If you have the opportunity to optimize a small part that seems insignificant, do not neglect it.
- Memory management in Android is an old video from Google IO 2011, which is still relevant. It shows how Android manages the memory of your applications, and how to use tools like Eclipse MAT to find problems.
- Case study of popular twitter client optimization done by Google engineer Romain Guy. In this case study, Romain shows how to find performance problems in an application, and what he recommends doing to solve them. There is a subsequent post showing the problems of the same application after its alteration.
I hope you now have enough information and confidence to start optimizing your applications today!
Just start by running a trace, or turn on some of the relevant developer options.

Posted by Udi Cohen.
Original blog.udinic.com/2015/09/15/speed-up-your-app
Source: https://habr.com/ru/post/273035/
All Articles