Situation Center of the Central PPK (electric trains of the Moscow Region) - we have done a lot of hell

Testing
In order to provide high quality passenger service and reliable operation of passenger infrastructure, we need good instrumental control. Simply put - a system for removing information and processing it. At some point, the central suburban passenger company (those who take you by train in the Moscow region) wanted a breakthrough in terms of avoiding manual control technologies. The main idea was to create a single think tank in order to monitor, control, understand and predict operational processes, respond quickly to emergency situations.

This is how SATS was integrated into the architecture of the CPPK. Two years on the project. Two years! Vendors are: a module of reference information - Talend MDM. Comprehensive analytics system - Oracle BI 11g, Pentaho DI (open source counterparts - Pentaho BA, Spago BI, JasperSoft BI,), DBMS -MS SQL Server 2012, audio-visual complexes - YCD, Samsung, communication columns - domestic manufacturers, video analytics cameras and video surveillance - Synesis, Samsung, Verint, Axis. IP telephony - Cisco.
')
In general, I’ll show you where we collected the data from and what we did with it. And why the kilometer of the railway in our coordinate grid is replaced by block sections, the length of which can vary from 700 to 1300 meters.
Task center
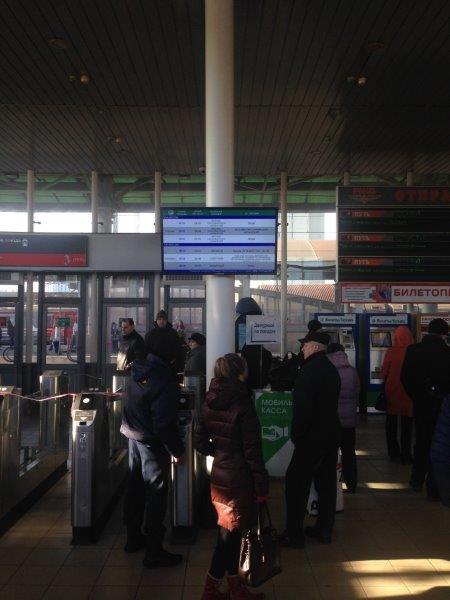
General - to carry out centralized management of passenger service processes and to support operational management decisions aimed at improving the quality of transport services, based on integrated analytics. You could already see the results: a board with a schedule in real time at stations, greatly reduced queues at the box office thanks to video analytics and the development of a network of ticket printing machines, plus the fact that behind the scenes is a lot of infrastructure changes.
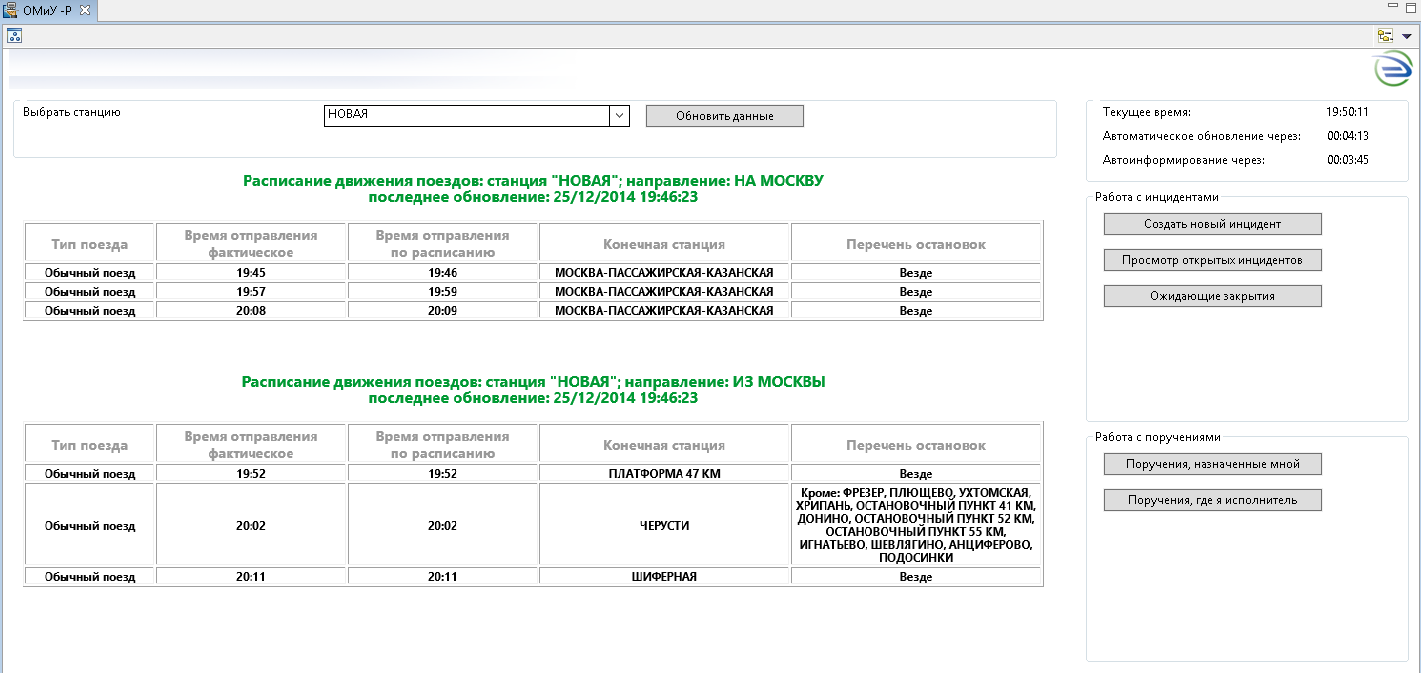
In addition to long-term tasks, there are also those requiring operational solutions. For example, if one of the subsystems reports that the train is delayed, passengers are further along the line immediately warned about being late (there is a separate column for this on the displays). Calculation of deviations from the schedule of movement occurs automatically according to a certain algorithm on the basis of information from the GIS, the Russian Railways dispatch center and the GLONASS / GPS monitoring subsystem.
The implementation of all subsystems — from the dispatch center and informing passengers to infrastructures such as LANs — and writing the data matching logic took two years (and still continues). We laid the cable, mounted the columns, wrote a bunch of analytics software, connected the information exchange, installed the hardware and generally did everything that is done on such large projects. The results are visible not only to the staff of the situational center, but also to the passengers.
Here is what the source is at the entrance
- GPS / GLONASS in trains (the trains of the own CPPK fleet are covered) plus the infrastructure of the Russian Railways. Putting these devices was difficult both organizationally (some trains are on lease, and not owned, the owner is Russian Railways) and physically pure. About how colleagues put these glands, perhaps, we will somehow tell in the next tale of tales. We need these sensors in order to know exactly where the train is. In the distant past, before the appearance of such sensors, all the dispatching was done according to the service signaling of the railway. After the alarm was triggered, in order to monitor the movement of trains, they used to move layouts. The error is 10 minutes, but this is a very reliable system, where there is no “noisy” data.
- Video analytics cameras at stopping points. We fastened a video analyst on dangerous situations on the platform (for example, crossing the edge of the platform). But it is clear that the railway landfill is not very greenhouse conditions: snow ripples, sun glare, shiny trains ... - all this can lead to false positives and requires a long training of algorithms. In rooms with video - a little easier. For example, based on these videos, we count the number of people at the box office in real time. If the queue exceeds 4 people, the senior station cashiers can receive automatic notification and open an additional cashier or send passengers to the ticket printing machines.
- Appeals of citizens. Both the CPPK personnel (people at the stations) and the passengers (especially, retired people, I admit) write different wishes about what to do and how. These requests, as well as all other collected data from systems and sensors, are written to the operational monitoring and control system built on the basis of ITSM. In essence, this is a Central PPK ticket system.
Such terminals are used: the principle is the same as that of the blue-red column at the metro stations
- Data from related companies. For example, various repair services provide information on the condition of the equipment at the sites. Directly Railways gives its data to the CPPK, which allows you to clearly see deviations from the schedule.
- Static (more precisely, not updated in real-time) information about areas, spans, polygons - this is important for analytics problems. But, by the way, its use is not very wide: the schedule grid is very close to the maximum, and so. Even if, thanks to analytics, we understand that we need another train at 9:05, it will be difficult to lay it in the net. Either you simply won't let go more physically, or you need to skip the Sapsan, or a bunch of other restrictions. Therefore, this is an example of how good analytics easily rests on the real world. From what can be done physically, I really want to vary the length of the train, but, unlike some overseas countries, we still don’t have the garbage collector mechanics - just returning empty cars (at the level of architecture). Therefore, you have to somehow drag them back manually, which is quite difficult. Accordingly, the optimization option at the level of the composition, and not the schedule is also not suitable. At least in the next couple of years. For now, forget about “go to the airport only the first two cars”.
Event Filtering and Correlation
There are events that do not require human intervention and are simply processed according to certain rules. For example, noncritical delays (up to 5 minutes) are taken from the train monitoring subsystem (based on GPS sensors and RZD alarm systems) and are immediately displayed on the passenger information systems (display at the station, as below). In the case of a long queue, an automatic reaction is also triggered according to the results of the video analytics analysis system.
The next type of event is prediction or correlation. For example, if a train is late, then the one that follows it along the same pair of rails (the path is usually the same) will also be late if the first one does not catch up with the schedule. Accordingly, it is possible to build a mat model and immediately predict a delay for two trains already. Then - for the third, affected by this change, the fourth, and so on, until the "circles on the water" subside. And, again, immediately inform the passengers automatically.
Technically, the system generates a bunch of single events. The information is aggregated into a heap and the maximum lateness is calculated. Calculates how many stations you need to notify. As a rule, if the delay is short - you can only the next or another pair. If it is long, then it is necessary to notify 7-10 stations without a chance to catch up (at the smallest cashiers shout into a horn, at the more stations there is an automatic schedule updating system).
There are events that require a postponed human response. For example, there was some problem - the ticket got up. Something uncritical broke in the train - you need to finish the route and decide whether to put it on unscheduled repairs or do something else. And if you put, then where. Sometimes you just need to notify someone about the event or do something in the CPPK. Then the ticket goes to automate business processes. If there is a malfunction of the ticket printing machine, the application automatically arrives to the contracting organization, depending on who serves the machines and where. If we are talking about the infrastructure of the platform (shed canopy, the roof was bent from the wind) - another process, also immediately responsible.
Another usefulness: earlier it was possible to find out about the jambs of the contractors at the end of the month, now - right away, and, as a rule, an operational call from the top dramatically changes the situation if there is something wrong somewhere.
The next type of event is alarms, that is, things that require a controller reaction here and now. Alarms are prioritized by importance. An example of such an event is a bag left behind on video surveillance. Much more often triggers are messages of PSC employees from stations or cashiers.
There are also complex correlations that are needed to study the long-term processes of a company. For example, one of the most interesting correlations is how the movement of trains affects the sale of tickets at stations. For this study, the data is removed from the machines and turnstiles. On fairly large samples, it is possible to calculate in which train people got on and where they went. Plus calculate the population of the train. Why it is necessary to calculate the population of a train with the help of analytics, and not calculations by cameras - a separate question. First, in many compositions there are no cameras. Secondly, where they are, they are security cameras. In world practice, no one considers such a stream for such cameras, because the main requirement is top-down direction to count heads. Back in Russia there were attempts to count people on the basis of sensors, but they were banally turned off or smashed by vandals. In general, any non-welded part of the train will be very quickly broken or unscrewed. Or, first unscrewed, and then broken. Therefore - analytics.
This was our pilot project, which is limited to the situation center and in pilot mode.
But back to the passenger traffic. Central PPK wonders how much money the train carries and if there is overcrowding. That is, they should understand the peaks and areas of their actions. For example, there is a completely accurate peak from 6 to 8 in the evening - it operates until Odintsovo in the Belarusian direction, and after that it is already smoothed.

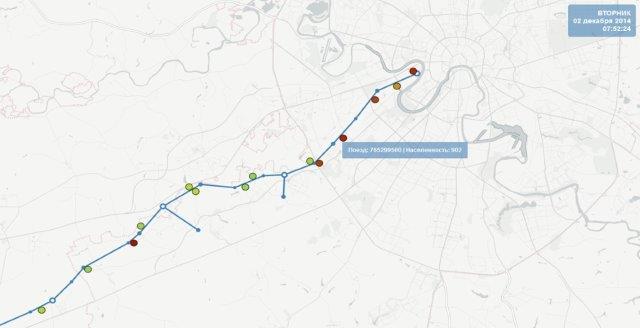
Real-time geo-information system. This GIS shows which train is going where, where what incidents happened. This is the most important visualization tool for what is happening in the area of responsibility. The central control panel uses a customized system of Russian Railways, which takes into account a lot of specific features of the CPPK, but it is necessarily integrated with the GIS of the infrastructure owner, that is, the Russian Railways.
To understand how a GIS railwayman differs from the real world, you just have to think about another grid. Kilometer poles themselves in our country are quite neat. But the length of the block sections (basic elements of the control system) can vary from 700 to 1300 meters. One would assume that sometime in the 19th century, Kuzma walked some way, set marks for traffic lights. He drank vodka, played the balalaika and gave rise to a bunch of problems for developers. But in reality this is certainly not the case.
The last part of the reaction is feedback from the cashiers of the stations responsible for the infrastructure and other employees. Their report closes the processing chain. Then - general statistics, reporting, forecasts, BI, different cuts - in general, everything that is needed for top management to make decisions. A periodic analysis is done - they look at what and where to change. At a simple level: if ticket-printing machines often fail, an opportunity has arisen to make motivated organizational and technical decisions.
What it looks like
The system now has 43 reports and 5 info panels, where these data are displayed in the assembly. By a cursory glance at the panel, the dispatcher determines what and how, as a device pilot, he sees everything at once, without looking at everyone. And there are reports for strategic decisions.
Examples of reports:
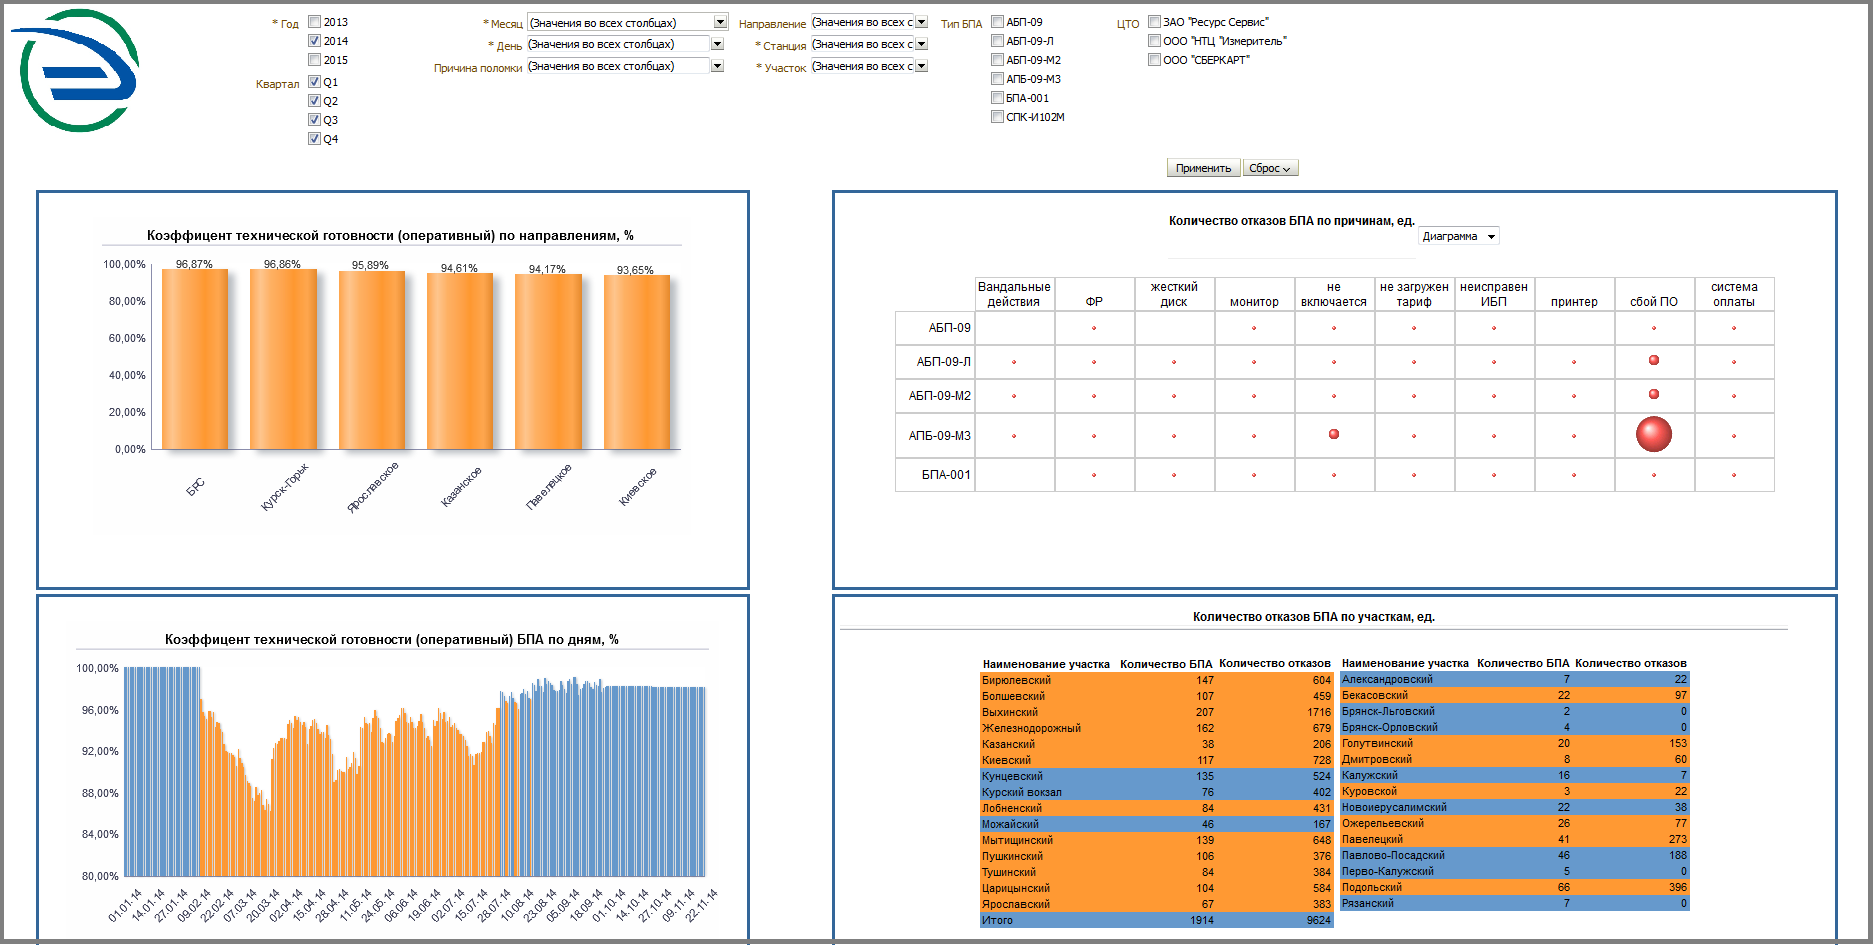
There is a separate panel where the staff member may see a sharp change from typical indicators at the stations (this is an extraordinary situation):

For reports there is a visual designer so that the dispatcher does not call IT people. Just drag and drop the columns. Conveniently. A maximum of 5 minutes on the desired report in the desired period. Report designers - as a rule, analysis tools (for example, where it is better to put automata - on Vykhino or on the junction station further).
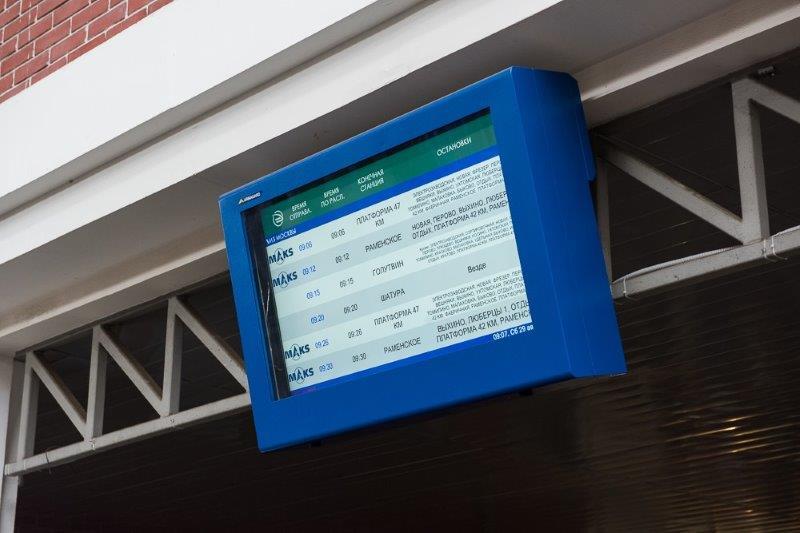
Information displays at the stations almost like the Germans. Information is updated every 30 seconds. Static-type scheduling for the day comes to the displays, “quick” updates with changes, cancellations and additional assignments, and in real time (every 30 seconds), train deviations from the schedule are pulled up from the GPS, GLONASS, RZD signaling.
Real broadcast
Cashier screen at the station
More information is uploaded to IVR. We have made an API for other systems.
For field staff, a lightweight version of the situation center system is displayed on the tablets - there are notifications about what is happening, but, roughly speaking, without an infographic on the panel. Do cashiers on AWP also a similar piece of data is displayed to be aware of.

In the center
The new situational center was started in September 2013, but there is still a lot of work. By the way, thanks to the timing video analytics, in particular, tested in all seasons.
Summary
CAC has become the core of monitoring, management and analysis of the entire operating activity of the carrier. This is what we have done to date:
- Servicing of ticket printing machines : a BPA network support process was implemented with the involvement of contractors and control over compliance with regulatory deadlines. Now, no professional deadline does not remain without a warm breath of the head at the back of the head. We made an additional interface for registering applications for BPA for use on tablets: a ticket can be sent directly from the station, if monitoring does not reveal a problem. The BPA service information panel has been implemented - there is a special “command view” on the map of the situational center, where you can see the analyst in the necessary sections. We made a detailed regulatory report on incidents of the category “Malfunction of passenger facilities” (this is to understand what, how, where and why). Implemented a summary report on the work of the dispatcher with incidents in the category "Malfunction of passenger facilities" (this is so that problems have a surname), plus a report was made for internal use on incidents in the category "Malfunction in passenger equipment", processed with a time violation. And yet the same report for management and daily operational report on what and how is done, statistics on the health of individual devices, inventory. It was all on the 2013th. In 2014, there is already an analyst of auto-joining tickets into one if they are duplicated from different sources, plus the extension of already closed tickets for which the problem arose again. There are automatic and manual prioritization of incidents. Completed documentation on the maintenance of the unit. The plans include a report for tracking situations of labor discipline violation by specialists in the referral plus infopanel for monitoring the performance of the unit at the stations. Phew ... But let's go further, this is only one direction.
- Maintenance of passenger devices : made a panel for servicing and repairing video cameras, the same control scheme for contractors as above (automatic applications, tickets, documents, etc. - the camera breaks, the application letter immediately drops and the required document is made, for example). The same reports for the customer service, a summary report on the processing of requests and a detailed report on incidents. Most of the work - in 2014.
- Citizens' appeals : semiautomatic ticketing system by categorization, passing of tickets into the necessary structures, there is work with all departments of the CPPK and control over the implementation of regulatory deadlines. A little later, ITSM was modified to store files - scans of complaints, response text, etc. Then it was necessary to issue tickets for contacting the CAC dispatchers and for the employees of the stopping points with CAC workplaces - they also did it. Implemented a detailed report on the incidents, in the plans - a summary report.
- Alerting employees CPPC about events affecting passenger services. This is an automatic recording of incidents of the category “Traffic schedule” in the case of electric trains lagging behind the schedule for information received from the train traffic monitoring subsystem. 10 stations of the pilot zone automatically send out “perimeter intersection” events (according to the results, it’s easier to install more security officers, too frequent drawdowns), learned to count the queue length at the cash desk based on camera data, made a panel on video analytics for the situational center, made auto-links with employees PPCC by e-mail and via SMS messages about events affecting passenger service, in particular, about deviations from the schedule of electric trains. Made reports: a register of incidents, reports and triggers for any atypical events, injuries. Later screwed up the information about the very late train for distant stations. According to the reports, auto-reports are made, which are required by standards.
- For information and analytical support, CPPC specialists made reception of data from sources on incidents of various categories, introduced a new industrial platform (Oracle BI), configured the operational reports designer, transferred basic reports to a new panel (so that they could work with it). Then they gradually tightened up what appeared in other directions.
- Involvement of stopping point employees in the process of detection of faults and their correction . Among other things, they deployed at 38 stations an automated workplace with access to a “tactical view” for station employees.
- The current schedule at the stops : in 2013 there was a conclusion of the train schedule at 10 stopping points of the Kazan direction. Then - at 15 additional stations, 83 monitors were installed to display the train schedule. A pilot tariff output has been implemented at Vykhino station. According to the proposals received from passengers, the schedule output has been optimized: now the schedule in both directions (from Moscow / to Moscow) is displayed on one screen. Currently installed 170 displays on 25 railway stations in Moscow and the region.
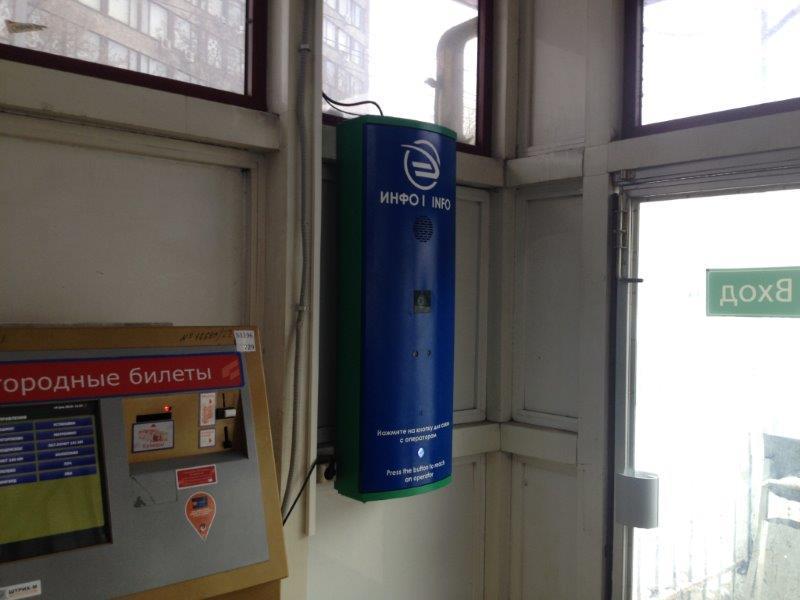
- Emergency communications : they made operational emergency communications, installed racks with an emergency communications button.
- For the situational center : the dispatch center is realized. An interface has been developed for the maintenance of equipment directory by the employees of the CPSP; Plus a bunch of improvements, for example, automatically sending notifications to interested parties about the expiration of service level agreements, the composition of the BPA card attributes in the equipment directory has been expanded, the equipment directory interface has been modified to maintain a directory of passenger facilities.
- Train traffic monitoring : a train traffic monitoring subsystem has been implemented (many sensors have been put into wagons). The report “Traffic schedule” was filled in, the information panel of the timetable manager and rolling stock was implemented. We continue to install sensors in the train.
- External interaction : information exchange with external resources, in particular Russian Railways, has been implemented to provide access to 15 directories, including schedules and stopping points.
Who knows such stories - for each phrase hellish work of at least a dozen people for at least several months. The tasks were from simple ones (“wear yourself in the grease and mount the iron in all the trains”) to complex ones (such as “show information about all the equipment of the CPPK in the reports”). There was a lot of work for practicing engineers, analysts, architects, administrators, and, of course, developers.
I participated and continue to participate in the project. If you have questions about the project or its details (here I will call for help from colleagues - team leaders responsible for the site), we will be happy to tell you more in the comments what you can. But I’ll say at once that not everything is possible, the railway still remains a rather specific object from the point of view of openness of information.
If you have questions, ask in the comments or write to asmirnov@croc.ru.
Source: https://habr.com/ru/post/273013/
All Articles