Weighty arguments. To the question of analytics in the company
Each of us periodically donates blood for analysis. Recently, everything has become very convenient: I passed it, received a login / password, a few hours later I looked at the site in my personal account and there are all the figures in numbers, and next to it there are green or red bullets “rate / not rate”. But few people know that even a completely green column or a column with a pair of red bullets on some unpopular indicator of the type of eosinophils can indicate malfunctions in the body, and only a doctor can correctly interpret the picture. Why? Because all indicators need to be considered in aggregate and interrelations - by themselves they carry purely reference information. Similarly, in business, a complex and multi-level system, it is necessary to build an analytics system that will provide a comprehensive understanding of the situation. What should we build an analyst?

Analytics in business is the most important stage of internal research, during which, based on assessment of actual data and forecasting, each company forms a long-term and short-term strategy, sets development priorities, calculates the necessary volumes of labor, material and financial resources, determines the coverage directions. Inadequate or inaccurate data can lead to the inefficient use of resources and reduce the efficiency of the company by reducing the return on investment. Comprehensive analytics helps to create a reliable forecast system and obtain comprehensive information about all aspects of the company.
The Ruli24 XRM team is familiar with first-hand data analysis. As we already told, at the core of Ruli24 is the Oracle database. Despite some of its shortcomings, it was not chosen by chance - it is a powerful database capable of storing and processing a huge number of data records of our clients, among which are very large companies with extraordinary requirements for analytics. In general, we have something to tell.
To begin with, we will try to figure out what the analytics is for, who is the internal customer and how these managers of different levels are used. The main functions of data analysis in the company are closely correlated with the commercial goals of the business and always serve as markers for achieving these goals.
')
So, we already roughly imagine that data is collected and stored in a database or other storages: files, records, spreadsheets. Requests to this data form users, so-called internal clients. This may be specialized analysts, but more often - managers and middle managers, whose work is based on the results of the analysis of previous data.
Thus, internal analysts are almost all employees involved in the core business of the company. By the way, note to managers. Sometimes part of the staff access to information is closed completely because of the uselessness of the service. These decisions can be fraught with the fact that managers work blindly and make fatal mistakes. Therefore, it is better to use the system of differentiation of access rights than to block all reports or access to tickets for creating queries to the database.
Realizing the importance of information within the company and the functions described above, the Ruli24 team paid more attention to the collection and storage of information within the system. First of all, data entry forms (cards) were created, which help users to bring to Ruli24 maximum information about all aspects of the company's activities. As a result, tables are formed, which can be accessed to obtain a large amount of data, filter and build graphical representations of data.
Automation when working with data provides quick access, easy processing, visualization and work with a pool of information through a convenient GUI. Another advantage of data storage in the corporate information system is the complexity of data compromise: the manager can make mistakes when filtering, break tables and even try to erase everything (believe me, it happens!). But the differentiation of access rights and setting up the correct data storage in the database protect the company from both the problem of curved hands and deliberate sabotage. In addition, a number of problems related to the data itself are solved.
Returning to the problem of complexity, we will discuss a few rules that must be observed when analyzing corporate information. Compliance with these simple points will give a complete picture and, moreover, will help to accumulate data with historical depth, which is extremely useful for forecasting purposes.
Data needs to be analyzed over time — this is necessary for building trends and forecasts, identifying trends. Comparison of data in the context of different time intervals allows you to calculate the growth rate and growth rates, track changes, see the effect of the influence of factors. For example, if you track the indices of purchasing assortment positions, you can see a drop in demand (or waves of falling demand), change the pricing policy, or remove a position from the range - in this way the company will avoid the formation of stock balances and glut. In Ruli24, for such a presentation there are bar charts and diagrams that help to visually assess changes in indicators.
It is necessary to consider both relative and absolute indicators . Absolute indicators (for example, the amount of consumer loans issued by a bank) help estimate sales, sales, stocks, etc., and calculate costs and profits. Relative indicators (for example, the share of loans issued up to 100,000 rubles in the volume of all consumer loans) give an understanding of the structure, sales funnel, distribution of customer preferences, etc. The most popular relative indicators are among marketers and commercial units engaged in mailings and promo. By the way, customer segmentation based on data from CIS (for example, Ruli24 ) is also an analysis that allows you to increase the conversion of mailings.
We have repeatedly mentioned correlation and factor analysis . These tools help to track relationships and establish the effect of some indicators on others. Their use helps to create the same set of indicators that will reflect the influence of one company’s process on the others. In this case, XRM can be just a source of reliable data - for interpretation, you will need other tools or your own models built in Excel, for example, using VBA.
In our post, we talked more about analytics in small and medium-sized businesses, analyzing marketing activities and sales, but the analytics system should be built in any company that wants to develop in the long run: from a beauty salon and a taxis to a bank and a large factory. At the same time, data should be available that affect all aspects of the organization’s activities. For example, Ruli24, which has absorbed all our 25 years of experience, allows us to collect and interpret data in many areas:
Moreover, the Ruli24 team, while still working on the desktop version of the system, determined that the software interface plays a big role in working with data: this is the convenience of collection, and table partitioning, and linking tables into modules. Let's tell how we designed it.
Psychologists say that ordering the desktop is not only a convenient arrangement of things. It is also a business card of each employee: a reflection of the order in his head, in thoughts, deeds. With Ruli24, it is easy to keep order on the “desktop” of a computer, which means it is convenient to collect data by type of activity.

Even in small companies there is a fairly large document flow. As a rule, the disadvantage of old automated control systems is that all information about the presence of a particular document in the system is always displayed on the computer screen. But if out of all this, an employee needs only 10% to complete the task?
In Ruli24, we developed a special mechanism that allows you to cut off 90% of unused information. Any employee can independently set up his “Favorites” and work only with the documents and analytical reports he needs. Everything will be pre-sorted, filtered, detailed and grouped by specified parameters and labels. The user may not see other documents at all. But if he needs to clarify this or that information from a manager or a colleague, he will be able to change the settings (again - independently) and get the necessary information without disconnecting from the system and without disturbing colleagues with the requests to “find, clarify, remind”.
All documents and tables within the system are interrelated, however, in Rule24, the user does not need to see all the files and folders. Upon request, reports are generated automatically for the desired specific user parameter.
The number of folders and documents on the desktop is formed by the user himself: “Requests”, “Tasks”, “Files” and so on. By the way, you can attach a file to any request. What is also convenient: the user will not need to deal with the descriptions of the necessary document. By creating a folder or group related to, say, staff, you can also filter out the information you need for employees. So, if I am interested in the size of accrued bonuses, then there is no need to revise the general statement of payroll. The program will generate a separate report on premiums: to whom, how much and for the performance of which work the increase is accrued.
Frequently used operations can also be placed on the desktop. For example, in the folder “Send to the bank” will contain documents and statements that must be delivered to the bank. The advantage is that the system will clearly reflect whether the document or statement has been sent to a credit institution or is still in the office.
In Ruli24 you can customize the desktop completely for yourself. And spend it just a couple of hours. The system interface may seem unusual, but it is quite easy to understand.
Another advantage of Rule24 is the possibility of detailing information. Any data can be specified for a specific request. For example, information about the availability of contracts, specification, payment schedule, delivery schedule, acts, invoices, and so on is displayed for a specific client. Moreover, the acts can also make accounting entries. This mechanism is the same for the whole system, therefore it is also configured for an employee who works with this client. Detailing avoids multiple reports. All information will always be at hand and with the necessary statistics in the right section. And the detailing can be both digital and alphanumeric.
 The built-in system of tabular and graphical analysis allows you to independently form the views you need. Like about Excel.
Imagine that there are Excel spreadsheets on your desktop. If there is a “+” icon on the icon in the left corner, then when you click on it, you will immediately enter the data entry page in this table. If there is no such icon, then you open the table for viewing. Next you need to master the work with this table. Work with other tables will be similar. You need to memorize only five types of actions with the data in the table: edit, status, operations, service, view. "Edit" provides input, correction, deletion and printing of data in the table. "Status" provides the ability to change the status of the document (attention, openly, executed, etc.). "Operations" are specific to each document. “Service” - very useful functions that are absent in most systems: filter, grouping, column information, favorites. “View” - a presentation on the screen: table, tree, analytics, tuning, detailing. Functions applicable to all tables and views.
Despite the power of editors, Ruli24 has advantages over spreadsheets. For example, in Excel, by selecting data, you can build a chart. But in Ruli24, graphs can be compiled on the basis of several interrelated tables at once. In Excel, this function still has limitations.

By the way, on many tables in Ruli24 there are so-called informers that allow you to see additional information on a specific figure. The built-in system of interrelations of tables and views allows you to trace the links of documents according to the “refinement” technology. This is a very handy feature.
At the end of the post it is worth mentioning several golden rules of analytics that we formulated in the Ruli24 team and strive to use both within the company and in advising our clients in the implementation process.
The last and main rule, which is repeated by analysts, programmers and scientists who know the price of mistakes - the analyst must be honest. Honest analytics is possible only on reliable data. Take care of the proper collection and organization of information. After all, as you know, who owns information, then owns the world.
Analytics in business is the most important stage of internal research, during which, based on assessment of actual data and forecasting, each company forms a long-term and short-term strategy, sets development priorities, calculates the necessary volumes of labor, material and financial resources, determines the coverage directions. Inadequate or inaccurate data can lead to the inefficient use of resources and reduce the efficiency of the company by reducing the return on investment. Comprehensive analytics helps to create a reliable forecast system and obtain comprehensive information about all aspects of the company.
Who needs analytics?
The Ruli24 XRM team is familiar with first-hand data analysis. As we already told, at the core of Ruli24 is the Oracle database. Despite some of its shortcomings, it was not chosen by chance - it is a powerful database capable of storing and processing a huge number of data records of our clients, among which are very large companies with extraordinary requirements for analytics. In general, we have something to tell.
To begin with, we will try to figure out what the analytics is for, who is the internal customer and how these managers of different levels are used. The main functions of data analysis in the company are closely correlated with the commercial goals of the business and always serve as markers for achieving these goals.
')
- Determining the state of the business. The totality of the received and interpreted data reflects the real state of affairs in business: from the fulfillment of the sales plan to the profit and the condition of the warehouse stocks. Every company, starting a business, must have a system of indicators-markers and their normative values in order to periodically assess the situation. Take, for example, an advertising agency. A sample list of markers: the ratio of incoming leads and active clients, the number of paid bills, receivables, profits, the number of current and closed projects (funnel), total payments to employees at outsourcing and freelancers. As you noticed, we in one example mixed financial and marketing indicators. Of course, in real life it is better to separate them.
- Identifying business problems is the next stage after assessing the state. If the indicators deviate from the standard values, each deviation should be regarded as a problem, even if it does not seem so at first glance. For example, in an advertising agency, a significant increase in the number of clients (well) may lead to the formation of receivables or the failure to fulfill orders on time and the appearance of reputational risks. Especially valuable for identifying problems is forecasting. The ability to anticipate the situation based on the existing data pool saves the company from many problems and leaves time for maneuvers.
- Recommendations for improving the situation are also based on the analysis of information and access to a pool of existing data. In principle, no marketing campaign should be held without prior in-depth analysis and prediction of results. On the one hand, this is a guarantee of awareness of the decision, on the other - the opportunity to once again think through all the reasons for carrying out activity. The same situation in other commercial matters: to change sales channels, credit customers, provide discounts and form new sales methods (such as installment plans), there must be an obligatory analytical basis with a short, medium and long term forecast.
- Determining the strategy, business needs in general is another important task of analytics. Based on the data, decisions are based on restructuring the company, personnel changes, equipment purchases, liquidation of assets and much more. In large companies, the main analytical code is the budget and business plan, which sometimes reaches hundreds of pages of description and pay sheets and files. Small companies avoid the budget process and in some ways they are right (it takes time and requires a serious approach to forms, formulas, interaction). But to completely abandon planning and business analysis is impossible. How to conduct it easier, we will describe below.
So, we already roughly imagine that data is collected and stored in a database or other storages: files, records, spreadsheets. Requests to this data form users, so-called internal clients. This may be specialized analysts, but more often - managers and middle managers, whose work is based on the results of the analysis of previous data.
What does data analysis give to managers?
- Holistic vision of the company: profits, profitability, performance targets, operating activities, costs, asset structure, and so on.
- Developing a KPI system is an extremely important task. Key performance indicators of employees often form the basis for decisions on bonuses and depreciation of employees, so it is important to get the most accurate information about all indicators related to the work of each unit.
- Reports on actual results of operations (financial, commercial, production) are necessary for forecasts for future periods and an overall assessment of the result. Such indicators should be monitored over different periods to see points of growth and fall in each of the time intervals.
- Relationships within the company can be seen based on data analysis. No need to evaluate each group of numbers as an independent cluster - there is no complete isolation in the company. Thus, the indicators of the marketing department influence sales, and logistics, warehouse, production, etc., depend on sales. The ability to see the relationship helps to quickly find the causes of deviations, which is especially important during a crisis, when the financial health and stability of the company becomes the primary concern.
- Reasons for corrective decisions also arise from numbers - this can be both the experience of previous periods, when something caused a positive reaction, and a decision made on the basis of analyzing the influence of factors on the current situation. By the way, it is often not at all necessary to build complex models of factor analysis - sometimes it is enough to note on the graph of the dynamics of the data events that occurred with a company, website or product to see the effect. A simple example from web analytics: a sophisticated b2b-industrial company launched advertising on Facebook. It is clear that no one will order a product one by one on the social network - the action is more image-based. After some time, analysts see an increase in organic brand queries. Superimposed the graphics shows on Facebook and the metric from the site - for sure, organics grew due to advertising. Advertising is over - people have stopped “making inquiries” about the company, the flow of visitors and calls has become shallowed again. It was decided: to advertise in social networks at low speeds - organic creeps up.
What does data analysis give to managers?
- Analysis and evaluation of their activities - each manager sees the progress of his work and can redistribute efforts to achieve KPI in time.
- Planning and forecasting - managers evaluate plans, compare them with fact, calculate growth rates, make forecasts in order to work out measures to improve performance. For example, the dealer department of a mobile operator. The manager sees that the group of dealers receives a commission with a disproportionately large part of the remuneration for the handed over contracts and a very small part for subscription fees. Extended data is taken, subscriber profiles are analyzed and, on the basis of the analysis, it becomes clear that this is fraud on the part of the dealer or simply “damned place”.
- The effectiveness of interventions is also evaluated using data analysis. Any impact directed at the consumer / partner / other counterparty must be assessed and measured. If you do not know how you will collect information, it is better to postpone the launch of the activity.
- Operational information helps to evaluate daily performance, track key indicators and metrics.
Thus, internal analysts are almost all employees involved in the core business of the company. By the way, note to managers. Sometimes part of the staff access to information is closed completely because of the uselessness of the service. These decisions can be fraught with the fact that managers work blindly and make fatal mistakes. Therefore, it is better to use the system of differentiation of access rights than to block all reports or access to tickets for creating queries to the database.
Automate it!
Realizing the importance of information within the company and the functions described above, the Ruli24 team paid more attention to the collection and storage of information within the system. First of all, data entry forms (cards) were created, which help users to bring to Ruli24 maximum information about all aspects of the company's activities. As a result, tables are formed, which can be accessed to obtain a large amount of data, filter and build graphical representations of data.
Automation when working with data provides quick access, easy processing, visualization and work with a pool of information through a convenient GUI. Another advantage of data storage in the corporate information system is the complexity of data compromise: the manager can make mistakes when filtering, break tables and even try to erase everything (believe me, it happens!). But the differentiation of access rights and setting up the correct data storage in the database protect the company from both the problem of curved hands and deliberate sabotage. In addition, a number of problems related to the data itself are solved.
- Inconsistency and heterogeneity of data. All reporting is formed in standardized forms, and data entry cards using input rules and masks solve the problem of the format of the entered data.
- Disunity of data - within the corporate information system, all data is collected in relation to entities (under the hood, it looks like the connections of tables in the database, but users are usually not interested) and therefore excludes cases when homogeneous records will be stored in different tables.
- Invalidity of data. Since there is always a manager (manager, senior manager, analyst) who can easily compare data and see falsification, the temptation to enter false information quickly disappears, all the more so because interconnections within the system, connection with primary documentation and accounting doom almost any fraud to fail.
- The complexity of data organization. In the corporate information system, the organization of data is the concern of the DBMS, and the user receives convenient, filled-in tables in which data is retrieved and grouped using filters and custom reports. Even if the Ruli24 user lacks the functionality of the system for interpreting data or is not satisfied with the graphics library, there is a solution: you can upload data to Excel and continue processing with the methods and tools that the employee needs.
Returning to the problem of complexity, we will discuss a few rules that must be observed when analyzing corporate information. Compliance with these simple points will give a complete picture and, moreover, will help to accumulate data with historical depth, which is extremely useful for forecasting purposes.
Data needs to be analyzed over time — this is necessary for building trends and forecasts, identifying trends. Comparison of data in the context of different time intervals allows you to calculate the growth rate and growth rates, track changes, see the effect of the influence of factors. For example, if you track the indices of purchasing assortment positions, you can see a drop in demand (or waves of falling demand), change the pricing policy, or remove a position from the range - in this way the company will avoid the formation of stock balances and glut. In Ruli24, for such a presentation there are bar charts and diagrams that help to visually assess changes in indicators.
It is necessary to consider both relative and absolute indicators . Absolute indicators (for example, the amount of consumer loans issued by a bank) help estimate sales, sales, stocks, etc., and calculate costs and profits. Relative indicators (for example, the share of loans issued up to 100,000 rubles in the volume of all consumer loans) give an understanding of the structure, sales funnel, distribution of customer preferences, etc. The most popular relative indicators are among marketers and commercial units engaged in mailings and promo. By the way, customer segmentation based on data from CIS (for example, Ruli24 ) is also an analysis that allows you to increase the conversion of mailings.
We have repeatedly mentioned correlation and factor analysis . These tools help to track relationships and establish the effect of some indicators on others. Their use helps to create the same set of indicators that will reflect the influence of one company’s process on the others. In this case, XRM can be just a source of reliable data - for interpretation, you will need other tools or your own models built in Excel, for example, using VBA.
Ruli24: details decide
In our post, we talked more about analytics in small and medium-sized businesses, analyzing marketing activities and sales, but the analytics system should be built in any company that wants to develop in the long run: from a beauty salon and a taxis to a bank and a large factory. At the same time, data should be available that affect all aspects of the organization’s activities. For example, Ruli24, which has absorbed all our 25 years of experience, allows us to collect and interpret data in many areas:
- staff and salary
- material resources and warehouse
- budgeting and payment calendar
- sales and deals
- productive reserves
- cash, etc.
Moreover, the Ruli24 team, while still working on the desktop version of the system, determined that the software interface plays a big role in working with data: this is the convenience of collection, and table partitioning, and linking tables into modules. Let's tell how we designed it.
Psychologists say that ordering the desktop is not only a convenient arrangement of things. It is also a business card of each employee: a reflection of the order in his head, in thoughts, deeds. With Ruli24, it is easy to keep order on the “desktop” of a computer, which means it is convenient to collect data by type of activity.
Even in small companies there is a fairly large document flow. As a rule, the disadvantage of old automated control systems is that all information about the presence of a particular document in the system is always displayed on the computer screen. But if out of all this, an employee needs only 10% to complete the task?
In Ruli24, we developed a special mechanism that allows you to cut off 90% of unused information. Any employee can independently set up his “Favorites” and work only with the documents and analytical reports he needs. Everything will be pre-sorted, filtered, detailed and grouped by specified parameters and labels. The user may not see other documents at all. But if he needs to clarify this or that information from a manager or a colleague, he will be able to change the settings (again - independently) and get the necessary information without disconnecting from the system and without disturbing colleagues with the requests to “find, clarify, remind”.
All documents and tables within the system are interrelated, however, in Rule24, the user does not need to see all the files and folders. Upon request, reports are generated automatically for the desired specific user parameter.
The number of folders and documents on the desktop is formed by the user himself: “Requests”, “Tasks”, “Files” and so on. By the way, you can attach a file to any request. What is also convenient: the user will not need to deal with the descriptions of the necessary document. By creating a folder or group related to, say, staff, you can also filter out the information you need for employees. So, if I am interested in the size of accrued bonuses, then there is no need to revise the general statement of payroll. The program will generate a separate report on premiums: to whom, how much and for the performance of which work the increase is accrued.
Frequently used operations can also be placed on the desktop. For example, in the folder “Send to the bank” will contain documents and statements that must be delivered to the bank. The advantage is that the system will clearly reflect whether the document or statement has been sent to a credit institution or is still in the office.
In Ruli24 you can customize the desktop completely for yourself. And spend it just a couple of hours. The system interface may seem unusual, but it is quite easy to understand.
Another advantage of Rule24 is the possibility of detailing information. Any data can be specified for a specific request. For example, information about the availability of contracts, specification, payment schedule, delivery schedule, acts, invoices, and so on is displayed for a specific client. Moreover, the acts can also make accounting entries. This mechanism is the same for the whole system, therefore it is also configured for an employee who works with this client. Detailing avoids multiple reports. All information will always be at hand and with the necessary statistics in the right section. And the detailing can be both digital and alphanumeric.
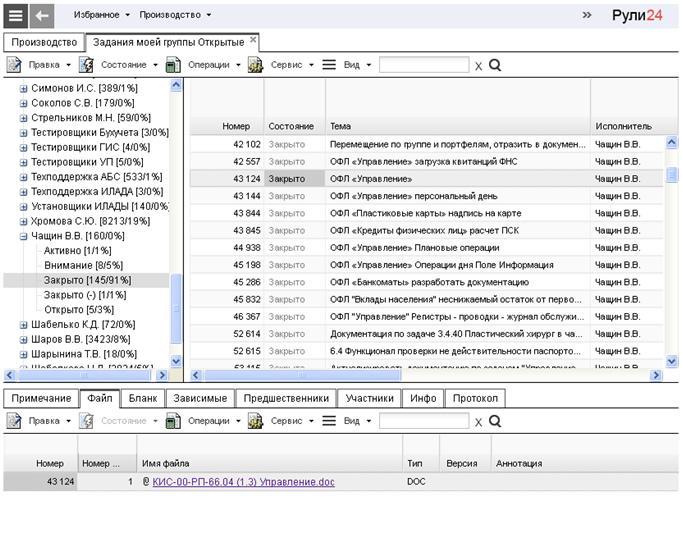
Imagine that there are Excel spreadsheets on your desktop. If there is a “+” icon on the icon in the left corner, then when you click on it, you will immediately enter the data entry page in this table. If there is no such icon, then you open the table for viewing. Next you need to master the work with this table. Work with other tables will be similar. You need to memorize only five types of actions with the data in the table: edit, status, operations, service, view. "Edit" provides input, correction, deletion and printing of data in the table. "Status" provides the ability to change the status of the document (attention, openly, executed, etc.). "Operations" are specific to each document. “Service” - very useful functions that are absent in most systems: filter, grouping, column information, favorites. “View” - a presentation on the screen: table, tree, analytics, tuning, detailing. Functions applicable to all tables and views.
Despite the power of editors, Ruli24 has advantages over spreadsheets. For example, in Excel, by selecting data, you can build a chart. But in Ruli24, graphs can be compiled on the basis of several interrelated tables at once. In Excel, this function still has limitations.
By the way, on many tables in Ruli24 there are so-called informers that allow you to see additional information on a specific figure. The built-in system of interrelations of tables and views allows you to trace the links of documents according to the “refinement” technology. This is a very handy feature.
At the end of the post it is worth mentioning several golden rules of analytics that we formulated in the Ruli24 team and strive to use both within the company and in advising our clients in the implementation process.
- Set metrics to be measurable and measurable. If you do not track the indicator, then it is not worth wasting your time and effort to collect it.
- Do not be afraid to change the set of metrics along with changes in the business situation - the analytics must be relevant, dynamic and fully meet the needs of the business.
- Do not approach the indicators formally - be sure to work with reports, establish relationships, listen to the arguments of various departments. A very unpleasant fact, but often the analyst is used for mercenary purposes and interpreted in his favor, so it is worthwhile to look at various sections.
- No need to strangle employees with reports - there are good add-ins above databases for data collection and accumulation. Just ask the employees to make the most up-to-date operational information - the data pool will be collected automatically.
The last and main rule, which is repeated by analysts, programmers and scientists who know the price of mistakes - the analyst must be honest. Honest analytics is possible only on reliable data. Take care of the proper collection and organization of information. After all, as you know, who owns information, then owns the world.
Source: https://habr.com/ru/post/272835/
All Articles