Analysis of key performance indicators - part 3, the last, about system and service metrics
We are finishing the publication of the test and performance analysis translation from the Patterns & Practices team on what key performance indicators are needed with. For the translation, thanks to Igor Shcheglovitov from Kaspersky Lab. The rest of our articles on testing can be found on the tag mstesting
In the first article of the cycle on the analysis of key performance indicators, we set the context, now turn to specific things. In the second, we looked at the analysis of user, business indicators / metrics and indicators required for analysis within the application. In this, the final - about system and service (including dependent services) metrics.
So,
System metrics ...
System metrics allow you to determine which system resources are used and where resource conflicts may occur. These metrics are aimed at tracking machine-level resources such as memory, network, processor, and disk utilization. These metrics can provide insights into the internal conflicts underlying the computer.
You can also track these metrics to determine aspects of performance — you need to understand if there is a relationship between system metrics and application load. You may need additional hardware resources (virtual or real). If the constant load increases the values of these metrics, then this may be due to external factors - background tasks, regularly-running tasks, network activity or device I / O.
How to collect
You can use Azure Diagnostics to collect diagnostic data for debugging and troubleshooting, measuring performance, monitoring resource usage, analyzing traffic, scheduling required resources, and auditing. After collecting the diagnostics, you can transfer it to Microsoft Azure Storage for further processing.
')
Another way to collect and analyze diagnostic data is to use PerfView . This tool allows you to explore the following aspects:
- CPU utilization . PerfView, using Sampling Tracing technology, periodically (in millisecond intervals) requests the stack of currently executing code and returns the complete stream frame. Next, PerfView aggregates the collected spectra of various threads together, and you can use the stack viewer utility to see what your code does (and for what processor time), and also remove or correct code that is executed incorrectly.
- Managed memory . PerfView can do Managed Heap snapshots, which are controlled by the .net garbage collector. These snapshots are converted into object graphs, allowing you to analyze the lifetime of objects.
- Unmanaged memory . PerfView can capture events when the operating system allocates or frees blocks of memory. You can use this information to track how your application works with unmanaged memory.
- Timing and blockages . PerfView can track and visualize information about when threads fall asleep and wake up. You can use this information to search for various locks in your application. This analysis is especially useful when performance issues are observed with low CPU usage.
Initially, PerfView was designed to run locally, but now it can be used to collect data from the Web and Worker roles of Azure cloud services. You can use the AzureRemotePerfView NuGet package to install and run PerfView remotely on role servers, and then download and analyze the data locally.
Windows Azure Diagnostics and PerfView are useful for analyzing the ex post facto resources used. However, when using practices such as DevOps, you need to monitor “live” performance data to detect possible performance problems before they even occur. APM tools can provide such information. For example, the Troubleshooting tools for web applications on the Azure portal can display various graphs showing memory, processor, and network utilization.

The Azure portal has a “health dashboard” showing common system metrics.

Similarly, the Diagnostic panel allows you to track a pre-configured set of commonly used performance counters. Here you can define special rules under which the operator will receive special notifications, for example, when the value of the counter greatly exceeds a certain value.

Azure web portal can display performance data for 7 days. If you need to access data for a longer period, then you need to upload performance data directly to Azure Storage.
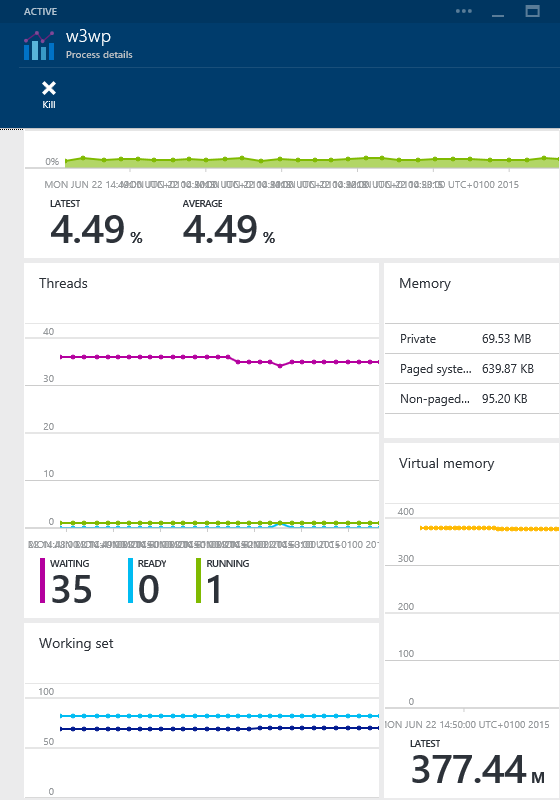
Websites Process Explorer allows you to view details of individual processes running on a website, as well as track correlations between the use of various system resources.
New Relic and many other APM have similar functions. Below are a few examples.
Monitoring system resources is divided into categories that cover memory utilization (physical and manageable), network bandwidth, processor performance, and disk input / output (I / O) operations. The following sections describe what to look for.
Physical memory usage
All processes running in Windows use virtual memory, which is projected onto the physical by the operating system. The virtual memory of the process is divided into reserved (reserved) and allocated (commited):
- Reserved memory is not associated with physical or paged memory stored in the paging file. It simply describes the amount of memory reserved for the process, and is recorded in a virtual address descriptor (VAD) for the process. This memory is not associated with physical storage and can be ignored during performance monitoring.
- The allocated memory is associated with the allocation of physical memory and / or paged file memory. The use of allocated memory must be monitored.
You can monitor the disposal of allocated memory to determine if your cloud services or sites have enough memory allocated to support the required business load and handle sudden surges in user activity. Monitor the following performance counters:
- Memory \ Commit Limit shows the maximum amount of memory that can be allocated by the system. Usually this is a fixed value, which is determined by the operating system (more info for 64-bit versions of Windows ) For example, on a machine with 8Gb of memory, this figure will be about 11Gb.
- Process \ Private Bytes shows the amount of memory allocated for the process. If the sum of all private bytes for all processes exceeds the memory limit described above, this means that there is a shortage of memory in the system and applications will fail.
- Memory \% Committed Bytes in Use is the ratio of Memory / Committed Bytes to Memory \ Commit Limit. A high value for this counter indicates that there is a large memory load on the system.
Note: Windows has a Process \ Virtual Bytes counter. This counter shows the total amount of virtual memory that the process uses, but it should be treated very carefully, because in fact, it shows the sum of the reserved and allocated process memory. For example, exploring the Process / Virtual Bytes and .NET CLR Memory \ # total reserved bytes counters when starting the w3wp process, this counter can show 18 GB, although its total memory is 185 MB.
Reserved memory can be expanded with dynamic RAM and processes can convert this memory into physical.
There are two main causes of an OutOfMemory error — a process exceeds the virtual memory space allocated for it, or the operating system is unable to allocate additional physical memory for the process. The second case is the most common.
You can use the performance counters described below to estimate memory load:
- Memory \ Available Mbytes. Ideally, the value of this counter should exceed 10% of the amount of physical memory installed on the machine. If the amount of available memory is too small, then there is a chance that the system will begin to use the paging file for active processes. If the system does not have enough physical memory, then the result may be significant delays and / or a complete system hang.
- Memory \% Committed Bytes In Use. The limit of allocated memory will increase if the total amount of allocated memory approaches 90% of the limit value - if the value reaches 95%, the limit will probably stop growing and the likelihood of an OutOfMemory error will appear. As soon as the amount of allocated memory reaches the limit, the system will no longer be able to allocate memory for processes. Most of the processes will not cope with this behavior of the system and will stop their execution. Therefore, it is very important to monitor this counter.
- Memory \ Pages / sec. This counter shows how much the system uses the page file. You can determine the effect a paging has on physical memory — to do this, multiply the value of this counter by the value of the Physical Disk \ Avg.Disk sec / Transfer counter. The result of this operation will be between 0 and 1, and will characterize the proportion of disk access time spent on reading and writing virtual pages to the paging file. A value of 0.1 means that the system spends more than 10% of the total access time to the disk to work with the paging file. If this value is constant, then it may indicate physical memory problems.
It should also be noted that large amounts of memory can lead to fragmentation (when there is not enough free physical memory in neighboring blocks), so a system that shows that it has enough free memory may not be able to allocate this memory for a particular process.
Many APM tools provide information on the use of system memory by processes without the need for a deep understanding of how memory works. The graph below shows the bandwidth (left axis) and response time (right axis) for an application under constant load. After about 6 minutes, the performance suddenly drops, and the response time starts to “jump,” after a few minutes, the indicators appear.

Results of load testing of the application
Telemetry recorded using New Relic shows redundant memory allocation, which causes the operation to fail and be restored. Memory usage grows at the expense of the paging file. This behavior is a classic symptom of memory leakage.

Telemetry showing excess memory allocation
Note: Investigating Memory Leaks in Azure Web Sites with Visual Studio 2013 contains instructions on how to use Visual Studio and Azure Diagnostics to monitor memory usage in a web application in Azure.
Managed memory usage
.NET applications use managed memory, which is controlled by the CLR (Common Language Runtime). The CLR projects the managed memory onto the physical. Applications query the CLR for managed memory, and the CLR is responsible for allocating the required memory and freeing unused memory. Moving data structures across blocks, CLR provides a layout for this type of memory, thereby reducing fragmentation.
Managed applications have an additional set of performance counters. The Investigating Memory Issues article contains a detailed description of the key counters. The most important performance counters are described below:
- .NET CLR Memory # Total Committed Bytes A process memory that relies on physical memory and paged disk space. This counter displays the amount of process memory allocated and should be very similar to the value of the Process / Private Bytes counter.
- .NET CLR Memory # Total Reserved Bytes indicates the amount of reserved memory for the process. It should be approximately equal to the value of the Process \ Virtual Bytes counter and less than the Process \ Private Bytes value.
- .NET CLR Memory \ Allocated Bytes / sec, indicates the variability of a managed heap. The value of this counter can be positive or negative, depending on whether the application creates or destroys objects. This counter is updated after each garbage collection cycle. A permanently positive value for this counter may indicate a memory leak.
- .NET CLR Memory # Bytes in all Heaps indicates the total size of the managed heap for the process.
- .NET CLR Memory \% Time in GC is the percentage of time that was spent on executing the last garbage collection cycle. A good indicator of this counter is <10%.
Network latency on web server
Network performance is especially important for cloud applications, since it is a conductor through which all information passes. Network problems can lead to poor performance, which will cause displeasure to users, as network delays lead to an increase in the duration of queries. Currently, Windows does not provide performance counters for measuring the latency of requests for individual applications. However, there is Resource Monitor, which is an excellent tool for analyzing network traffic on a local machine (you can configure Remote Desktop during the deployment of your cloud services and log in to the server of your Web or Worker roles). Resource Monitor provides information about lost packets or information about the total delay of active TCP / IP sessions. Packet loss gives an idea of the quality of the connection. The delay indicates the time required to complete the route of the TCP / IP packet. The figure shows the Network tab in the Resource Monitor.
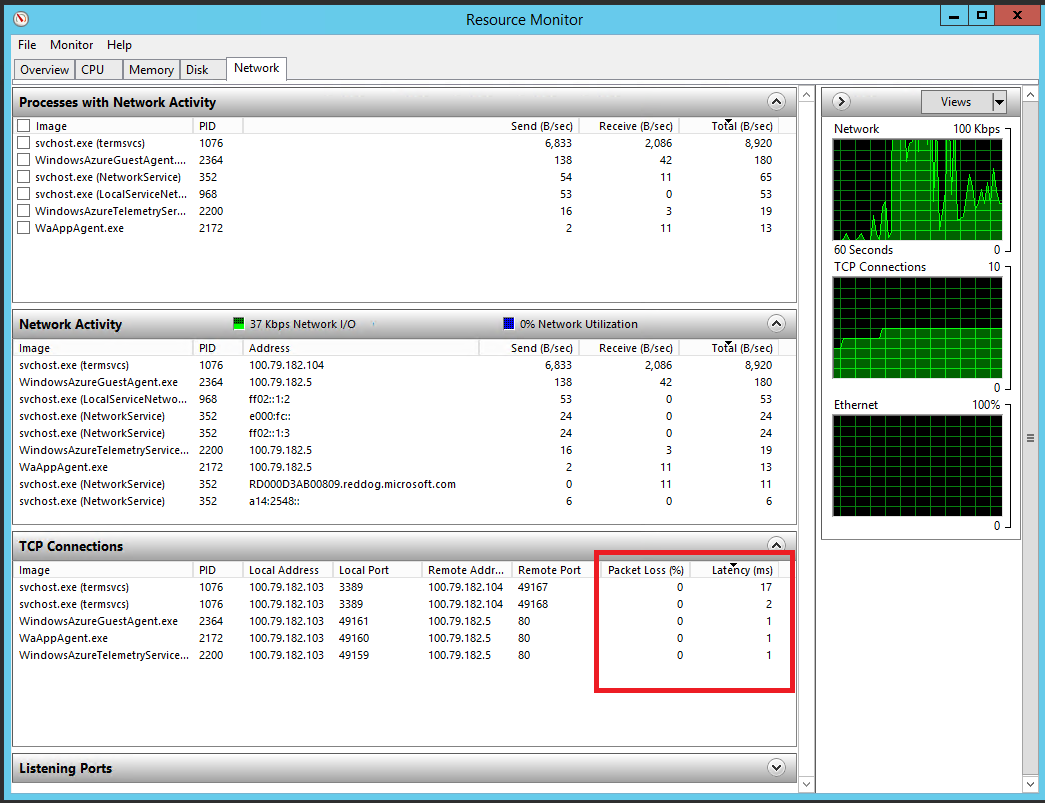
Resource Monitor showing local network activity
Network usage on a web server
You can obtain the following performance counters by connecting directly to the web server from the Performance Monitor (if you need real-time information) or set up Azure Diagnostics to save data to Azure Storage.
- Network Adapter \ Bytes Sent / sec and Network Adapter \ Bytes Received / sec shows the speed at which the network adapter transmits and receives data
- Network Adapter \ Current Bandwidth is used to estimate the allowable bandwidth (in bytes per second) of the network adapter.
- % Network utilization for Bytes Sent = ((Bytes Sent / sec * 8) / Current Bandwidth) * 100
- % Network utilization for Bytes Received = ((Bytes Received / sec * 8) / Current Bandwidth) * 100
If these values turn out to be about 100%, then this may indicate a network overload. In this case, you may need to distribute network traffic to multiple instances of the cloud application.
The Azure portal can show network utilization by all instances of the cloud service, as well as a specific role instance. The portal has Network In and Network Out counters that provide information on the number of bytes received and sent per second.

Monitoring Network Usage in the Azure Management Portal
If the network latency is very high, but the utilization is low, the network is hardly a bottleneck. High CPU utilization of application instances may mean that more power is required, and the load should be parallelized between several instances. If the utilization of the CPU is low, then this may be due to the influence of external services. For example, complex queries sent to an Azure SQL database can take a long time to execute. In this situation, the distribution of network traffic between instances may exacerbate performance problems due to database server overload, which will further increase the latency. You must be prepared to track the use of external services.
Note: For more information on network latency and channel width, we recommend that you familiarize yourself with the Windows Sysinternals PsPing tool.
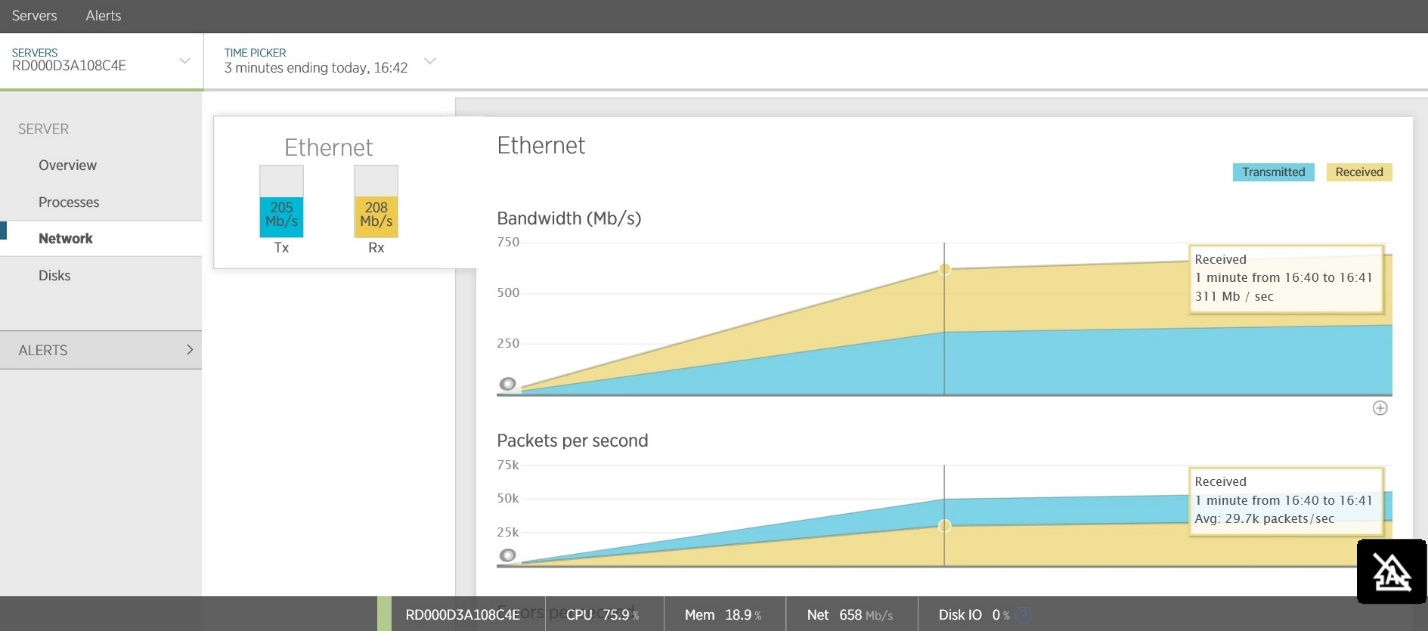
Network traffic
Another common cause of delays is a large amount of network traffic. You must investigate the volume of traffic to external services. Many APM-tools allow you to track traffic directed towards cloud services and web applications. The figure shows an example taken from New Relic, which shows the incoming and outgoing network traffic of the Web API service. A large amount of total traffic (~ 200 MB / sec) results in high latency for clients.
The Azure Management Portal also contains tools for viewing the utilization of external services, such as the Azure SQL Database and Azure Storage.
Network overheads and client locations
High network delays can be associated with overhead such as protocol interaction, packet loss, and routing effects. Latency and bandwidth can be highly dependent on the location of clients and the services they work with. If clients are located in different regions, then the issue of distribution of service instances across regions should be considered, making sure that there will be enough capacity in each region to handle the required load.
The graphs below show how geographic distribution of users can affect throughput and latency. A constant flow of requests within three minutes was sent to the service. This scenario was used for two tests - in the first one the clients and the server were located in one region, and in the second - in different ones. In both graphs, the left axis shows the performance in operations per second, and the right axis shows the response time in seconds.
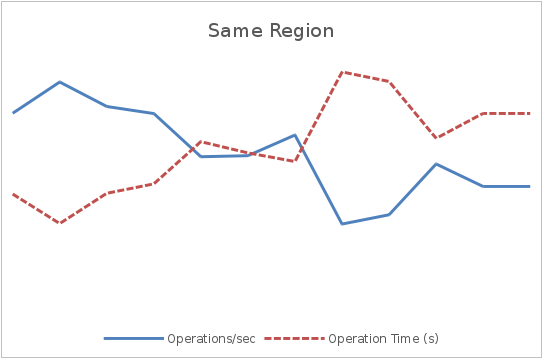
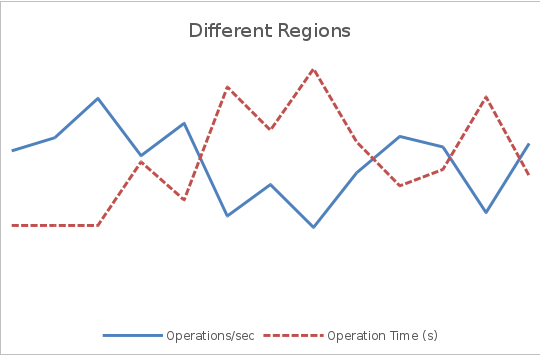
In the first graph, the average throughput is several times higher than in the second, and the response time is about ¼ of the response time of the second graph.
The size of the payload of the message passing through the network
The size of the request and response body can have a significant impact on throughput. XML requests can be significantly larger than their JSON equivalents. Binary serialized data may be more compact, but less flexible. In addition to bandwidth consumption, large requests lead to additional CPU load spent on parsing or deserialization of data.
The following graphs illustrate the effect of different sizes of requests for bandwidth and response time. As before, the same test service was used on both graphs. Customers and service are located in the same region.


Here you can see that increasing the size of a message 10 times led to a decrease in throughput and an increase in response time. It should be noted that this is an artificial test focused on the demonstration of network traffic. It does not take into account additional processes required for processing requests, and there is also no influence of third-party network traffic generated by other clients or services.
"Talkative" in the network
Chattiness is another common cause of network latency. Chatty refers to the frequency of network sessions that are required to complete a business transaction.
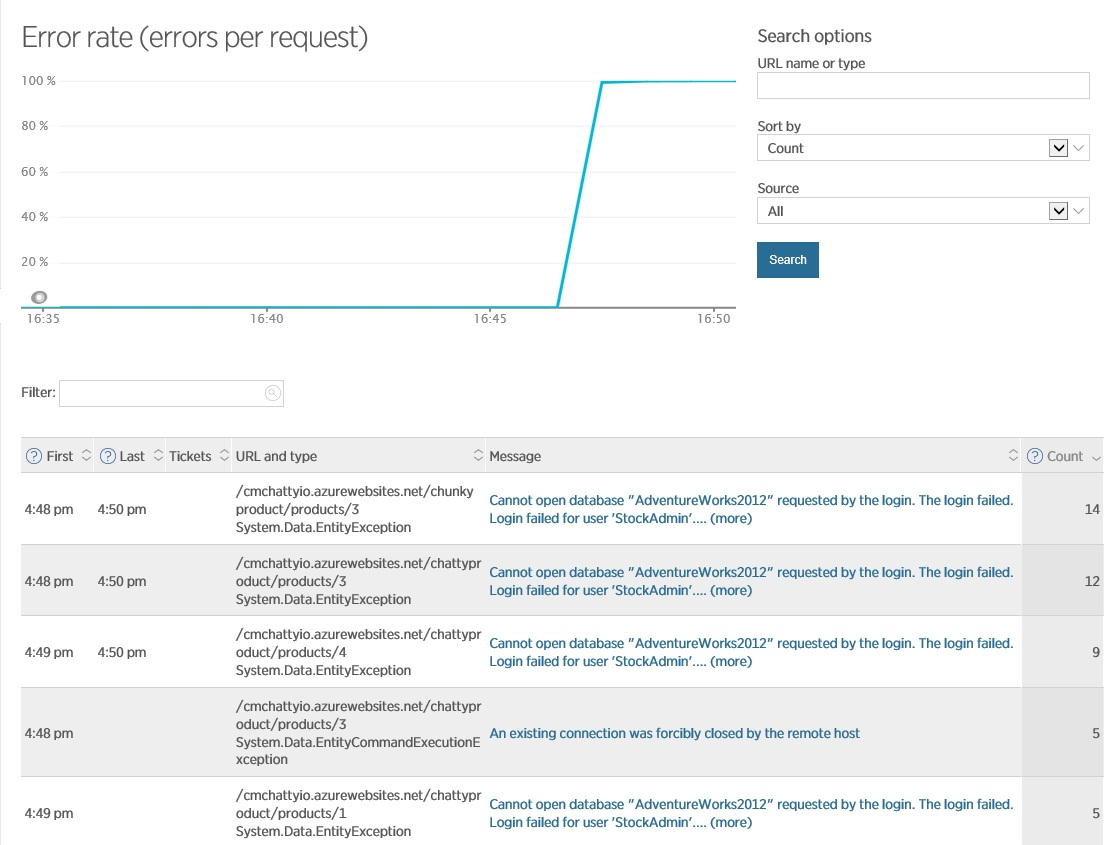
To detect “talkativeness,” all operations must include telemetry, recording the frequency of the call, and by whom and when they were called. Telemetry should include the size of the network requests at the input and output of the operation. A large number of relatively small requests in a short period of time, sent by the same client, may indicate the need to optimize the system by combining these requests into one or several. As an example, the figure shows the telemetry of the test Web API service. One or more requests to Azure SQL occur per API call. During monitoring, the average throughput was 13,900 requests per minute. The figures also show the telemetry of the database, which shows that during this period of time the service made more than 250000 queries to the database. These numbers indicate that each time the Web API is called, an average of 18 calls to the database occur.


Calls to the database that occur when requests to the application
CPU usage at server and instance level
CPU utilization (utilization) is a measure that measures the amount of machine work, and the “availability” of a CPU indicates the amount of spare processor capacity that the machine has to handle the additional load. Using APM, you can get this information for a specific server running a web service or a cloud application. The figure shows the statistics of New Relic.

The Azure web portal allows you to view CPU data for each service instance.

Using CPUs for service instances in the Azure portal
High utilization of the CPU can be the result of a large number of exceptions, the generation of which overloads the processor.
You can track the frequency of exceptions using the approaches described earlier in the corresponding sections. Excessive processor utilization may be due to applications in which large garbage collection occurs frequently. You must examine the CLR Garbage Collections counters as described in the “Managed Memory Usage” section to evaluate the impact of the garbage collector (GC) on total processor utilization. You should also make sure that the garbage collection policy is configured correctly on your system (for more, see the Fundamentals of Garbage Collection ).
Low utilization of the CPU in conjunction with high latency can be associated with various locks, which may indicate problems in the code, such as improper use of locks or waiting for synchronous I / O operations (see the Synchronous I / O antipattern ).
The affinity processor property (binding the process to a specific processor) may cause the processor or processor core to be a bottleneck. This situation can occur in a cloud application in Azure with a Worker role. Requests from Web roles can always be sent to a specific Worker role bypassing the load balancer.
Using CPU on a specific server
The processor operates in two modes: user and privileged. In user mode, the processor executes the instructions that make up the business logic of the application. In privileged mode, the processor performs kernel-level operations of the operating system, such as file operations, memory allocation, swapping, thread management, context switching between processes. To track processor load, monitor the following performance counters:
- Processor \% Privileged Time the amount of time the processor spends working in privileged mode. The constant high value of this counter indicates that the system spends considerable time performing the functions of the operating system and may be caused by large amounts of I / O operations, permanent locks of processes or threads, excessive pumping or overhead in managing memory (for example, garbage collection) .
- Processor \% User Time, the time that the processor spends on executing application code, not system functions.
- Processor \% Processor Time total CPU usage (in user and privileged modes). Usually, processor load varies between high and low values, but a constantly high level (over 80%) means that the processor may be a bottleneck. For example, the Busy Front End anti-pattern shows a situation where the load is initially focused on a single Web role, and also shows how to improve the response time when using a queue to transfer data processing to individual worker roles.
CPU-intensive processes
You can investigate the possible causes of high process load in a test environment during load testing. Such an approach should help eliminate the influence of external factors. Many APM tools support thread profiling to analyze how the processor performs stack operations. The figure shows an example of profiling in New Relic.
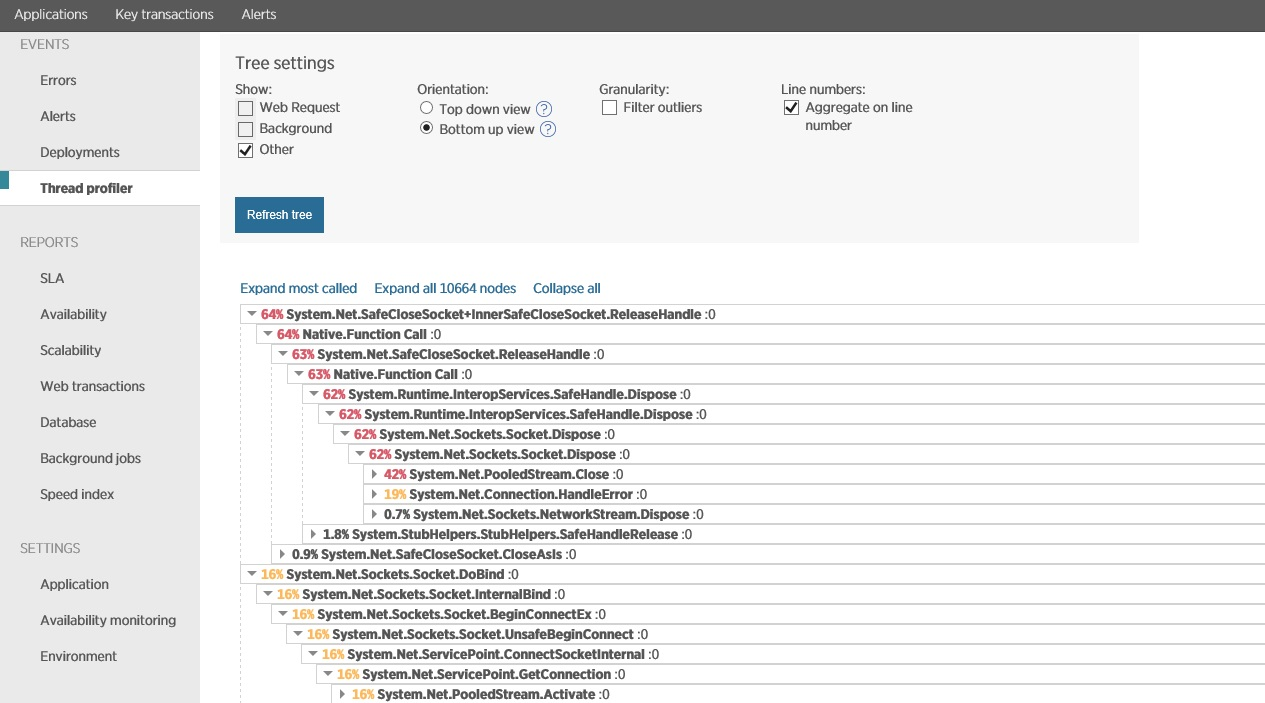
Profiling in New Relic
After profiling for a certain period of time, New Relic allows you to analyze this information and investigate operations that spend the most CPU time. The received information can be a signal for code optimization.
This technique is a very powerful tool, but it can have a significant impact on the performance of real users. Thus, when conducting this process on a real environment, you must immediately turn off the profiler after collecting data.
Disk usage
High frequency input / output (I / O) operations are usually caused by tasks such as business intelligence or image processing. In addition, many data storage services (for example, Azure SQL Database, Azure Storage, and Azure DocumentDB) make extensive use of disk resources. If you create virtual machines to start your services, then you may need to monitor disk access. This is to make sure that you select the correct disk configuration to ensure good performance.
Memory-intensive applications can also trigger significant disk activity. Memory overflow can lead to an increase in size and, as a result, a decrease in performance. In this case, it may be necessary to scale the role horizontally to redistribute the load across several instances, but before that you should analyze your application for proper memory usage (the cause may be a banal leak).
In Azure, virtual disks (used in virtual machines) are created in Azure Storage. Azure Storage: Premium. - , . IOPS ( / – . Input/Output Operations Per Second) – . 500 - 60 /. Premium- SSD- 5000 - 200 /.
RAID- , I/O . . Sizes for Virtual Machines .
: IOPS I/O-. , , , IOPS . , , IOPS. I/O .
() SQLIO Disk Subsystem Benchmark Tool . , , :

I/O
, , , 500 . , RAID-, 4- ( Azure Storage) .

I/O striped-
1400 IOPS. Premium-, 80000 IOPS .
, () Azure. , IOPS Premium- (5000 IOPS) ( RAID) . , () I/O IOPS . . Premium Storage: High-Performance Storage for Azure Virtual Machine Workloads.
Azure I/O . APM- . , New Relic. I/O-, , . , , 100%, IOPS 1500. RAID` 4- ( ):
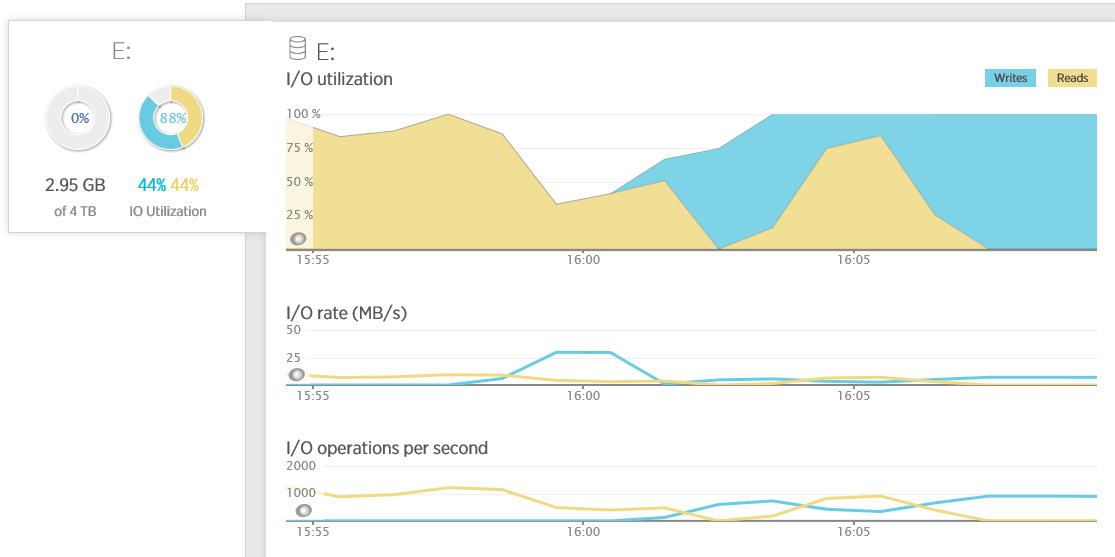
, ( Physical Disc):
- Avg. Disk sec/Read Avg. Disk sec/Write. ( ) . , . (payload) 64 15 . - I/O , , .
- Disk Transfers/sec. . , , , IOPS. I/O- . , . . , , 100 10 , 50 20 . (, ). .
- Disk Bytes/Sec, Disk Read Bytes/sec Disk Writes Bytes/sec. , . 1 MB 256 4 , . , 15 , I/O , Avg. Disk Bytes/Read Avg. Disk Bytes/Write
- Avg. Disk Queue Length, Avg. Disk Read Queue Length, and Avg. Disk Write Queue Length. I/O , ( ). :
- Avg. Disk Queue Length = (Disk Transfers/sec) * ( Disk sec/Transfer)
, .. . - % Idle Time. . . , . 1 , %idle time 0. , , , ( ).
Azure , , . , .
, , (backend pressure). , , , . . , .
?
Azure Azure (Storage, SQL DB, Service Bus ..). APM.
. . , , . , .
?
, -, SLA. . - Azure. , , .. .
Azure Storage
Azure Storage. , -. C (end-to-end) Azure Storage , .
Azure Azure Storage, -. , .

Azure
Azure Storage
. Azure Storage . (Premium ). , . , , .
Azure. , . .

, Azure
Azure SQL
, Azure SQL Database, , - . Azure .

Azure
Azure SQL Database Microsoft. Microsoft SLA, 99.9%. , ( ) .
, , , (, ). APM, . New Relic . , -.
New Relic
, . . , (, , ). Azure.
Azure SQL Database DTU
AZURE SQL database Database Throughput Units, DTU. DTU , , I/O . SQL Azure, . DTUs ( 5 DTU 1750 Premium/P11). DTU, , . , DTU , Azure. , .

DTU Azure
Azure SQL
, , , , . . CPU, Data I/O, Log I/O, , , , . , ( ).
Dynamic SQL , , . sys.dm_db_resource_stats, , ( , 80%).
(COUNT(end_time) - SUM(CASE WHEN avg_cpu_percent > 80 THEN 1 ELSE 0 END) * 1.0) / COUNT(end_time) AS 'CPU Fit Percent' ,(COUNT(end_time) - SUM(CASE WHEN avg_log_write_percent > 80 THEN 1 ELSE 0 END) * 1.0) / COUNT(end_time) AS 'Log Write Fit Percent' ,(COUNT(end_time) - SUM(CASE WHEN avg_data_io_percent > 80 THEN 1 ELSE 0 END) * 1.0) / COUNT(end_time) AS 'Physical Data Read Fit Percent' FROM sys.dm_db_resource_stats``` If this query for any of the 3 requested metrics returns a value less than 99.9%, then you should consider switching to a higher level of database performance or optimize to reduce the load on the database.
This information is also available on the Azure portal:

Azure SQL statistics on the Azure portal
Query performance
Inefficient database queries can significantly affect latency and throughput, and can also cause excessive resource consumption. You can retrieve information about queries from dynamic views and visualize this data in the Azure SQL portal. The Query Performance page displays cumulative statistical data on completed queries for the last hour, including processor utilization and I / O operations for each query:

Query performance on the Azure SQL portal
You can drill down on the most difficult queries by looking at plans to fulfill them. This data can help determine the reasons for long-running queries, as well as optimize them.

Query execution plan for the Azure SQL portal
A large number of queries to the database
Large amounts of traffic between the application and the database may indicate a lack of caching. You need to analyze retrieved data, i.e., for example, when your application constantly requests and updates the same data, cache it locally in the application or in a shared distributed cache. The Query Performance page in the Azure SQL portal provides useful information in the form of an execution graph, as well as the number of executions (Run Count) for each query.
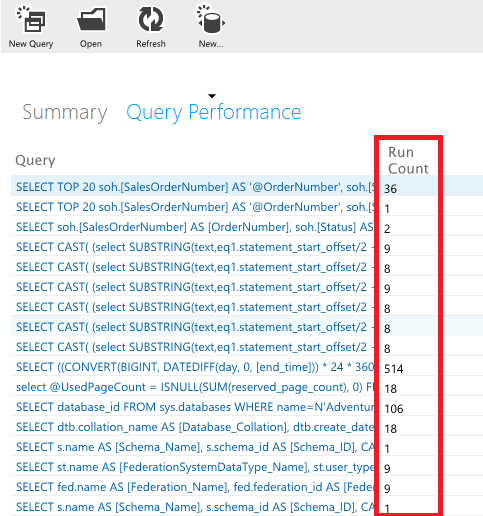
Query frequency monitoring on the Azure SQL portal
Queries that are executed very often (have a high Run Count) do not necessarily return the same data (some queries are parameterized by a special optimizer), but can serve as a starting point for determining candidates for caching.
Deadlocks in Azure SQL
In some non-optimal transactions, deadlocks may occur. When a deadlock occurs, it is necessary to roll back the transaction (rollback) and re-execute it later. Frequent deadlocks can cause significant performance degradation. You can track deadlocks in the Azure SQL portal, and if they occur, analyze the application’s trace in runtime to determine the cause.
Latency Service Bus
High levels of latency when accessing the Service Bus (hearing bus, then SB) may be a performance bottleneck. They can be due to a number of reasons, including network (for example, loss of packets related to the remoteness of the SB namespace from the client), competition within the SB (topics, queues, subscriptions, event hubs, and access errors. The Azure portal provides a limited set of performance metrics SB for queues, topics and event hubs. However, you can get more detailed information about performance (latency of send and receive operations, connection errors, etc.) by adding a collection of Microsoft Az counters to your application code. ure Service Bus Client Side Performance Counters (https://www.nuget.org/packages/WindowsAzure.ServiceBus.PerformanceCounters)
Denial of connection to the Service Bus and throttling
SB queues, topics and subscriptions have quotas that can limit their bandwidth. For example, these include the maximum size of a queue or topic, the number of simultaneous connections and simultaneous requests. If these quotas are exceeded, the SB will reject further requests. For more information, see azure.microsoft.com/documentation/articles/service-bus-quotas . You can control the amount of traffic passing through the queues and topics SB, on the portal portal Azure.
The volume of the event hub is determined in bandwidth units and is set at creation. One bandwidth unit equals 1 MB / s for incoming traffic (ingress) and 2 MB / s for outgoing traffic (egress). If the application exceeds the set number of bandwidth units, the speed of receiving and sending data will be cut. As with queues and tops, you can control the speed of the event hub in the Azure portal. It should be noted that the quotas for incoming and outgoing traffic are applied separately.
Failed Requests and Poison Message in Service Bus
Monitor the frequency of message processing errors and the total amount of poison messages for which the maximum number of processings has been exceeded. Depending on the design of the application, even one error message can slow down the entire system. Analyze failed requests and poison messages.
Event Hub Quota Exceptions
Cloud applications can use Azure Event Hub as storage for aggregating large amounts of data (in the form of asynchronous events) received from the client. Event Hub supports high speed inbound events with low latency and high availability, and is used in conjunction with other services to which it sends events for further processing.
The capacity of the event hub is controlled by the number of units of bandwidth that are set at the time of purchase. One unit supports:
* Ingress : up to 1MB of data per second or 1000 events per second.
* Egress : up to 2MB per second.
Inbound traffic is governed by the number of available bandwidth units. If exceeded, exceptions "quota exceeded" occur. When exceeding outgoing traffic exceptions do not occur, but the speed is limited by the volume of units of bandwidth (in the base case, 2 MB per second).
You can control the operation of the event hub by viewing the dashboard in the Azure portal:

Monitoring Event Hubs on the Azure portal
If you see exceptions related to the number of publications or do not see the expected outgoing traffic, check the number of units of bandwidth set for your project in the Azure portal on the Scale page.

Bandwidth Allocation for Event Hub
Mistakes with Event Hub leasing
An application can use the __EventProcessorHost_ object to distribute the workload across the consumers of an event. The __EventProcessorHost_ object creates an Azure Storage blob lock for each event concentrator section and uses these blobs to manage the sections (receiving and sending events). Each _EventProcessorHost_ instance performs two functions:
1. Extension of locks: the lock is currently owned by the instance and periodically extended if necessary
2. Creating locks: each instance continuously checks all existing locks for expiration and, if they are, it locks
You should monitor the frequency of repetitive message processing and blob blocking.
Using dependent services
In addition to Storage, SQL Database and Service Bus, there are a large number of Azure services, and their number is constantly growing. It is not possible to cover every service, but you must be prepared to control the key aspects that each of the services you use provides. As an example, if you use Azure Redis Cache to implement a shared cache, you can determine its effectiveness by analyzing the following issues:
* How much data gets into and misses the cache every second?
This information is available on the Azure portal:
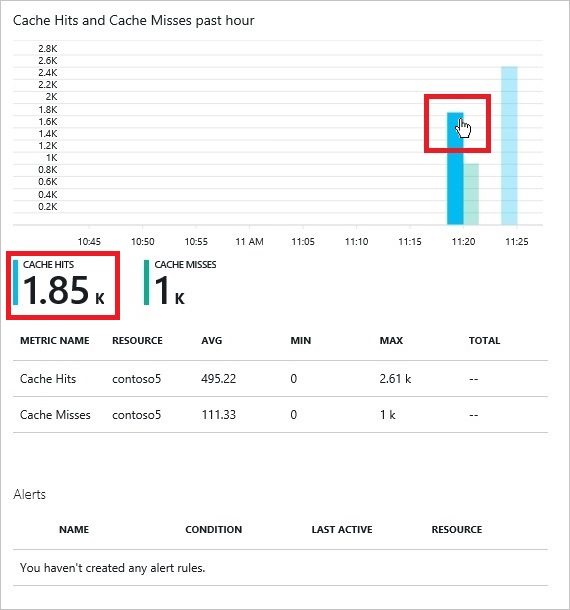
Monitor Azure Redis Cache on the Azure portal
After the system has reached a fully operational state, and at the same time the caching rate is low, then you may need to adjust the caching strategy.
How many clients connect to the distributed cache?
You can control the number of connected clients using the Azure portal.
The limit of simultaneous connections is 10,000. When this limit is reached, subsequent connection attempts fail. If your application constantly reaches this limit, then you should consider distributing the cache between users.
How many operations (receive and write) occur in a cache cluster every second?
You can view the Gets and Sets counters in the Azure portal.
How much data is stored in the cache cluster?
The Used Memory counter in the Azure portal shows the cache size. The total allowed cache size is set at creation time.
What is the level of delays in accessing the cache?
You can track the Cache Read and Cache Write counters in the Azure portal to determine the speed of reading and writing the cache (measured in KB / s).
How busy is the cache server?
Monitor the Server Load counter in the Azure portal. This counter shows the percentage of time that the Redis Cache server is busy processing requests. If this counter reaches 100%, it means that the Redis Cache server CPU time has reached its maximum, and the server will not be able to work faster. If you observe sustained high server load, then probably some requests will fall in timeout. In this case, you should consider increasing cache resources or partitioning data across multiple caches.
Summarizing
- Use telemetry to obtain performance data:
- Business transactions Monitor all external API calls. Special attention should be paid to critical business operations.
- Browser metrics. Capture information about new and returning users, as well as their browser types
- Monitor incoming and outgoing network traffic
- Monitor the memory used and how it relates to the business load
- CPU utilization and thread utilization
- The length of the queues and the waiting time for requests in the queue
- External services. Their latency and bandwidth, as well as errors.
- Use telemetry to create an alert to monitor business exceptions and SLA violations.
- Monitoring and collecting telemetry should not be used only to solve performance problems (reactive approach). Be active in using this information, because it can give you a picture of how your current server capacity will later relate to the growth of business load or how unexpected user behavior will affect the normal functioning of your system.
- Performance analysis is a cyclical research process involving observation, measurement, and verification. Not every approach gives positive results. This should be budgeted for. This is a continuous, continuous process that lasts throughout the life cycle of the system.
- Do not focus on low-level details. Assess engineering skills in the context of a specific task. You do not need to understand in detail in each performance counter. Instead, you need to focus on how they relate to the business activity of users and analyze the impact of the latter on them.
- Provide opportunities to enable and disable telemetry (as well as changes to its level of detail), as it can have a significant impact on the daily operation of the system. For example, profiling should not work all the time, but it should be turned on when the operator tries to identify performance problems. If possible, use the settings of your application to selectively enable telemetry.
- Using operating system tools, rather than external APMs, is the preferred approach.
Thank you all for your attention!
Parts of the article:
Key Performance Indicator Analysis - Part 1
Analysis of key performance indicators - Part 2, analysis of user, business and application metrics
Analysis of key performance indicators - part 3, the last, about system and service metrics.
Source: https://habr.com/ru/post/272567/
All Articles