Analysis of key performance indicators - Part 2, analysis of user, business and application metrics
We continue to publish a translation of testing and performance analysis from the Patterns & Practices team on what key performance indicators are needed with. For the translation, thanks to Igor Shcheglovitov from Kaspersky Lab. The rest of our articles on testing can be found on the tag mstesting
In the first article of the cycle on the analysis of key performance indicators, we set the context, now turn to specific things. In this part - about the analysis of user, business and inside application metrics.
User metrics provide insight into how users use the system. Performance at this level is determined by how the user interface handles requests and works with client resources. Most modern user interfaces are browsers and devices. In this case, the main metrics will be page load time, JavaScript code, type of browser or device, geographical location.
So,
How to collect custom metrics? ..
Most modern browsers allow you to collect performance data that includes network traffic and client code profiling. This information may be useful in terms of development and testing, but in production it is not practical to collect data like this. Another solution is to include on the client side an additional JavaScript code that would record and transmit information about the execution time of a particular site to a certain place. Such code can intercept the page loading time, session data (the execution time of some script, which may include opening multiple pages or performing several operations), JavaScript or errors on the client side, the execution time of AJAX requests. JavaScript code sends this data to a service that collects this information, and also allows you to subsequently investigate it. Boomerang is an open source solution that implements this approach.
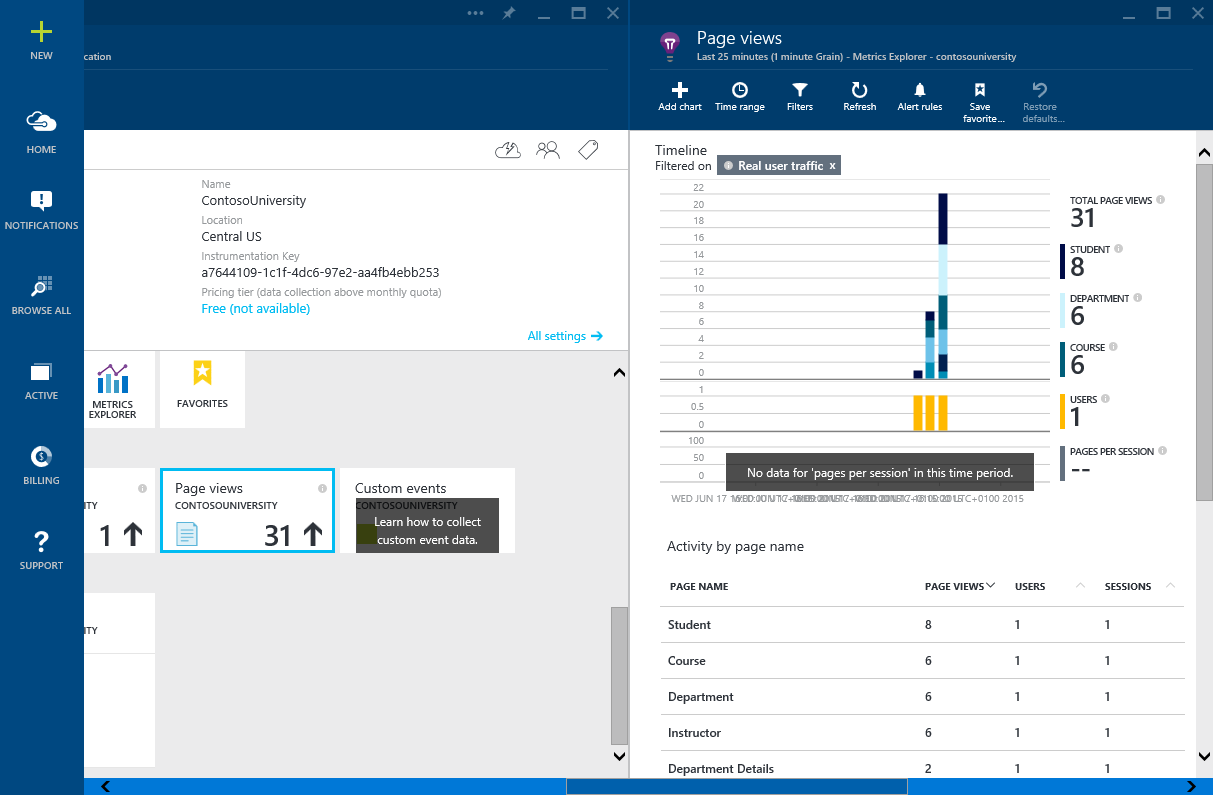
Microsoft AppInsights works similarly - you can explicitly embed AppInsight API function calls into your code. Using features such as TrackPageView and TrackEvent , you can measure the performance of browser sessions and examine the information collected in near-real-time on the Azure portal. The example in the figure below.
')
Many application performance monitoring (APM) utilities support client-server browser tracing. These utilities, like Boomerang, insert JavaScript elements into a web page, collecting and displaying information. The figure shows the information collected when browsing the browser pages with the popular New Relic APM tool.
Note: The embedded code may not work if the user browser is behind a firewall or proxy that does not have access to CDN New Relic or access to the public network is blocked.
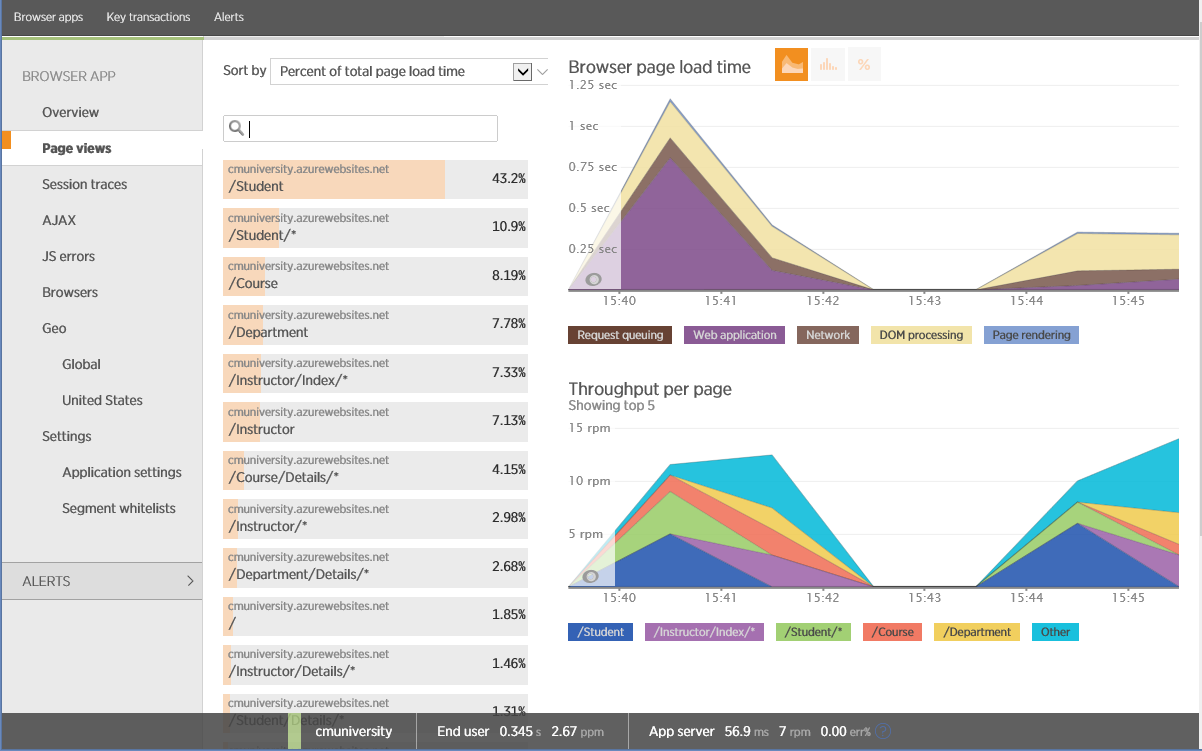
Performance Monitoring in New Relic
What to pay attention to?
The following is general information about client-side code instrumentation.
Page views, page load time and time spent on page
These custom performance metrics are key. If, for example, the load time of some popular pages is large, then users may start complaining and stop going there. From the point of view of the system, this data represents end-to-end telemetry for measuring throughput (from the beginning of a request to its full implementation).
Session tracing
Session tracing can be used to track the duration of operations and resource consumption in sessions. It is necessary to control all downloadable content, every AJAX request, all user interaction (mouse clicks and scrolling), all JavaScript events, all exceptions.
Client-side ecosystem
Client code can be run on various devices and operating systems, including various versions of Windows, Android and iOS, as well as various types of browsers. To collect telemetry of client code performance in various environments is important, since it allows you to reveal various facts, such as in which browser the code runs faster.
Below is an example of data collected using New Relic. On the graph you can see the bandwidth, measured in pages per minute (ppm), and other metrics such as page load time.
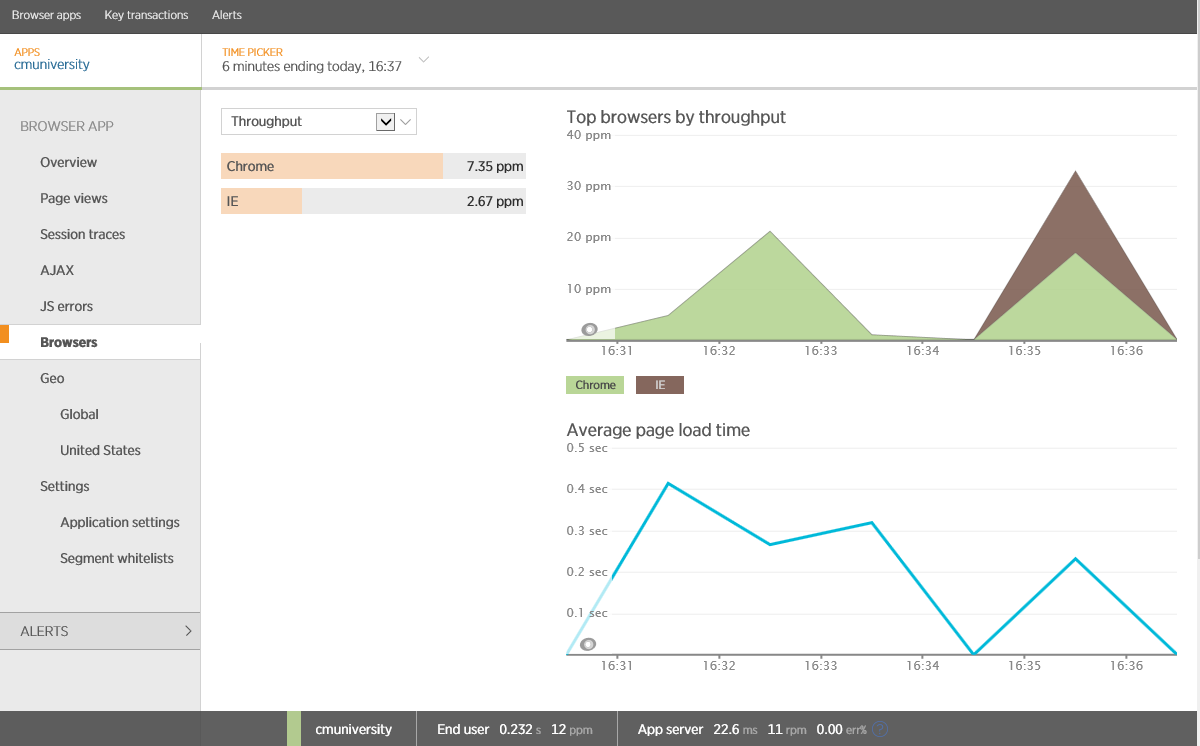
Analysis of browsing by browser in New Relic
Please note that New Relic builds a report for various browsers. There may be a correlation between the type of device and the operating system - most likely Apple devices will work on iOS and use the Safari browser, Android devices will use Chrome, and Windows devices will use Internet Explorer. There may be exceptions: other types of devices, browsers and operating systems, in which case you will need to use code that will save data about the device, operating system and browser. Below is an example of using Application Insights to collect client OS information.
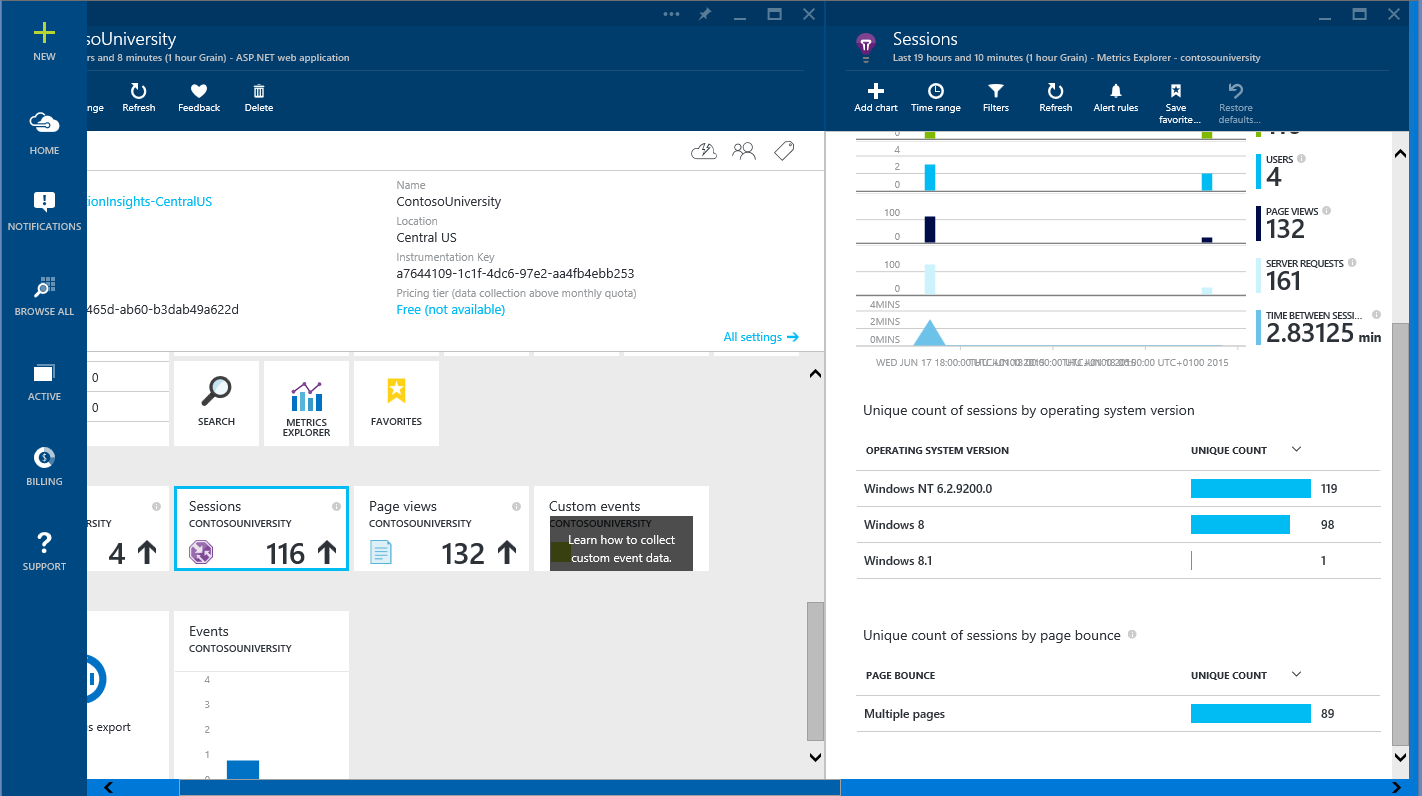
Session analysis by operating system compiled using Application Insights
Javascript and html rendering errors.
JavaScript and HTML code in web applications may not use all supported functions. It is important to find them and determine how to correct the situation - this can be done using APM utilities, many of which are capable of catching rendering errors and JavaScript.
Geographical location of clients
The geographical location of clients is usually associated with page load time, as well as with delays that occur when using the application. Many customers will come from places other than the location of your application. Data on the location of clients can be extracted from resources that take a considerable amount of time to load. This information may be useful when designing applications that should provide minimal delays (even depending on the region). The figure shows a graph of average page load time depending on the state in the United States.
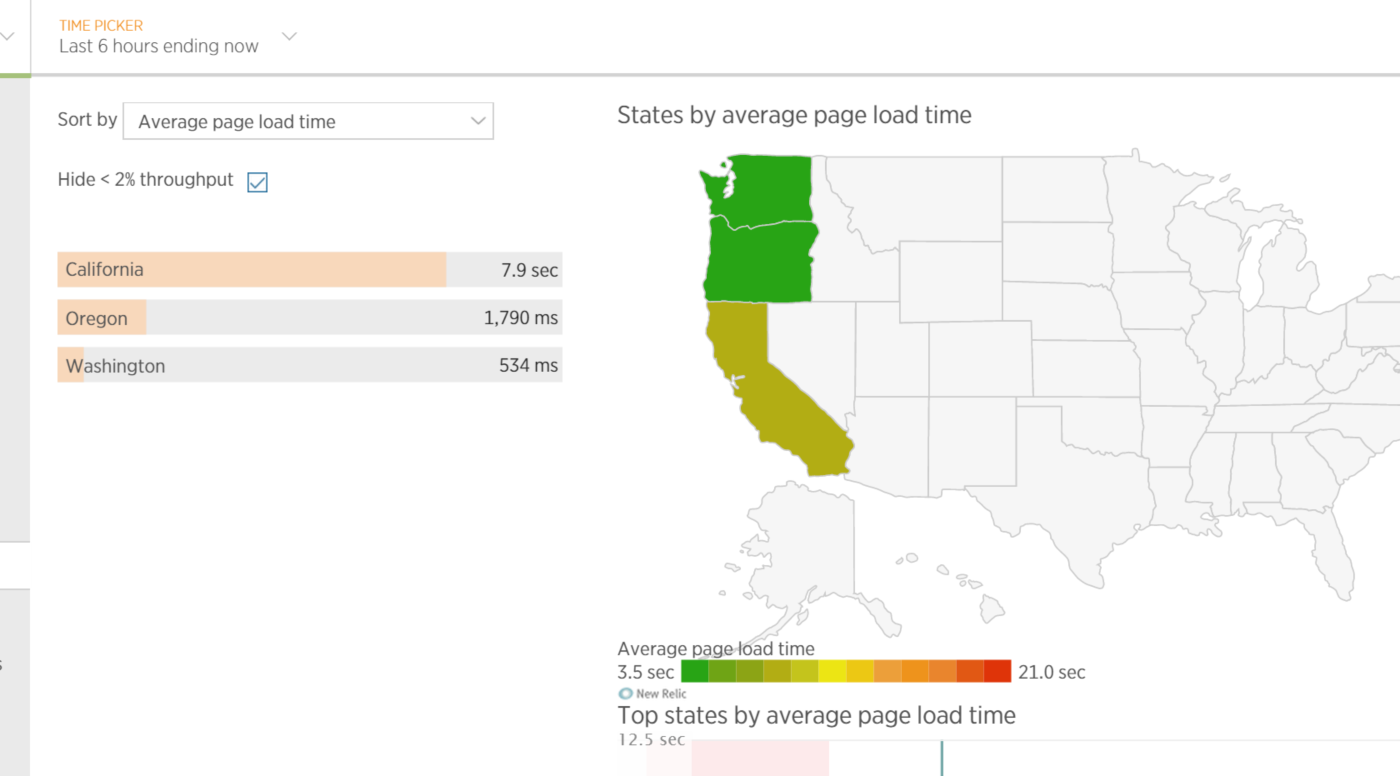
Average web application page load time depending on the location of the client in a particular US state
Session ID and User ID requests
In some situations, it may be useful to trace user activity or specific sessions. Most APMs cannot conduct such a trace by default, but allow you to add custom user metrics (explicit insertion of trace calls into client code) to monitor user activity (ignoring confidentiality considerations).
Business metrics
Business metrics are aimed at measuring the volume and frequency of business transactions and transactions. These metrics can help you determine if your application meets the required business expectations — for example, for an application that processes large amounts of video (a video server), you may need to measure the number of video files downloaded over a period of time, the speed of searching for the desired video, as well as how often they watch this or that video.
This process usually assesses the business impact on the system as a whole, by examining and aggregating business telemetry data, which is collected in real time with a comparison of historical data. By collecting these long-term analytical data, the business analyst may be interested in such pressing issues as determining why business operations fail to intersect with performance problems.
How to collect them
There are many APM tools designed specifically to collect such information. For example, New Relic uses the .NET Profiling API — monitoring agents are registered as CLR profilers when the application is started.
This process does not require changing the application code. New Relic agents intercept CLR calls and save them to the repository. = New Relic = can represent intercepted telemetry as a stream of activities in the context of time. If you need to intercept additional information, New Relic has an API, using which, you can include collecting custom metrics.
Using this approach, New Relic can collect data about individual business transactions that customers call. You can put this information together in order to display throughput (in requests per minute) and average response time (in milliseconds), as shown in the figure.
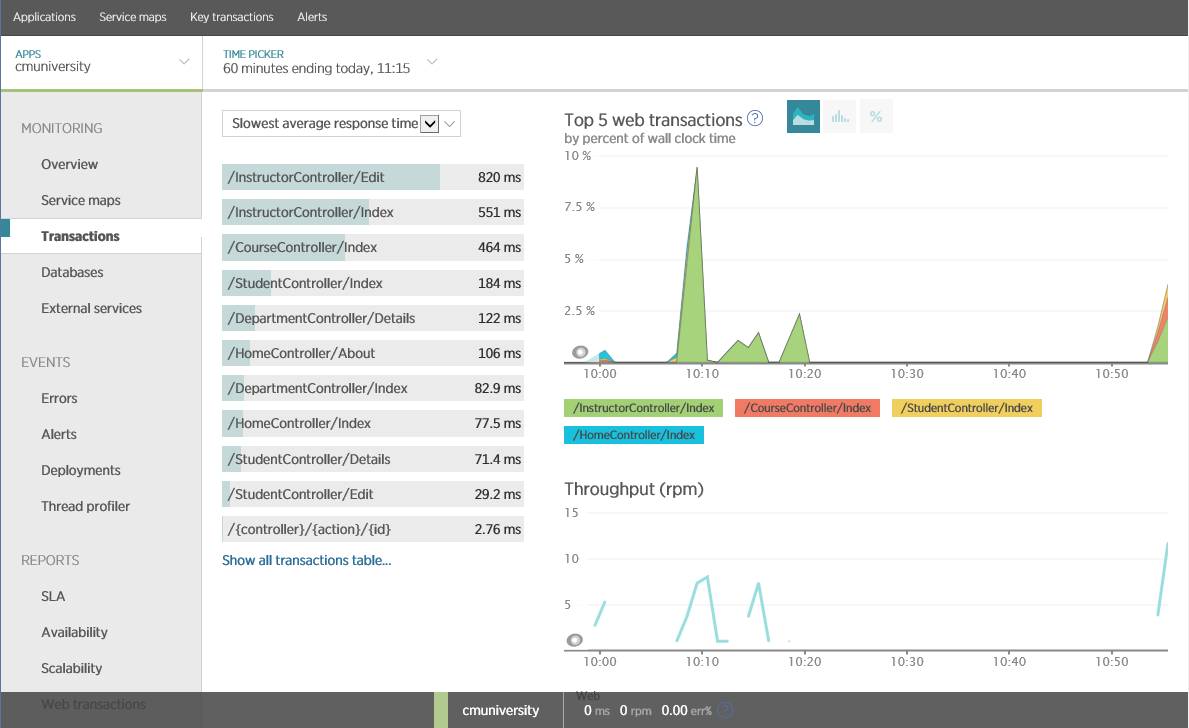
Average time of operations in New Relic
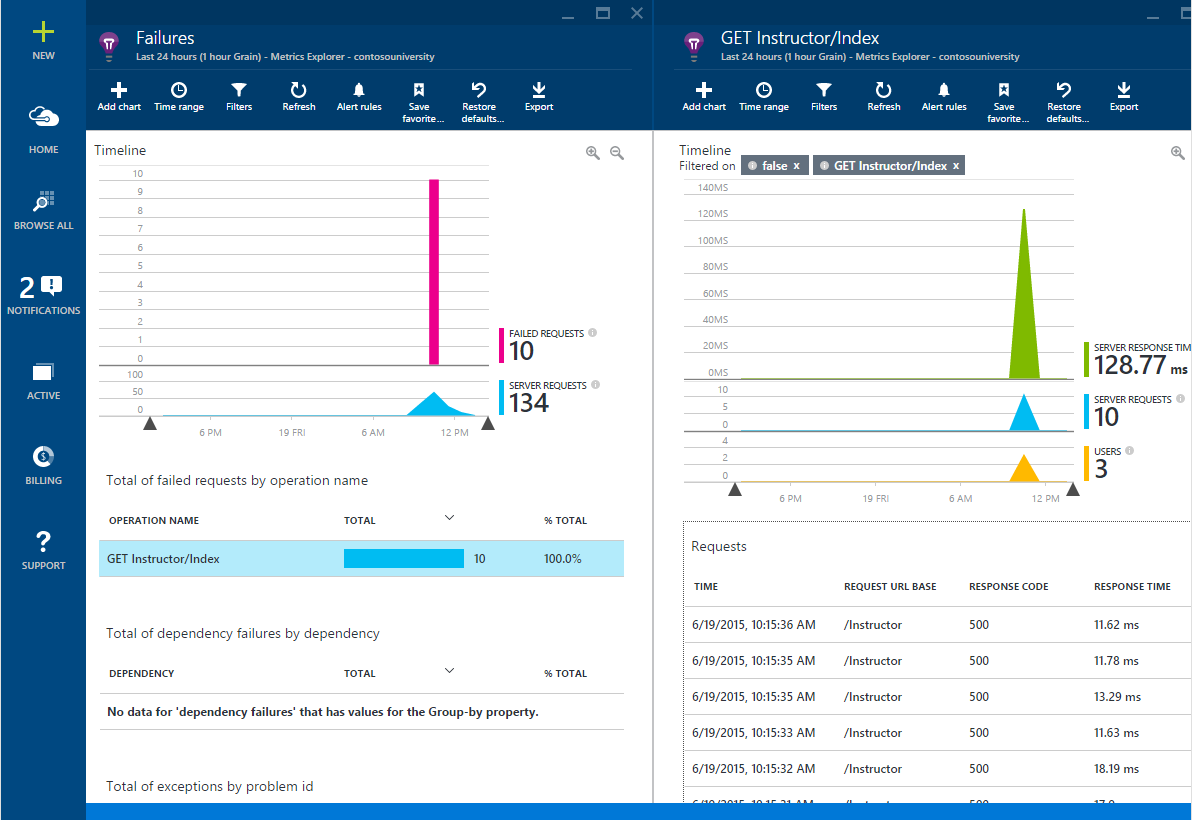
Application Insights has similar features that allow you to record performance and throughput for each operation in a web application.
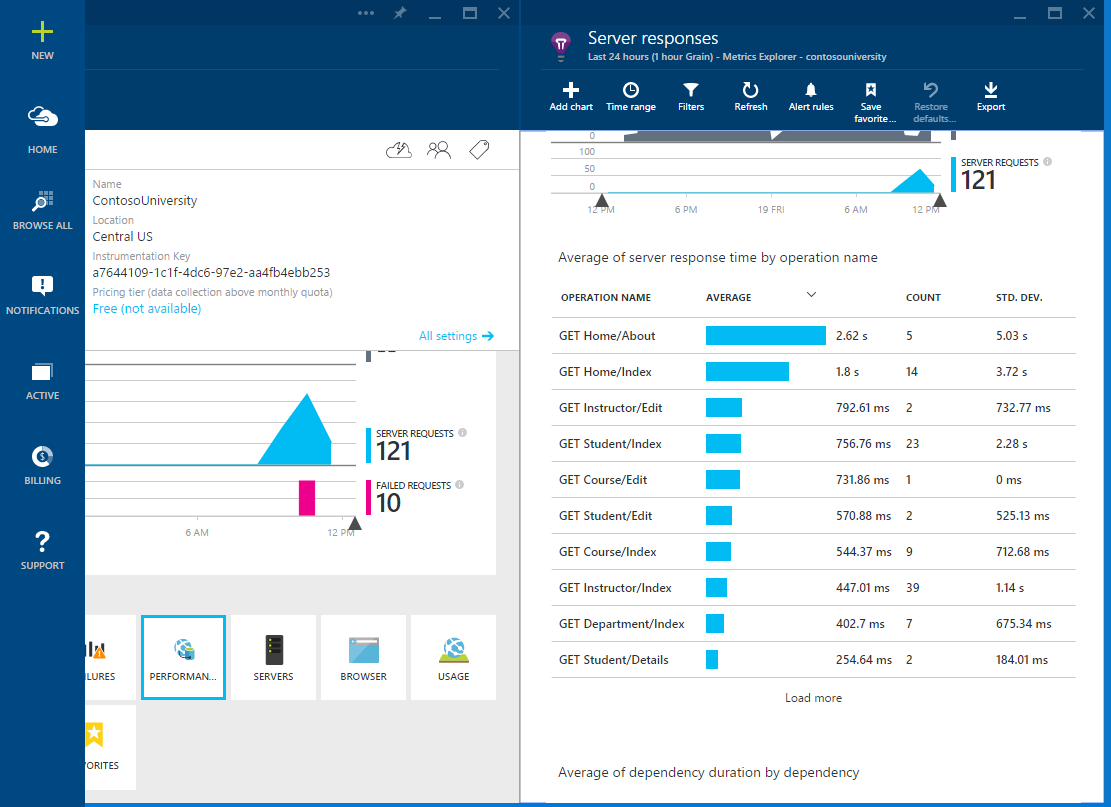
Average operations time in Application Insights
Analysis of business metrics to determine long-term trends requires access to historical telemetry. Many APM tools have the ability to store data for a certain period (for example, over the past 30 days), but analyzing the data may require collecting, logging, and downloading performance data to local tools like Excel. This data can come from various sources (event logs, performance counters, application and server traces). You must configure your applications to save key performance metrics that analysis may require.
What to pay attention to?
Consider choosing business metrics for monitoring.
Business Transactions Breaking Service Level Objectives (SLO)
If any of the business transactions are violated by SLO, an appropriate warning should occur. SLO is part of a Service Level Agreement (SLA), and this document describes the acceptable level of business operations for your organization. The SLO must be defined in terms of measurable aspects of the system, such as the percentage of operation response time (for example, 99% of all requests for operation X must be performed in time Y in ms or less). You should be aware if your system does not perform SLO. Application Insights allows you to define rules that can send corresponding notifications to operators in case performance metrics exceed the thresholds specified in these rules. The example in the figure shows the rule setting - sending an e-mail message if the response time of any web page exceeds 1 second.
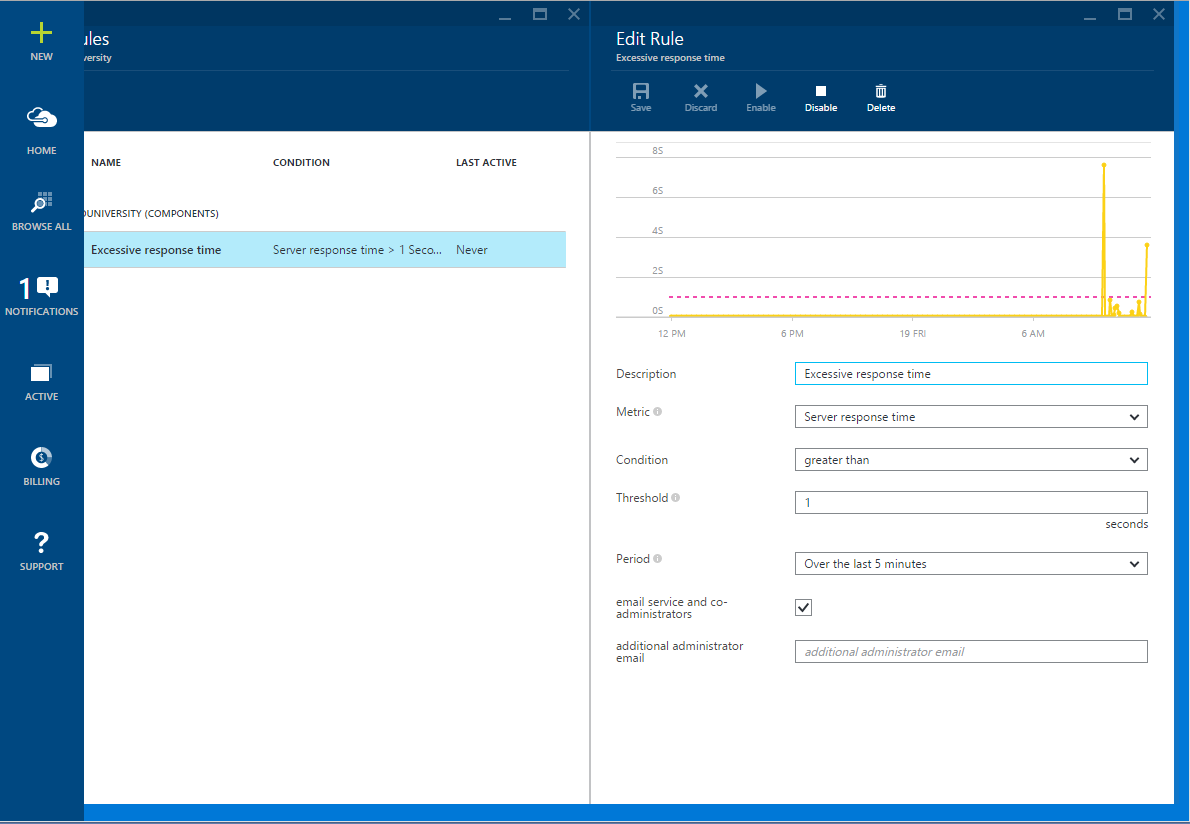
Creating a notification in Application Insights
The figure below shows the notification from Application Insights.
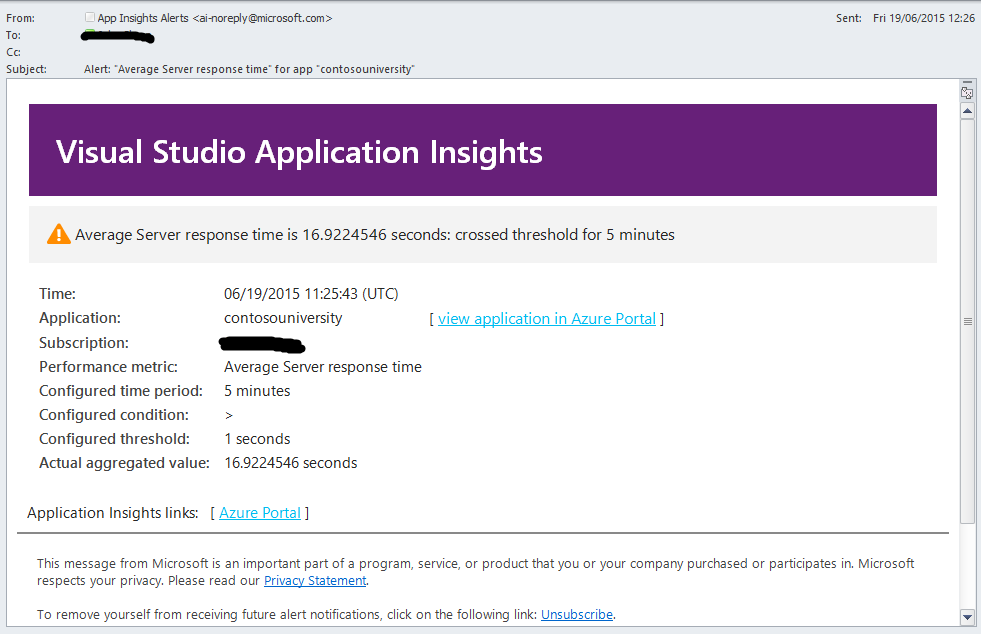
Application Insights Notice
The operator can use emails to view current system status. New Relic also allows you to set policies that can trigger a notification when the System Performance Index (Application Performance Index or Apdex) for business transactions shows poor performance.
Note: Apdex is the industry standard for units of measure whereby 1 shows excellent performance, and 0 means problems. More information about this can be found on the website APDEX.org
The figure below shows the default policy for transactions in New Relic. A warning is generated when the average Apdex value in the interval for 10 minutes falls below the value of 0.85 or below 0.7 in 5 minutes. A warning is also generated if the error rate exceeds 1% in 10 minutes or 5% in 3 minutes. New Relic will also create a corresponding warning if the web application is unavailable for 1 minute (the test is performed using ping on the preconfigured endpoint of the application).
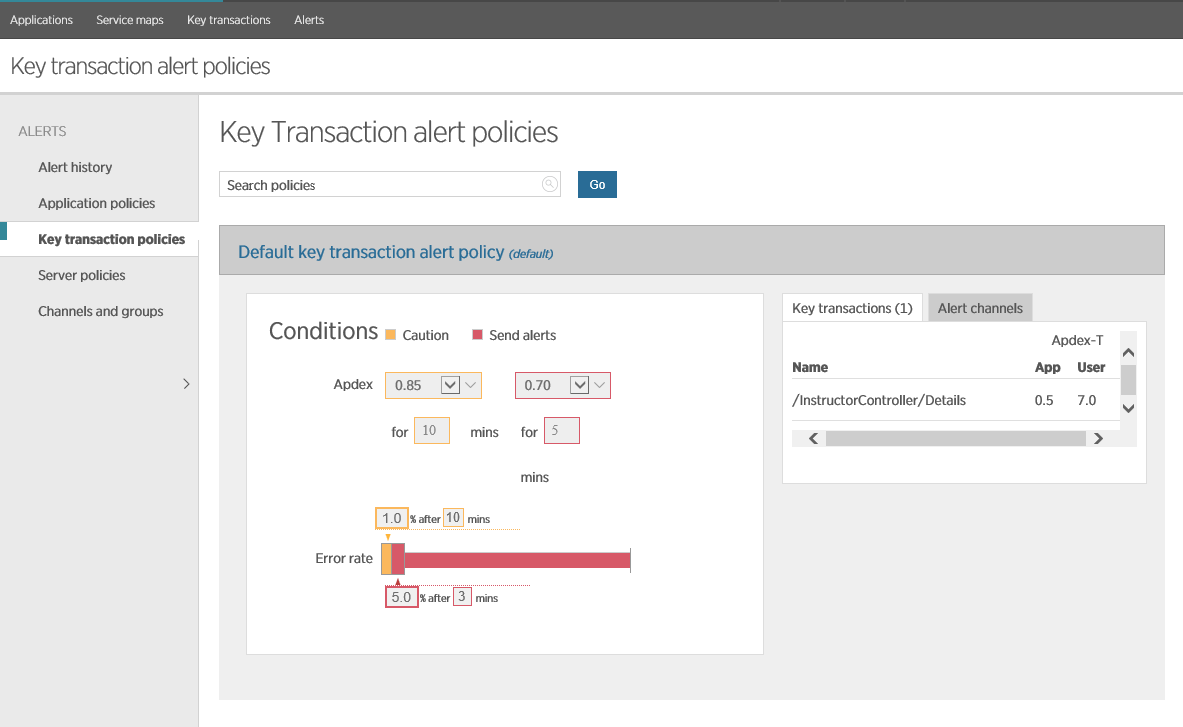
Configuring Notifications in New Relic
Falling business transactions
All business transactions must be monitored for failures. SLO warnings can indicate recurring problems for a specific period, but they are also important for determining the causes of individual failures. Information about exceptions can be obtained in various ways: the application can write them to the windows event log or use APM custom logging (which was described earlier). The following figure shows how this information displays New Relic.
Exceptions in New Relic
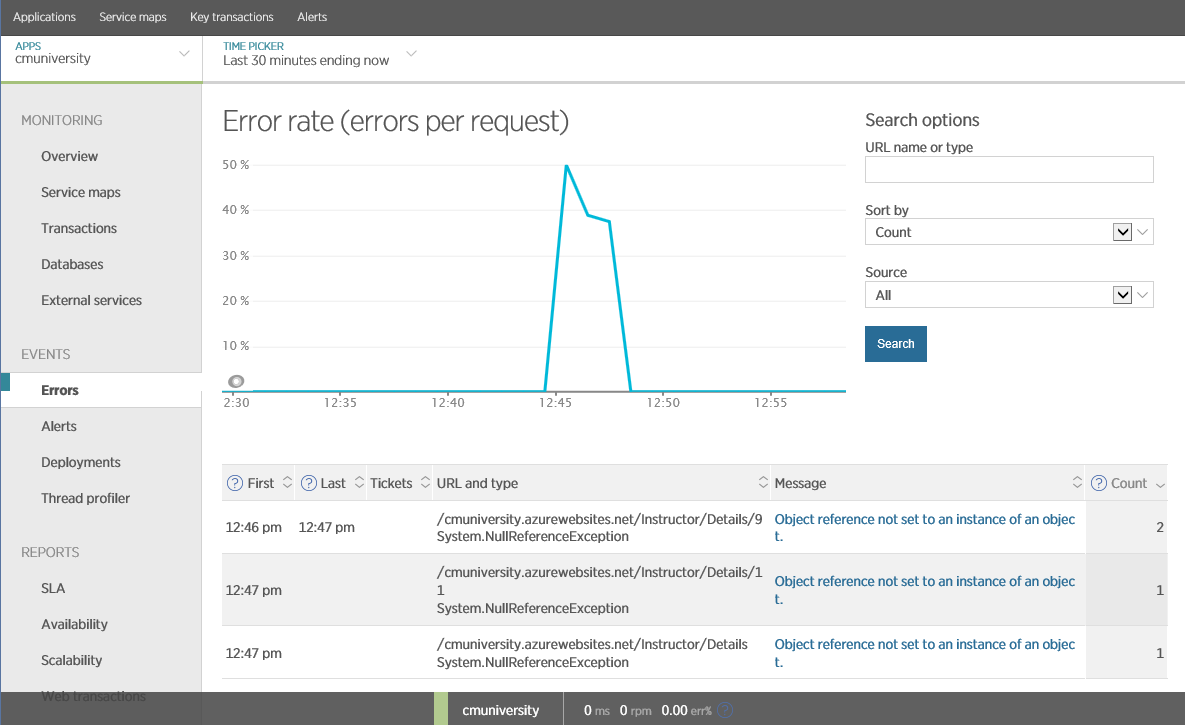
You can get similar information using Application Insights, as well as determine, through it, the causes of individual exceptions.
Failed requests for Application Insights
Patterns of bandwidth and response time of business transactions
All business transactions should be monitored for bandwidth and runtime, which will allow for a dynamic analysis of historical slices. This requires that APM has access to historical data. Many APMs can create reports that allow you to analyze historical performance data of individual operations. The report below was generated using New Relic, it shows how the current performance of various web transactions correlates with the data obtained from yesterday.
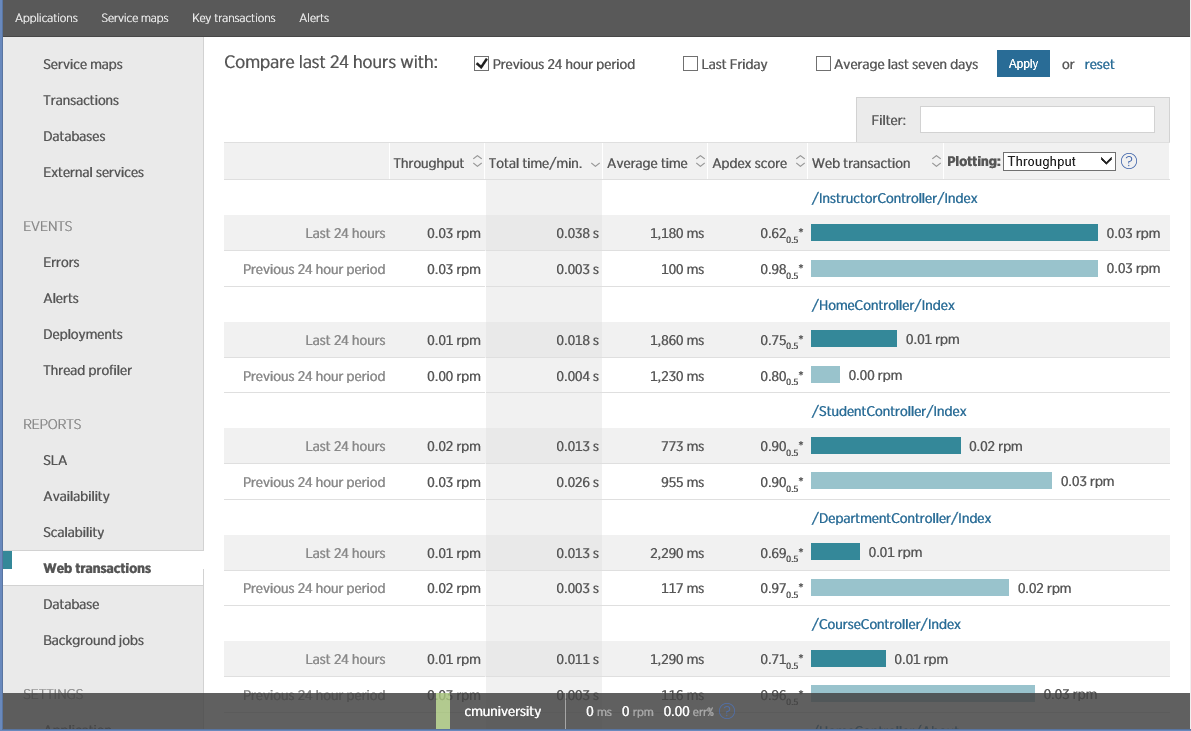
Patterns in New Relic
You can customize and modify these reports. One of the features of New Relic is the ability to compare the performance of the current day to that of the same day last week. If the business is cyclical in nature (on some days a large load is expected than on others), then this form of analysis may be useful.
If you have access to historical performance data, then you can download and analyze it. For example, you can load them into Excel and build reports on the performance of your system depending on the time of day, day of the week, a specific operation, or depending on the user.
Application Metrics
Application metrics imply a low-level view of how well the system works under load (what exactly happens under the application “hood”). Obtaining this information requires tracking application logs, database connections, and how the application uses external services (cache, ServiceBus, authorization / authentication, etc.). Framework metrics are also important - ASP.NET and CLR counters (for applications built on .NET), information about exceptions, blocking resources, and using threads.
How to collect them
Many of these metrics can be obtained very simply using system performance counters or other services provided by the operating system. As described earlier, many APM tools also allow you to embed (without manually changing the code) various diagnostic modules in your system that can capture information generated by the application (database calls, third-party services, etc.).
If necessary, you can also embed custom functions in the code of your application to highlight external API calls and other significant actions (such code changes should be minimized, as this affects the overall performance). This can be done using logging (connecting the logger interface) or an advanced API that the APM you use provides.
Note: This approach binds your application to a specific API, which requires manual insertion into the code of certain diagnostic calls that are waiting for data in a specific APM-specific format.
Causes of high latency and low bandwidth
The operations performed by the application include not only interactive requests from users, but also batch processing and periodically running background jobs. Monitoring the business layer can give you information about how much SLO is being performed. Application metrics provide insights into why this is not happening — they may contain information about various aspects of queries and how they are performed within the system.
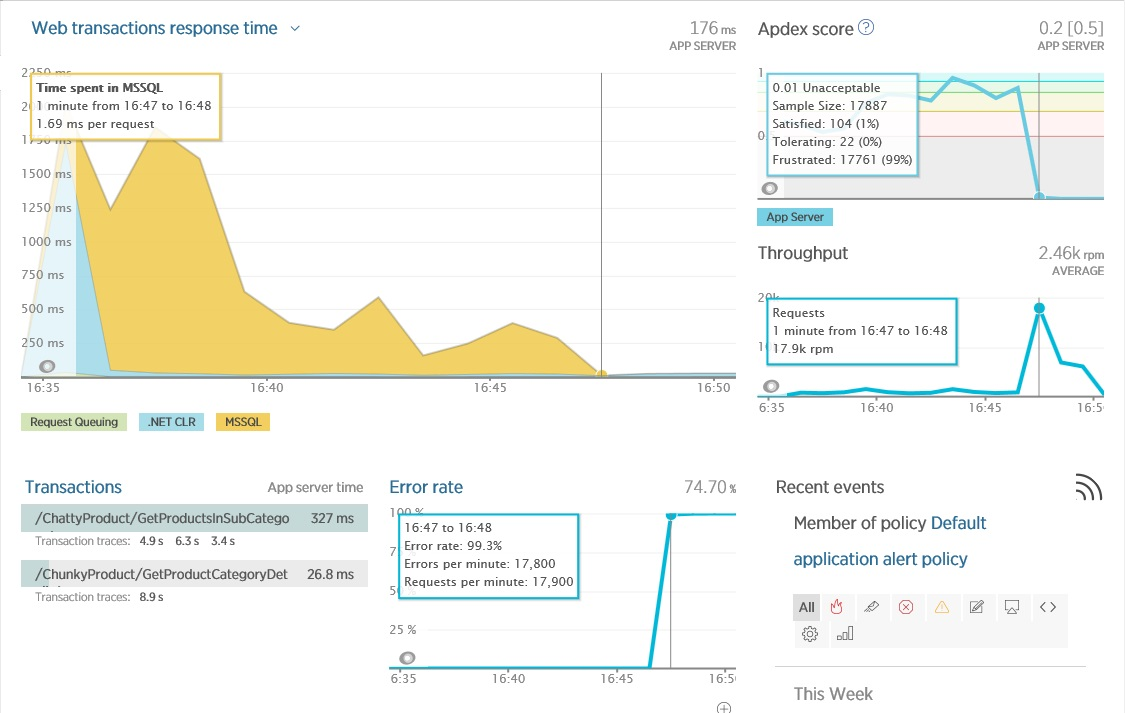
The figure below shows the main screen of New Relic, which shows the performance of the working system. The operator allocated a point in time when the system performed heavy database operations (MsSQL DBMS). The figure shows that the application performs them poorly (Apdex at the level of 0.53, which indicates some problems). At this time, the throughput was 710 requests per minute. The operation of the application is characterized by two operations (web transactions), one of which - the transaction at ChattyProduct, apparently, constitutes a large part of the server time.
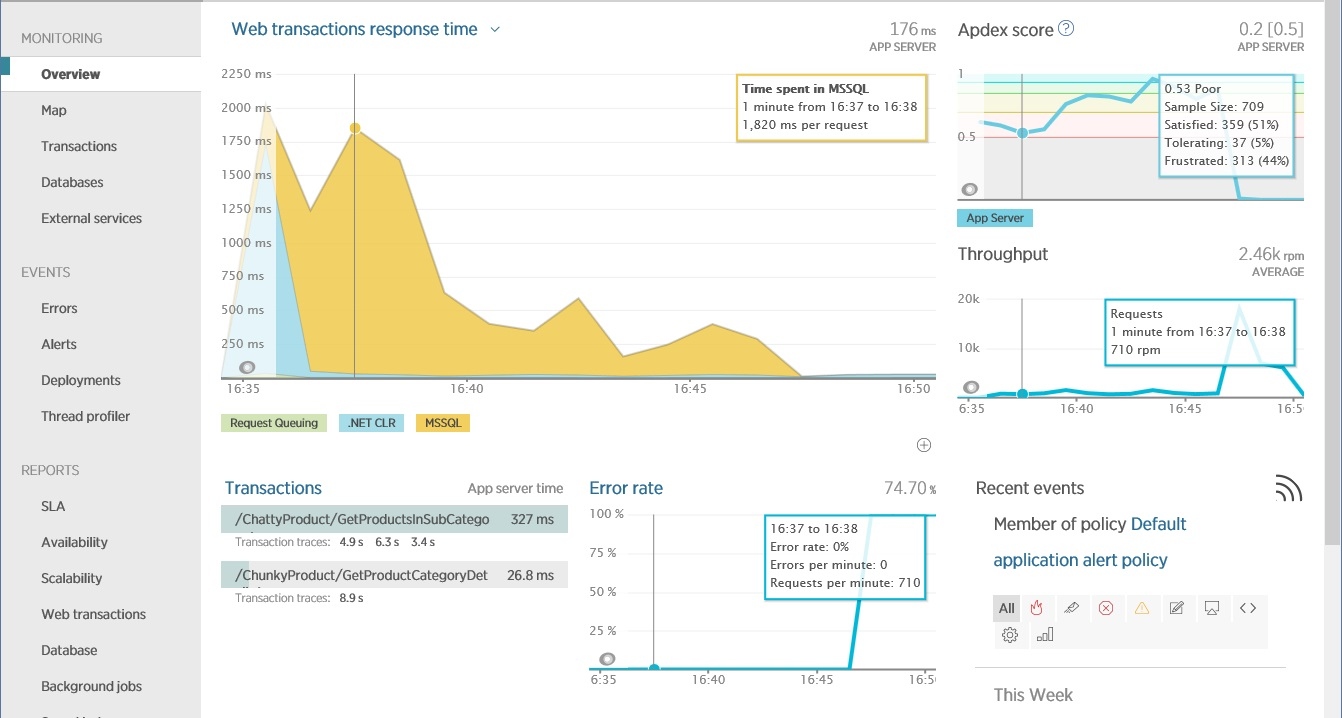
The Overview screen in New Relic, showing bandwidth and latency in a web application in a short amount of time.
For ChattyIO queries, you need to understand which resources are being used inefficiently. Telemetry will provide an opportunity to detail the request to determine what it actually does. In New Relic for this purpose it is proposed to do transaction tracing as shown in the figure.
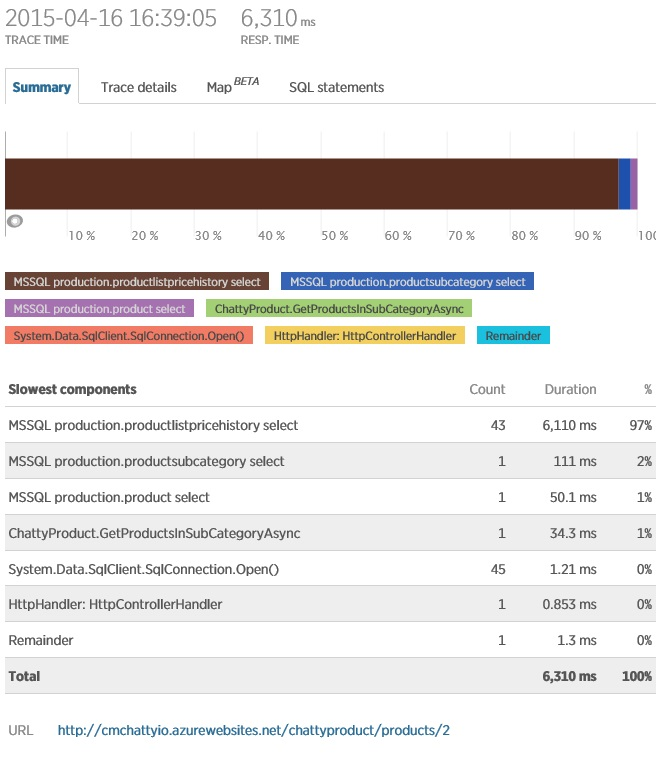
Obviously, the operation uses significant database resources, opening 45 connections. One specific request is executed 43 times. This DB activity may explain why an operation takes time to complete.
A deeper look at the trace details shows how the operation works with the connections — it creates them for each query, rather than re-using existing ones.
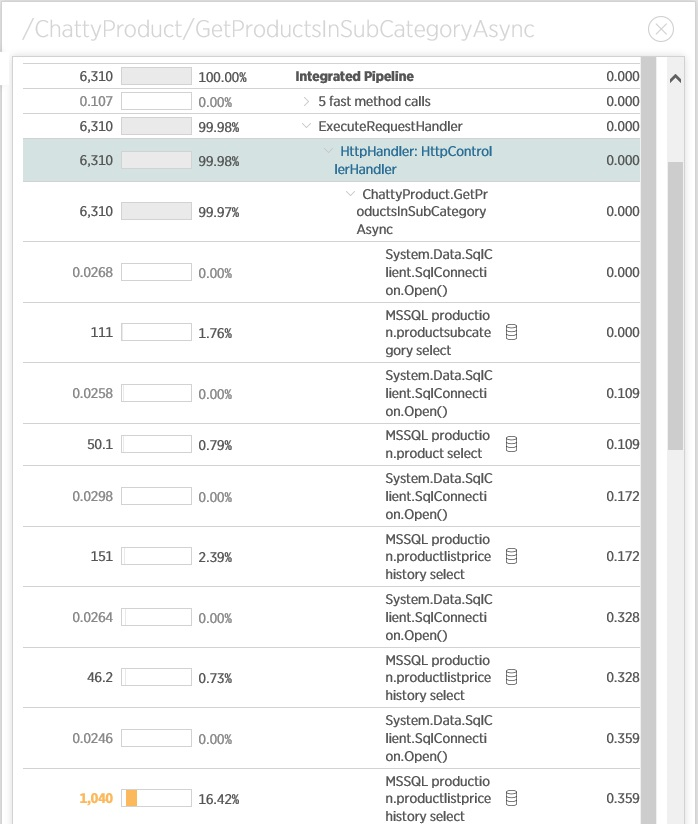
This operation should be analyzed in order to optimize the number of connections and queries to the database.
Exceptions
Exceptions are often the cause of user frustration. They may indicate an error in the code, but they may also result from excessive consumption or unavailability of resources. To avoid loss of business and financial problems, it is necessary to identify the causes of exceptions promptly.
On the Overview screen in New Relic (see below), it is clear that something led to a large number of exceptions. This caused a significant drop in performance (Apdex dropped to 0). At this point, there is also a significant jump in throughput, which is probably due to errors leading to rapid disruptions in operations.
The study of errors on the Errors screen in New Relic provides additional information, including the details of the exception and the operation that was performed at this point. Please note that New Relic allows you to switch to internal exceptions to get a full stack.
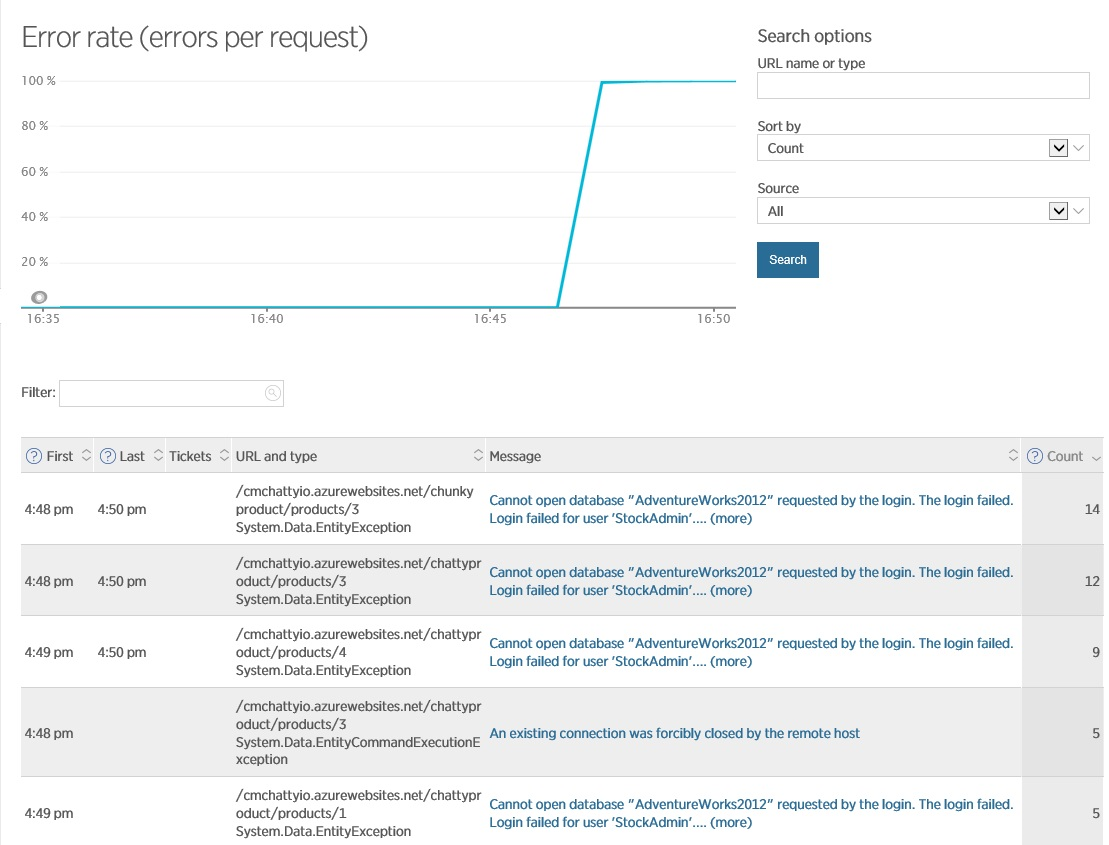
This information gives you the understanding that the problem lies in the database - sometimes the connection falls off. This may be due to the previous scenario - opening a large number of connections, which can exhaust the resources available for the connection and lead to the fact that when executing new queries it is not possible to create new connections to the database, or it may be a problem with the database itself, which requires checking server.
Framework Performance
The code of your application in runtime can use technologies such as the .NET Framework, ASP.NET or other frameworks. It is important to understand that they have an impact on the performance of your system. In many cases, they provide their own metrics that allow you to look inside the processes occurring in the application, which helps you use these mechanisms more efficiently and optimize the code. For example, .NET performance counters include metrics showing how part starts the garbage collection process, and how many objects are on the heap. You can use this information to identify memory waste and associated resources in the code of your application (for example, creating unreasonably large arrays, constantly creating and destroying large strings, or errors in incorrect destruction of resources).
Web applications depend on the web server, which accepts requests from the client and redirects them to the processing code. Business workloads for cloud applications can be very asymmetric, with unpredictable high activity surges that are followed by rest periods. A typical web server is able to process only a certain maximum number of concurrent requests, so other requests can be queued. If the request is not processed within a certain period of time, a timeout error may be returned to the client. On some systems, if the number of requests in the queue exceeds a predetermined threshold value, subsequent requests will immediately be dropped with an error message that will be returned to the client. This is a built-in security mechanism to prevent unplanned spike in client requests. This strategy also prevents the client from being “blocked” when the request is likely to return with a timeout error. However, if this happens frequently, then it may be necessary to distribute the load across multiple web servers or to research the application for problems or optimization. Therefore, it is very important to control the speed of processing requests, as well as the number of requests waiting in the queue. For example, for ASP.NET applications you can use the following performance counters:
- ASP.NET \ Requests Queued, the number of requests waiting in the queue for processing
- ASP.NET \ Requests Current, the total number of requests currently running. The value of this counter includes the number of requests processed in the queue and waiting to be sent to the client. If this value exceeds the requestQueueLimit parameter, which is located in the processModelsection section of the web server configuration file, subsequent requests will be discarded.
- ASP.NET Application \ Requests Executing, shows the number of simultaneously running requests.
- ASP.NET Application \ Requests / sec, current application bandwidth
- ASP.NET Application \ Request Execution Time, execution time (in ms) after the request
- ASP.NET Application \ Wait Time; timeout in queue of the last request.
Note: By default, the IIS, ASP.NET and .NET Framework configuration is optimized based on the number of CPU cores. But for applications that frequently perform I / O operations (for example, web services using external resources), some changes to this configuration can significantly improve performance.
Let's continue to look at examples with a web server. You should always investigate the reasons for the long queue length. A large number of pending requests in conjunction with a low CPU, network utilization, or memory may indicate problems with the backend. For example, if the cloud service for data storage uses a SQL database, and the latter contains some processing logic (stored procedures, triggers), then the database itself may be a bottleneck, which will lead to the accumulation of requests in the queue. If the performance monitoring of the backend services shows that they are working normally, but the queue length of your application will be preserved, then the lack of threads caused by the blocking of synchronous operations may be the cause of the web server problems.
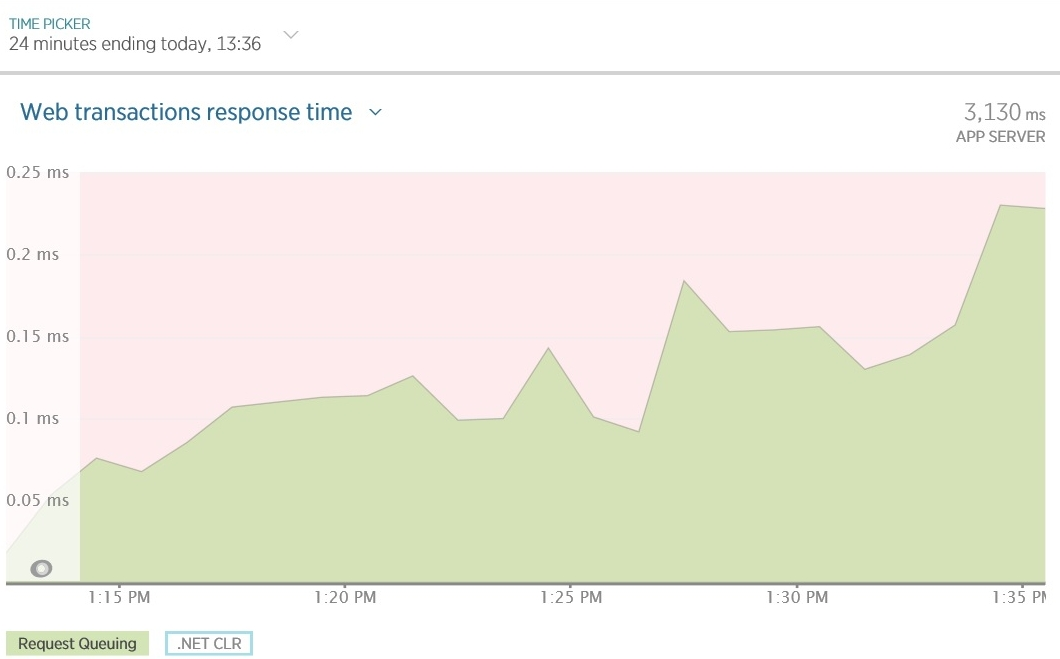
Below is an example of a diagram (created by New Relic), in which a simple application has a waiting time in the request queue due to synchronous I / O operations. Due to the lack of available threads, IIS becomes unable to execute requests in a timely manner and the time spent in the queue gradually increases. Note that the CPU time and network utilization (shown in the second graph) is very low.
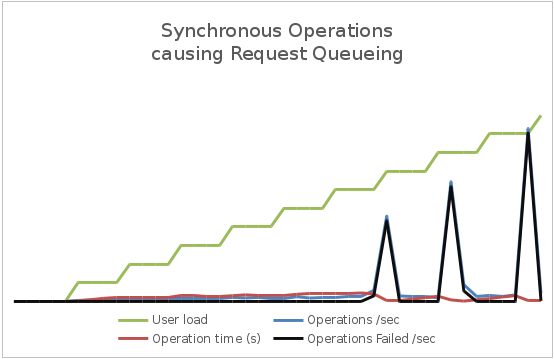
As the queue length increases, response time increases and the number of failed requests increases. The graph below shows the load test results of a simple application. As the load increases (the number of simultaneous users), the latency (operation time) and throughput (number of operations per second) increase. Notice that the left axis represents the user load, and the logarithmic right axis measures latency and throughput. When the user load exceeds the 6000 figure, requests begin to generate exceptions (either timeouts or failures due to excessive queue length). These exceptions lead to a decrease in latency and an increase in throughput due to the fact that the exception is generated faster than successful requests are executed.
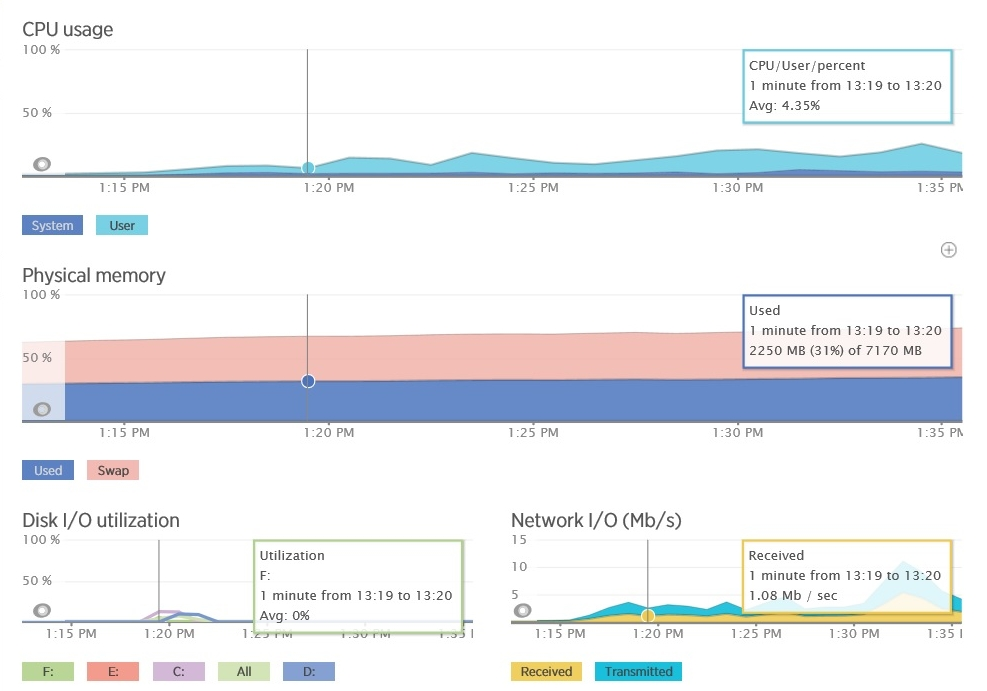
Along with the increase in the user base, the overall load on the system will also increase. You must make sure that the system does not reach the point where it may suddenly collapse under load. To do this, it is necessary to control the use of shared resources by the system (CPU, memory, network bandwidth, etc.) and the graphs of the dependence of this information on bandwidth and latency and / or delay. This form of measurement often requires you to monitor the infrastructure metrics and telemetry of other services on which your application depends. As an example, the following figure shows the New Relic telemetry from the application described earlier - we see data on memory usage and CPU usage for the application. Utilization (loading) of a processor is a relatively constant value within certain bounds (if there are several processors in the system, its utilization may exceed 100%), despite the bandwidth differences. You need to check if the system will start generating exceptions at this point. If so, this may indicate insufficient capacity to increase the load. Memory utilization is also fairly stable, although it can grow slowly with the load. But if it starts to grow without any reason, then this may indicate a memory leak.
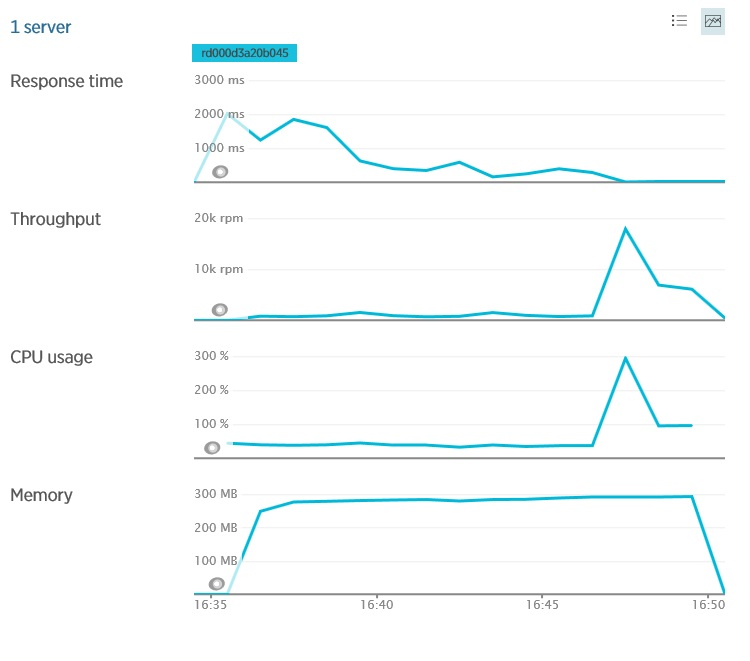
Server Resources at New Relic
Thank you all for your attention! In the next, and final part - about system metrics and other points of interest for analysis.
Parts of the article:
Key Performance Indicator Analysis - Part 1
Analysis of key performance indicators - Part 2, analysis of user, business and application metrics
Analysis of key performance indicators - part 3, the last, about system and service metrics.
Source: https://habr.com/ru/post/272467/
All Articles