Palantir 101. What is allowed to ordinary mortals to know about the second most abrupt private company in Silicon Valley

(For the translation, thanks to Alexey Vorsin)
Good morning and welcome to GovCon7. My name is Sod Abdulli and I am the lead implementation engineer at Palantir Technologies and this is Palantir 101. I would like to tell you in the next half hour or forty-five minutes about what it is, who we are, what Palantir is, and what it does for organizations with which we We work, and also, closer to the end of the event, we will hold a small presentation.
')
Before turning to all this, I want to start with a couple of stories that should shed light on what Palantir and we are thinking about the problem of analysis in the Big Data world.
The first story is a story about chess.
Many of you know that in 1997, IBM created the Super Blue supercomputer, which defeated Garry Kasparov, who at that time was the best chess player in the world. Now, in a simple mobile phone, chess can be installed, playing at the tournament level, and the question of who is stronger in chess, a person or a computer, is no longer relevant.
A new interesting question: “What will happen if a person and a computer play chess together as a team?”
First, such teams showed high efficiency, and, in fact, it is quite expected, as people are good at chess, computers are very good at chess, but they are good for various reasons: computers have a serious tactical advantage, they can appreciate many thousands of combinations every second; people have experience, ability to tricks, flair and the ability to feel the opponent, which is hard for a computer.
These forces are combined and the team of people / computers is able to win and teams of the strongest players and associations of the strongest supercomputers.
The second is a bit more complicated: you can decide that once a team game is stronger, you can take the strongest player and the strongest supercomputer, put them together, and they will bend over the entire chess world. You are wrong.
In addition to the player’s own power, which is skill, and the computer’s own power, which is hardware and software, there is a third factor — the quality of the interaction between them. How easy is it for a player to formulate a request? Is it possible for him to concentrate on what he is really good at, leaving the computer the rest? These questions are close to the point of view we profess at Palantir to help organizations effectively interact with Big Data.
All our efforts, thus, are focused on reducing the number of unnecessary operator access to data (frictions).
The next story is about PayPal, you may have heard about it.
When PayPal started, there were several other companies involved in the online payment industry, including financial heavyweights: Citibank, Western Union and the Internet giant Ebay. Everyone has their own payment systems. In the end, they, one by one, fizzled out, and the startup PayPal succeeded.
How did it happen?
There is one important note about the payment systems of those times: with the main problem, the execution of transactions from one account to another, everything was mastered, more or less; another problem, no less important, was to commit the transaction so that it would not be dragged by the Russians.
A huge number of transactions, a huge flow of incoming data, and very little time to check it all out - there really are opportunities for a scam. Buyers are not going to wait for weeks while you investigate each payment, so what you need is the ability to quickly decide whether a transaction is clean or suspicious. This is now, basically, the problem to which PayPal and the rest have come up differently:
Many have decided that since we have a lot of solutions and not enough time, then the person will not cope and it is necessary to maximally decompose such solutions into operations, formalize them, make them repeatable and fast - algorithmic, in other words. This was not enough.
PayPal started with the same thing: a lot of solutions, a large amount of data to process and little time - but the conclusion was the opposite - to maximize human efficiency with the help of hardware. Thus, the focus has shifted to helping a person make decisions faster, speeding up processing and facilitating information retrieval. Ebay bought PayPal for one and a half billion dollars. They solved the problem for themselves in this way.
The people who created PayPal became famous in Silicon Valley, some of them founded Palantir, well, you heard about it.
Palantir faces the following tasks: to provide quick analysis and decision-making with an ever-increasing flow of incoming data, which is important in payment systems, including countering fraudsters, as well as in law enforcement, in medicine, in intelligence, in the military sphere . The amount of data is constantly growing, as is the need to make decisions using data.
What is Palantir ?, - you can ask. One sentence is the analytical infrastructure.
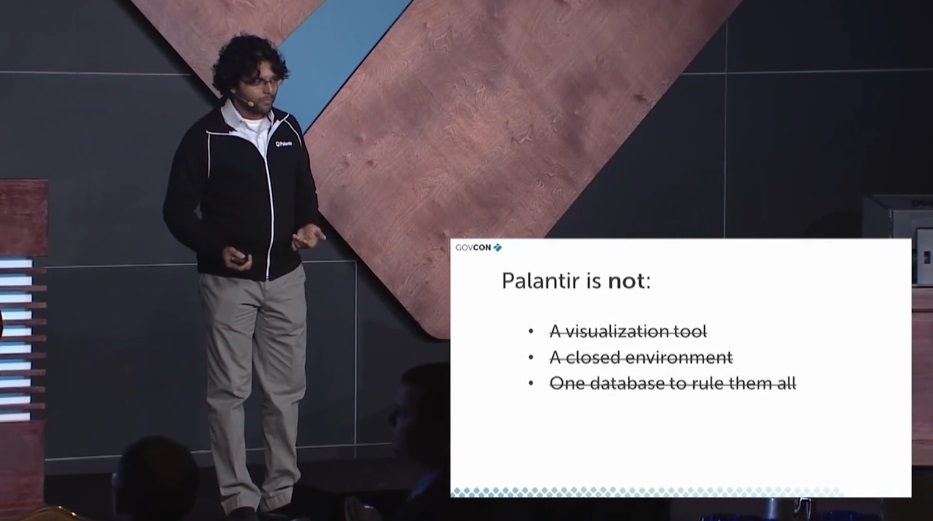
I use the word analytic very, very deliberately, the fact is that Palantir is definitely not a visualization tool, (apparently my friend too often has to explain it) at first, many people think so. The interface is just an interface, inside there are a lot of interesting things, we will see it a little later.
Palantir, also, is not a closed environment, and was originally conceived as open as possible. In practice, this means that Palantir supports the open data format and any data, in whatever form it may exist, can be loaded and unloaded back. Also, this means compatibility with any third-party applications, if you use them. We use an open and public application programming interface, that is, third-party companies can create new applications and expand functionality on our platform, like on smartphones. Finally, Palantir is not one database above all others (one database to rule them all is an allusion to the Lord of the Rings), that is, the idea is not to replace all your achievements with Palantir, but to simplify your work.
If we talk about what exactly Palantir does, then we can distinguish four main layers, starting with the base:
1. Data Integration.
2. Search and research.
3. Knowledge management.
4. Collaboration.
Now more:
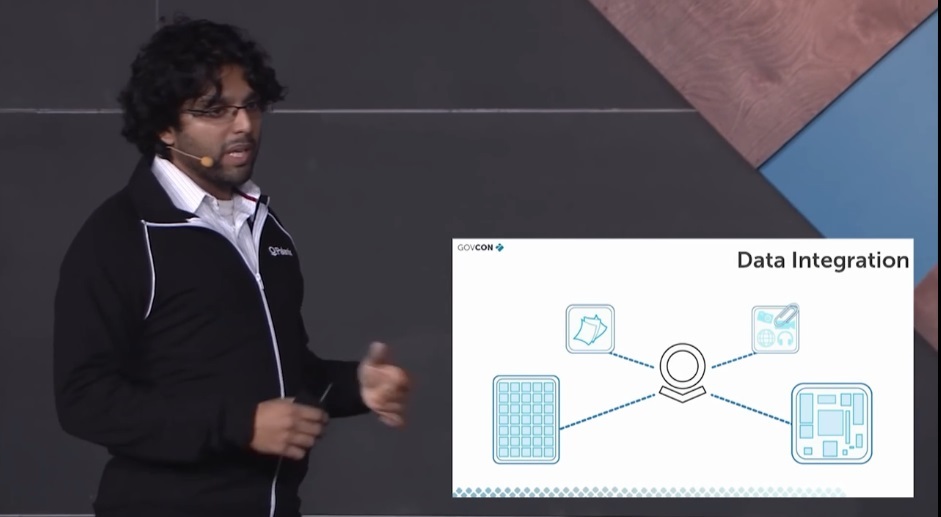
1. Data integration is what started Palantir. It means that we take all the data that you have, in any form, and integrate it into your single database, into a single accessible environment. It is fast, it will take days and weeks, not months. It is a flexible system and allows you to integrate not only traditional data sources, but also specialized ones, such as GPS data, maps, or video. This is a roomy system that can handle billions of records related to data.

2. Search and study - the second large layer of work. Palantir gives you the ability to search and access all the data through one single search line, and it’s not just about finding what you know, but also about tools that give you what you didn’t know. This is a conceptual search, based on interconnections between data, on networks of such interconnections, on what can be called the essence of things, this is a persistent search, and after I form some basic requirements about the information I want to see, Palantir will warn me of any information relevant to the nature of the request (pattern - pattern, trend, pattern; most likely we are talking about the essence of the request that the smart system catches). This is a search by time and place, so that we can understand what was happening there or then. The search is made with an eye to the desire to reduce the periods of operator's circulation with data. This is not only a familiar search by names, file types and databases, but also, for example, a search by people, events. I can directly ask: “Show me all the taxis that have stayed here for three weeks,” or: “Show me a map with tags of all crimes that occurred in my area in the last six months, and what is the difference with the previous half year”. It is simple and does not require special programming or development efforts for each request.
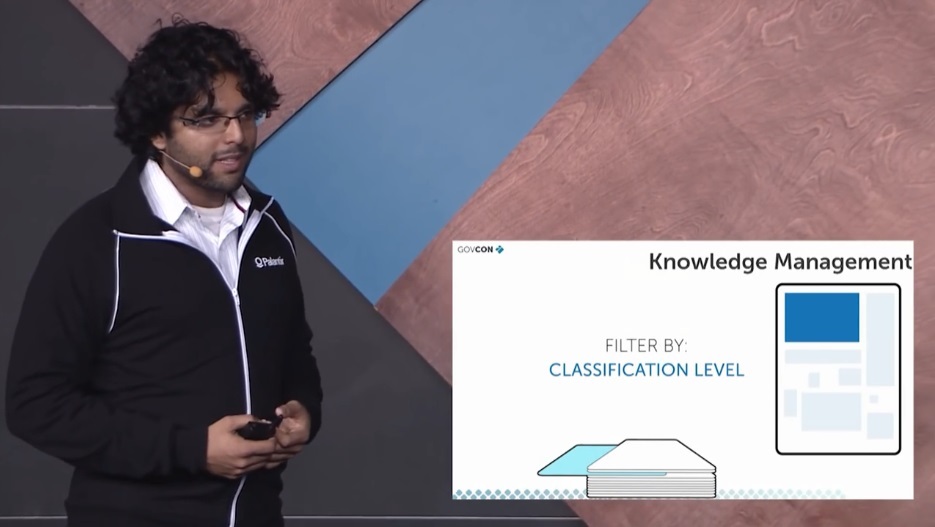
3. Generally speaking, search is important, but not enough. You can get information that Sod is an employee of Palantir, but you need additional information to use it, such as: where did this information come from, when it was entered into the system, who has access to the information. This is the third layer - knowledge management, the idea is that every knowledge was once created by someone, somewhere entered into the system, so changed over time, has such a level of access, and all this is taken into account. Both data and metadata are important.

4. Something we are missing. The data and metadata are abundant, they are cheap, both assembled and stored. The most valued resource - analysis, what your analysts produce, is human perception of raw information. We designed Palantir not only to simplify the analysis, but also to be able to share the results. This is the fourth layer - joint work. We give the opportunity to share the results, create a complete picture of the phenomenon through the efforts of many analysts. The idea itself turned out to be deeper than we originally intended. The idea is to have a general picture of the world. If we see different data, different sides of the phenomenon, we work separately. At the same time, having gained different pictures of the world, we are looking for ways to check them, compare and synthesize the total. For example, if there is a big software project, hundreds of specialists can edit it every day. Using this approach, we get control of the product version, the ability to control the process. We get the space where we can, starting from the big picture, make changes a little bit, test the hypotheses and finally collect the big picture again. It is also a protected way of work - everyone sees only the part that he is allowed to see.
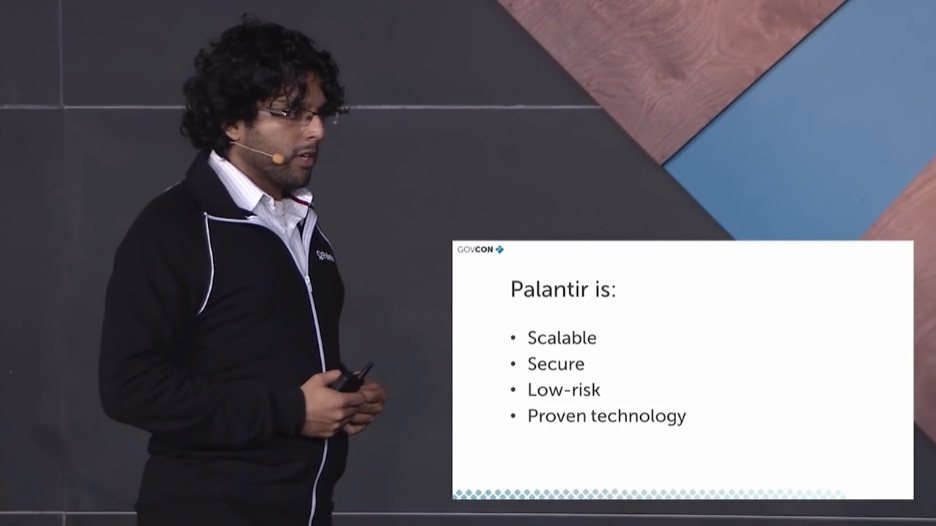
In general, Palantir:
- Scalable, allows many people to work with petabytes of data, in addition, these data can continue to grow in the course of work.
- Protected, that is, every fucking piece of information is tracked, and Palantir is already working with some of the most sensitive (most likely Sod means environments that are highly dependent on security) environments in the world.
- Low risk, that is, Palantir is not a project where you planted a seed, and wait six months or a year until it comes, it can be integrated in weeks.
- Proved its effectiveness. It is already used in health care, in law enforcement, used by banks, in countering fraudsters.
The technology is ready, the technology works. Now let's see how.
We will now demonstrate the capabilities of Palantir, a kind of day counter-terrorist analyst investigating terrorist financing activities in North Africa. You will see how I find something in Egypt. You will see the whole process from the moment new information is received. I will investigate and summarize.
I logged in, this is how the program looks like.

On the left, content, new incoming documents, in our case new intelligence "from the fields." Let's see my new tips.
A CT-Blue agent, from Cairo, reports that he was present at the Al-Mooj charity event, where there were several invited organizations. Attaches the cards of three invited, non-Americans, who discussed the attack on a significant object in the American city. I will take this data, enter it in Palantir and see if there is anything we can find.
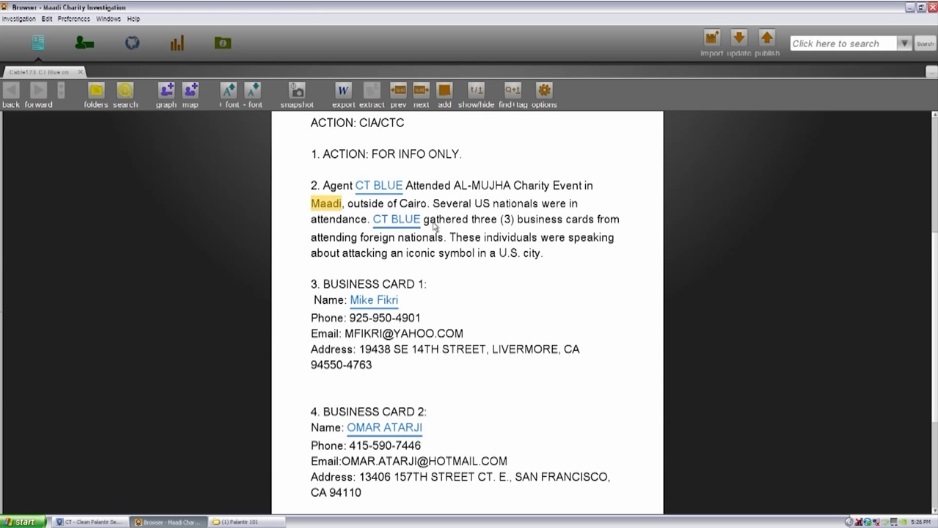
As you can see, here are blue links, it means that some of my colleagues have already worked on the document and made it more convenient, assigned tags, and that some of this data has something in common with those already in the system. This blue link leads to the dossier we have for the guy, Mike Fikri. I will add a phone number, designating it for Palantir like this. This is a way to give meaning and structure to an unstructured report.
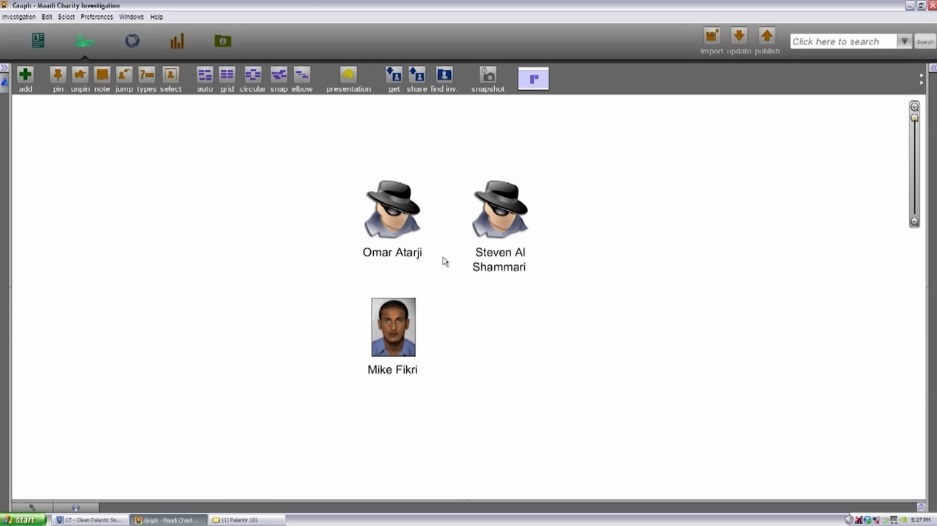
I drag these guys onto a graph (wiktionary: a graph is a collection of objects with links), the main tool for analyzing links in Palantir, to find out how they are related to each other, whether they have links to anyone else. Mike has a photo, so we definitely have information about him.

We now see information collected from various sources, such as: raw data, reports, databases, or external sources — for example, there is information about payments and telephone conversations. This is a peculiar review of man. We see different spellings of the name, address, the name is written in two languages, that is, we can work with information in many languages.
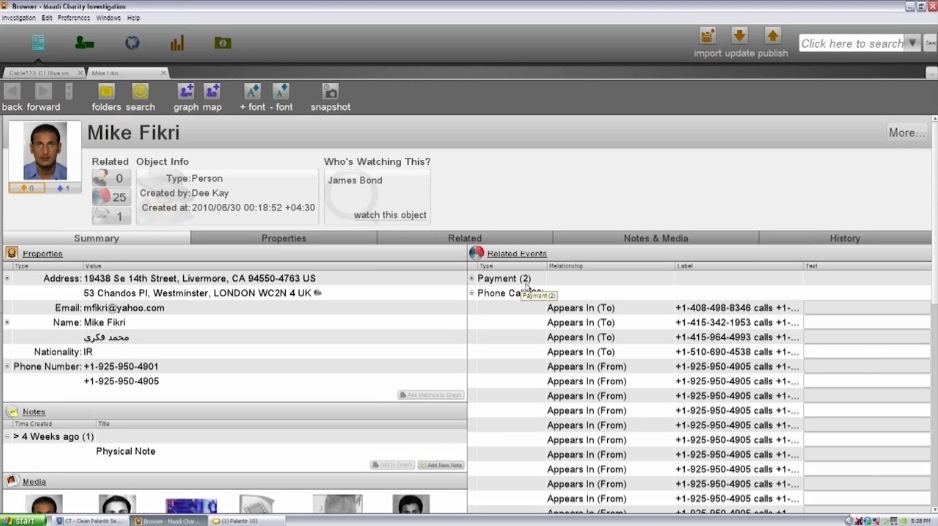
We see several phone numbers, various attachments, that is, you can attach video, audio or images here. Finally, there are connections with others. Mike is associated with twenty three calls and two payments entered into the system. Returning to the graph, it is convenient to analyze the relationship.
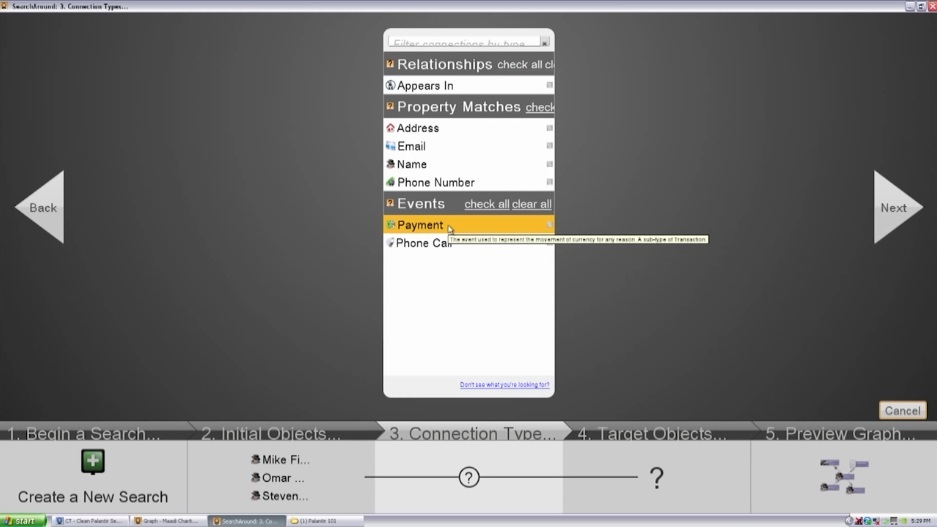
I’d rather not deal with the details at this level or read the files, but ask a more general, more direct question: “How are these three connected not only with each other, but more generally, based on the information that Palantir has now ? For this we have a wonderful tool called “Look around the bush.” I create a new search. Palantir asks what kind of coincidence or connection I want to see. I can see who these guys are connected with, and who those who are connected with them are connected with. I can see exactly where the information matches. I can ask if this address, email or name pop up somewhere. Also, we can see who is connected through these events (calls and payments), who was from the other side, and with whom they are connected. That is, Palantir allows you to ask questions fairly accurately.
I don’t need to change anything in the request, so I’ll just use what I’ve created in advance.
Here are a few questions:
- Are the guys part of a group and are there any other members in these groups?
- In what events (events such as a phone call, including) did the guys take part and who else is associated with these events?
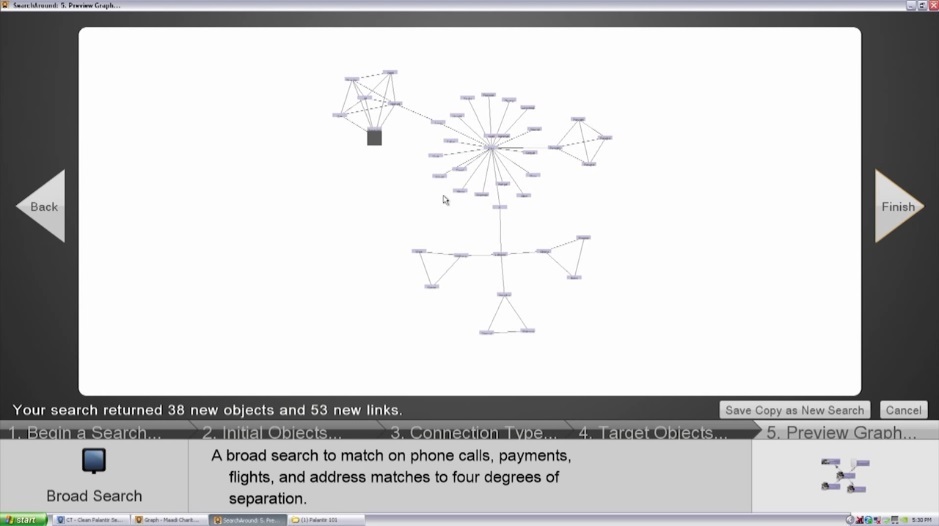
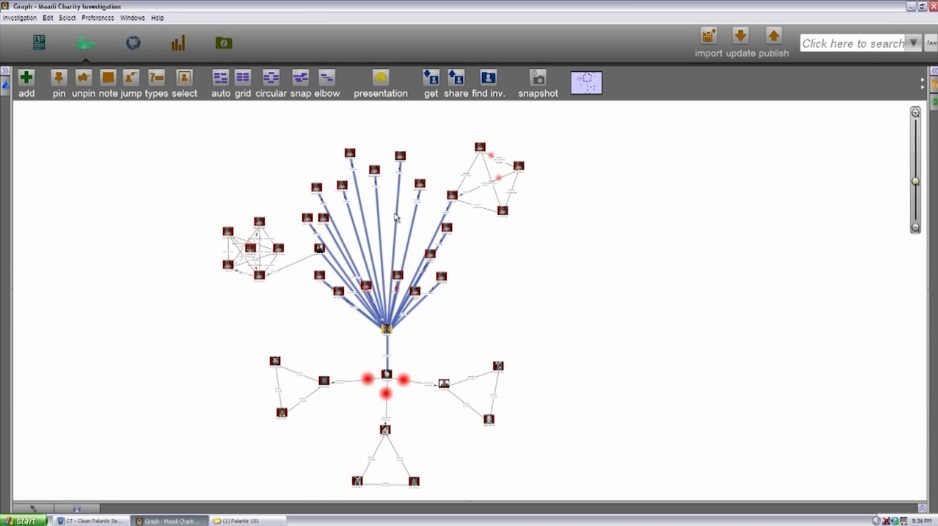
There are four degrees of separation, that is, the questions were asked more than once, but were repeated over and over again to get a more complete scheme. As you can see, the scheme turned out to be quite large, so I will complete the search and proceed to the study.

The first thing I want to do when I get such a voluminous result is to ask Palantir what I’m looking at, and for this I use the Histogram tool, which gives a brief idea of everything I’m looking at.

I look at 14 different people, and I also see something that repeats often, for example, four guys live in one place, in Brooklyn, in California, they are now highlighted. Three live together in Vancouver, three live in Toronto, it’s easy to see these groups when they are highlighted. I can also see how many of them live in San Francisco, in Berkeley, in Daily City.
Here is the popular domain for mail, hotmail.com, you can see who has mail on hotmail, who has aol (America on line). You can see matches by name, nationality, etc.
Here it is important to remember that Palantir not only allows you to own all these types of information, but also the types of information you want to own are customizable. In the context of counter-terrorism, these are the things you pay attention to: people and their nationality, particular biographies, events such as calls and payments. If we look at another area, such as cybersecurity, then instead of people may not be interesting, for example, computers and servers, and the event will be the traffic between them. In health care, these will be outbreaks of disease.
Let's take a closer look.
The first thing that catches your eye is that only one of the three guys we suspect is connected with something. The rest we remove, and I did not delete them, just hid for a while.
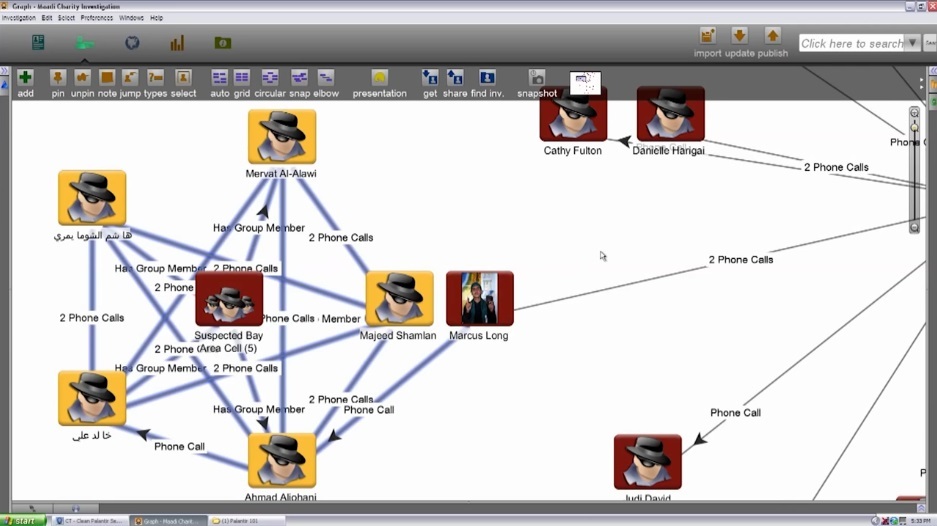
The rest, Mike Fikri, is associated with this interesting group of people. If you look closely, then some of my colleagues are observing them as a group of terror suspects from a bay area cell. Mike is connected to them through another guy, this immediately increases my interest in him. Our suspect from Cairo could be linked to an attack somewhere in the USA. We also see that he is associated with a large and interesting group of subjects right here. How exactly is connected?
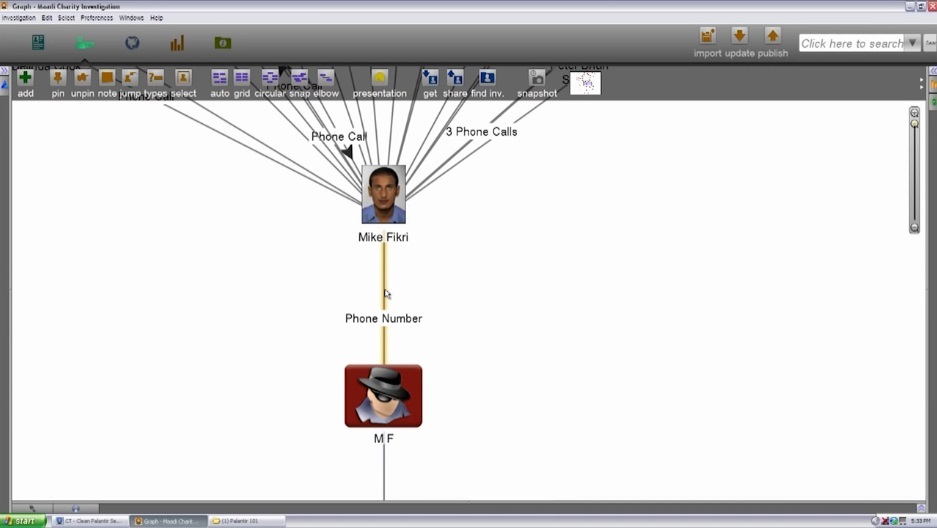
The authentic subject Mike Fikri is associated with those guys through an unknown entity called MF. This is suspicious to me, since it looks like Mike's initials, let's see.

I open connections between these guys to see what they have in common: they both live in California, both are Iranians, and for two they have one phone number. This is certainly not reliable, but I would like to test the hypothesis that Mike and MP are one person.
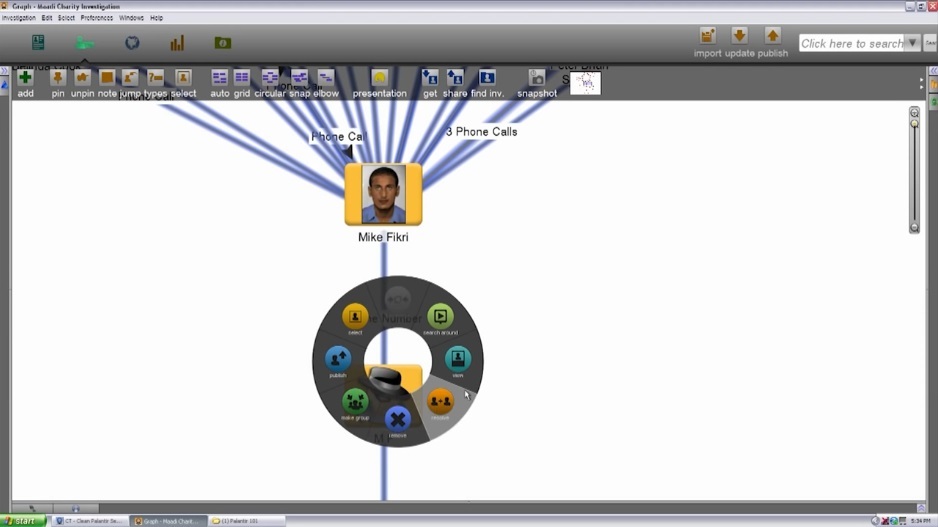
In Palantir it is quite simple, I choose the command to reduce (Resolve) these two, the program combines all the original information about them, and, moreover, information about where each piece of data came from and when it appeared in the system, this information still exists . We now have a combined view that includes all of this information, all the combined addresses and phone numbers from independent entries.
At any moment I may receive information that makes my hypothesis untenable - this is not so important, I, like any of my colleagues, can easily cancel the association and restore the original records. Information may appear that is consonant with this hypothesis. I want to share this hypothesis with colleagues, for this I select and publish (publish) this information. Until now, I worked in my personal space, now everyone who will look at Mike will see my assumption that he and MF are one person.
Now we see that Mike Fikri is directly connected with this large and interesting group of people. Here you see a lot of different kinds of activities: payments, calls, public addresses and flights, that is, these people moved together. It is quite difficult to understand what is happening here, who pays when these events took place. There are two ways to make this information more complete that I want to show you.
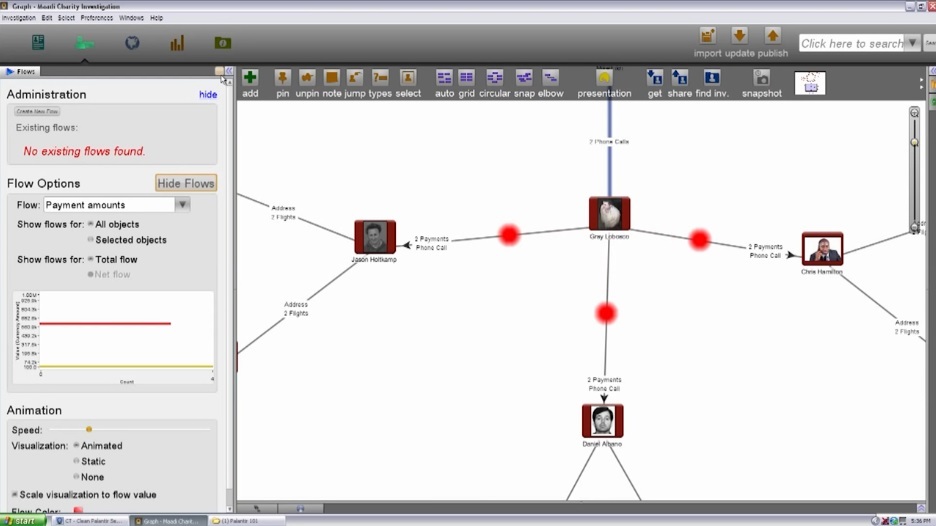
First, I want to show you the directions. When I pay, someone pays another, and I want to visualize it. In Palantir there is an excellent tool, flows (flows). Now we see where the money comes from and where it goes. The red dots have a different size to show the size of the cash flow, so you see a little activity there, and really serious movements here. Large sums move from this person to these three groups of people. It is interesting.
Two things about threads.
Firstly, the streams are completely extensible, and this is not only a tool for visualizing payments, but also any other movements. In this study, we can also look at calls. This is how the network of calls between them will look like.

Secondly, and it shows our openness, the thread tool was developed as a third-party application, although it looks and works like our own development. This demonstrates the degree of customization of the platform for different tasks.
And so, we saw cash flows. This guy has to do with the rest of the money he sends them. We will also take a look at the time: we know that payments are coming, that guys are traveling. What is the order? Does the money go at the same time or in some sequence? Before or after flights?
We have another tool, it is called a timeline (timeline) and does exactly what you thought: shows events in time. It will be easier if I highlight events in color.
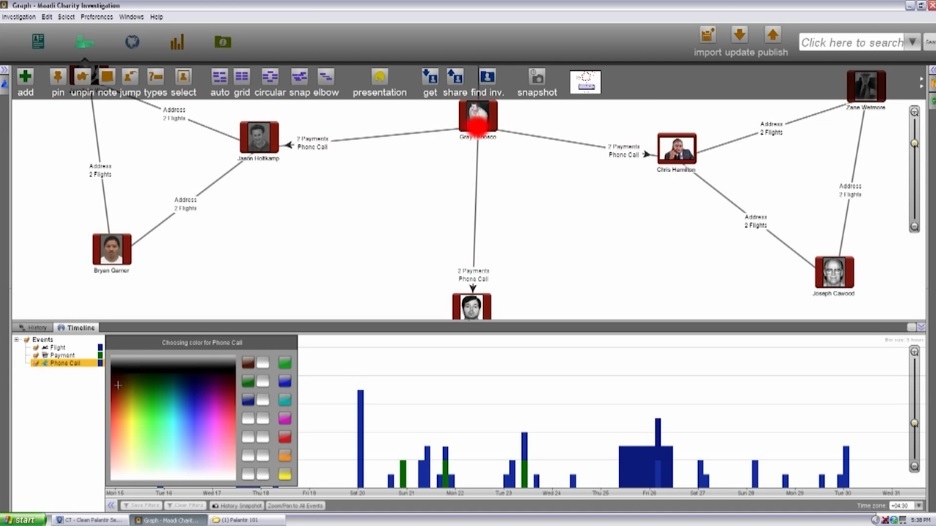
Flights will be blue, payments are green, calls are red. Now we see a slightly clearer picture of what is happening. We see that the first payment was made on October 20, 2007, and there were active calls in front of it. We see a phone call following payment in a short time. The next day, the same is repeated with the second payment. The third payment was made after another two days, again accompanied by a call. If we look a little further, we will see a lot of flights. These three groups, living in Vancouver, Toronto and Mexico City, received large sums of money from the guy associated with our suspect, got on the phone after the money, and boarded a plane the next few days. Where did they go?
Let's return to the histogram. Let's see what we can learn about airports. We see three flights: Vancouver, Mexico City, Toronto, and the fourth, all together, in Chicago. I found something interesting. Intelligence reports were received that a group of people may be associated with an attack on a city in the United States. We found that one of them was associated with the transfer of large sums of money to three different groups outside the United States, and found that all three groups traveled to the same American city. To me, it looks like how an activated cell can behave, as if an operation is being prepared.
Now I can share my results, my analysis with my colleagues, with law enforcement agencies. I will take screenshots of the most important confirmations: a temporary graph and graph, and export it in a convenient (adjustable) format, in the form of a PowerPoint presentation.
Palantir reproduces all my steps here during the research: first I looked at this guy, then I built this network, then I found out a number of details. Now I will explain what this particular timeline means. Now I have almost finished material, I am almost ready to share it after I finish a little bit.

We have now gone through a full life cycle, a kind of day in the life of the analyst Palantir. We began with the receipt of new information "from the fields", conducted a small investigation and analysis, searched a bit and shared with the others. Did you notice what was spent most of the time? Most of the time was spent talking about the analytical process itself, about the questions that I formulated, about who these guys are and what we know about them. We did not waste time searching the databases by name. You did not see me having fun (fascinating) with different types of data or with something secret (quiveries). You also did not see that I had to spend a lot of time on reworking my work into a comfortable (adjustable) format in order to make a presentation or report on my work. You have seen how I spend time on what I, as an analyst, is good at,to apply my special knowledge, to use my intuition, to follow the tracks that are interesting to me. I left the computer what it is good for: searching for information, converting information into different formats to make it convenient. All this is subject to the idea of reducing the amount of interaction I, as an analyst, with information. Give me the opportunity to quickly answer questions, quickly conduct research and quickly share the results with the others.Give me the opportunity to quickly answer questions, quickly conduct research and quickly share the results with the others.Give me the opportunity to quickly answer questions, quickly conduct research and quickly share the results with the others.
I hope this was a useful demonstration, a very superficial demonstration of what Palantir is, trust me. There is also a fantastic ability to specialize by territory (geospecial ability), which we have not even touched. Many opportunities to work with large scale data.

I am also pleased to note our growing mobile capabilities, which opens up access to all Palantir features on a smartphone. Thank you, I hope you communicate with us and our customers.
All the best to you, thank you for your time.
Source: https://habr.com/ru/post/271883/
All Articles