Development of fast mobile applications on Android. Part two
In Edison, we often encounter optimization of mobile applications and want to share material that we consider extremely useful if you solve one of two tasks: a) you want the application to slow down less; b) want to make a beautiful, soft and smooth interface for the mass user.
We bring to your attention the first part of the translation of the article Udi Cohen, which we used as a tool for teaching young colleagues to optimize for Android.
(Read the first part )
')
Here are some simple guidelines that I use when writing code.
A new addition to Android Studio 1.4 is GPU profiling rendering.
Under the Android window, go to the GPU tab, and you will see a graph showing the time it took to make each frame on the screen:
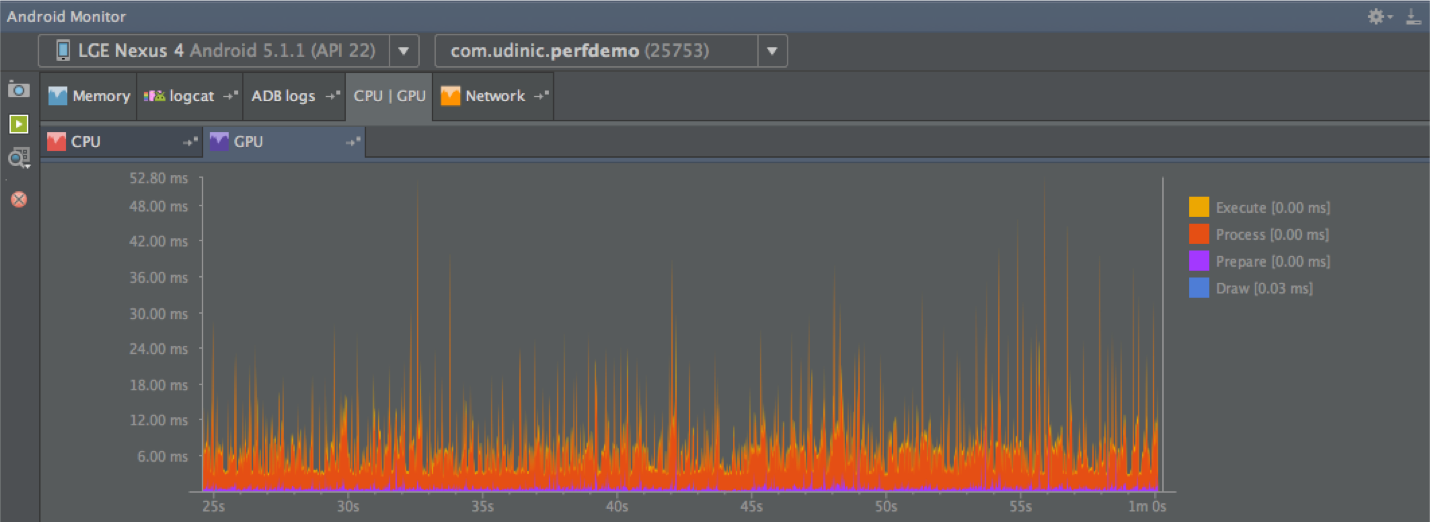
Each panel on the chart represents one frame drawn, and the color represents the various stages of the process.
More colors have been added to Marshmallow to display more steps, such as Measure / Layout, Input Handing, and others:
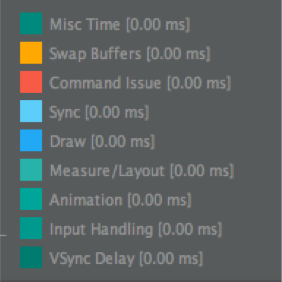
EDIT 09/29/2015: John Reck, a framework engineer from Google, added the following information about some of these colors:
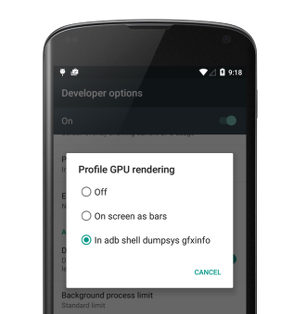
But before starting to use this feature, we need to enable the GPU rendering mode in the developer menu:
It can be (!), Using:
we can get the information and build the schedule yourself. The command will display useful information, such as the number of elements in the hierarchy, the size of all display lists, and so on. In Marshmallow we get more information.
If we have automated UI testing of our application, we can build an assembly that runs this command after certain actions (list scrolling, heavy animation, etc.) and see if there are changes in values, such as “Janky Frames”, over time . This can help determine the decline in performance after several code changes, allowing us to fix the problem before the application has entered the market. We can get even more accurate information when we use the “framestats” keyword, as shown here .
But this is not the only way to see such a schedule!
As you can see in the developer menu of the Profile GPU Rendering, there is also the option “On screen as bars”. His choice will show a graph for each window on your screen along with a green line indicating a 16 ms threshold.

In the example to the right, we can see that some frames cross the green line, which means that they require more than 16ms to draw. Since the blue color seems to dominate, we understand that there were many representations to draw, or they were complex. In this case, I scroll the tape, which supports different types of presentation. Some items become invalid, and some become more complex than others. Perhaps the reason why some frames crossed this line is because an element is difficult to display.
I love this tool, and I am very sorry that many do not use it!
Using the Hierarchy Viewer, we can get performance statistics, see the complete view hierarchy on the screen, and access all the properties of an item. You can also dump all topic data, see all parameters used for each style attribute, but this is possible only if the Hierarchy Viewer is running standalone, not from Android Monitor. I use this tool when I create application layouts and I want to optimize them.

In the center we can see a tree reflecting the hierarchy of the view. The presentation hierarchy may be broad, but if it is too deep (~ 10 levels), it can cost us a lot. Each time a view dimension occurs in View # onMeasure (), or when its descendants are placed in View # onLayout (), these commands apply to the descendants of these views, doing the same. Some layouts will do each step twice, for example, RelativeLayout and some LinearLayout configurations, and if they are nested, the number of passes increases exponentially.
In the lower right corner we can see the “plan” of our layout, noting where each presentation is located. We can choose a view here, or in a tree and see all the properties on the left. When designing a layout, I'm sometimes not sure why a particular view ends where it ends. Using this tool, I can track the tree, select it and see where it is in the preview window. I can make interesting animations by looking at the final dimensions of the views on the screen, and use this information to precisely place elements around. I can find lost views that were overlaid by other ideas unintentionally.

For each view, we have the time it took to measure / create a layout / render it and all its descendants. The colors reflect how these representations are performed in comparison with other representations in the tree; this is a great way to find the weak link. Since we also see a preview of the view, we can go through the tree and follow the instructions that create them, finding extra steps that we could remove. One of the things that affects performance is called Overdraw.
As can be seen in the GPU profiling section, the Execute phase represented in yellow on the graph may take longer to complete if the GPU has to draw a lot of elements, increasing the time required to draw each frame. Overdraw occurs when we draw something on top of something else, such as a yellow button on a red background. The GPU needs to draw, first, a red background and then a yellow button on top of it, which makes inevitable overdraw. If we have too many overdraw layers, this may be the reason why the GPU works more intensively and does not have time to 16 ms.
Using the “Debug GPU Overdraw” setting in the developer menu, all overdraw will be tinted to demonstrate the degree of overdraw in a given area. If overdraw has a 1x / 2x degree, this is normal, even small red areas are not bad either, but if we have too many red elements on the screen, we probably have a problem. Let's look at a few examples:
In the example on the left there is a list colored green, which is usually normal, but there is an overdraw at the top, which makes the screen red, and this is becoming a problem. In the example to the right, the entire list is light red. In both examples there is an opaque list with a 2x / 3x overdraw layer. These can happen if there is a background color on the whole screen in a window that overlaps your activit or fragment, as well as on the list view and the presentation of each of its elements.
Note: the default theme sets the background color for your entire window. If you have an activation with an opaque layout that covers the entire screen, you can remove the background for this window to remove one overdraw layer. This can be done in a thread or in code by calling getWindow (). SetBackgroundDrawable (null) in onCreate ().
Using the Hierarchy Viewer, you can export all your hierarchy layers to a PSD file to open it in Photoshop. As a result of researching different layers, all overdraw in the layout will be revealed. Use this information to remove redundant overdraws, and do not settle for green, aim for the blue!
Using transparency can affect performance, and in order to understand why, let's see what happens when setting the alpha parameter in a view. Consider the following structure:

We see a layout that contains 3 ImageViews that overlap each other. In a direct implementation, setting alpha with setAlpha () will cause the command to be propagated to all representations of the children, ImageView in this case. These ImageViews will then be drawn with the alpha parameter in the frame buffer. Result:

This is not what we want to see.
Since each ImageView was rendered with an alpha value, all overlapping images will merge. Fortunately, the OS has a solution to this problem. The layout will be copied to a separate off-screen buffer, alpha will be used in this buffer as a whole and the result will be copied to the frame buffer. Result:

But ... we will pay our price for it.
Additional drawing of the presentation in the off-screen buffer before it is done in the frame buffer adds another invisible overdraw layer. The OS does not know exactly when to use this or a direct approach before, so by default it always uses one integrated one. But there are still ways to set alpha and avoid difficulties with the addition of off-screen buffer:
When hardware acceleration was enabled in Honeycomb, we got a new rendering model to display our application on the screen. This includes a DisplayList structure that records view rendering commands for faster image acquisition. But there is another interesting feature that developers usually forget about - presentation levels.
Using them, we can draw the presentation in the off-screen buffer (as we saw earlier when using the alpha channel) and manipulate it as we wish. This is great for animation because we can animate complex views faster. Without levels, the animation of the representations would become inaccessible after changing the properties of the animation (such as x-coordinate, scale, alpha value, etc.). For complex representations, this inability extends to descendants, and they in turn will redraw themselves, which is an expensive operation. Using the presentation levels, relying on hardware, the texture for our presentation is created in the graphics processor. There are several operations that we can apply to the texture without having to replace it, such as changing the position along the x / y axes, rotation, alpha, and others. All this means that we can animate complex presentations on our screen without replacing them in the process of animation! This makes the animation more smooth. Here is a sample code showing how this can be done:
Just right?
Yes, but there are a few points to keep in mind when using the hardware level.
For the second case, there is a way to visualize this update. Using developer settings, we can activate “Show hardware layers updates”.
After that, the view will be highlighted in green when upgrading at the hardware level. I used it some time ago when I had a ViewPager that did not flip through the pages with the smoothing that I was expecting. After I turned on this option, I went back and flipped through the ViewPager, and this is what I saw:

Both pages were green throughout the entire scroll!
This means that the hardware level was used to optimize the pages, and the pages became unusable when we looked through the ViewPager. I updated the pages and flipped through them using the parallax effect in the background and gradually revived the elements on the page. What I didn't do was not create a hardware layer for the ViewPager pages. After examining the ViewPager code, I discovered that when the user starts scrolling, both pages are created at the hardware level and deleted after the scrolling ends.
While it makes sense to use hardware levels for scrolling through pages, in my case this did not work. Usually the pages do not change when we flip through the ViewPager, and since they can be quite complex, the hardware level helps to render the drawing much faster. In the application I was working on, this was not the case, and I removed this hardware layer using a small hack, which I wrote myself.
The hardware layer is not a silver bullet. It is important to understand how it works, and to use it properly, otherwise you may face a big problem.
In preparing for all these examples shown here, I wrote a lot of code to simulate these situations. You can find them on the Github repository , as well as on Google Play . I shared the scenarios for various activations, and tried to document them as much as possible, to help understand what kind of problems you might encounter using activations. Read the activation documentation, open the tools and play with the app.
As the Android OS evolves, the ways in which you can optimize your applications are evolving. New tools are introduced in the Android SDK, and new functions are added to the OS (for example, hardware levels). It is very important to learn new things and study compromises before you decide to change something.
There is a great YouTube playlist called Android Performance Patterns , with a lot of short videos from Google explaining various performance related things. You can find comparisons between different data structures (HashMap vs ArrayMap), Bitmap optimization, and even optimization of network requests. I highly recommend watching all of them.
Join the Android Performance Patterns Google+ community and discuss performance with other contributors, including Google employees, to share ideas, articles, and questions.
I hope you now have enough information and more confidence to start optimizing your applications today!
Start tracing, or turn on some of the other available developer options, and just start with them. I propose to share your thoughts in the comments.
We bring to your attention the first part of the translation of the article Udi Cohen, which we used as a tool for teaching young colleagues to optimize for Android.
(Read the first part )
')
General tips for working with memory
Here are some simple guidelines that I use when writing code.
- Enumerations are already the subject of heated debate about performance. Here is a video that discusses the amount of memory that the enumeration spends, and a discussion of this video and some potentially misleading information. Do enums use more memory than regular constants? Definitely. Is it bad? Not necessary. If you are writing a library and need strong type safety, it could justify their use compared to other solutions, such as @IntDef . If you just have a bunch of constants that can be grouped together, using enums will not be a very wise decision. As usual, there is a trade-off that needs to be considered when making a decision.
- A wrapper is an automatic conversion of primitive types to their object representation (for example, int -> Integer). Each primitive type "turns around" into an object representation, a new object is created (shocking, I know). If we have many such objects, the call to the garbage collector will be executed more often. It is easy to miss the number of wraps, because this is done automatically for us when assigned to a primitive type of object. As a solution, try to use the appropriate types. If you use primitive types in your application, try to avoid wrapping them without real need. You can use the memory profiling tools to find objects that represent primitive types. You can also use Traceview and search for Integer.valueOf (), Long.valueOf (), etc.
- HashMap vs ArrayMap / Sparse * Array - as well as in the case of wrappers, using HashMap requires using objects as keys. If we use the primitive type int in our application, it is automatically wrapped in an Integer when interacting with a HashMap, in this case we could use SparseIntArray. In the case where we still use objects as keys, we can use ArrayMap. Both options require less memory than HashMap, but they work differently , which makes them more efficient in memory consumption at the cost of decreasing speed. Both alternatives have a smaller memory footprint than HashMap, but the time required to retrieve an item or allocate memory is slightly longer than that of a HashMap. If you do not have more than 1000 items, the differences in runtime are not significant, which makes these two options viable.
- Awareness of context - as you saw earlier, it is relatively easy to create memory leaks. You may not be surprised to learn that activations are the most common cause of Android memory leaks (!). Their leaks are also very expensive, as they contain all representations of the hierarchy of their UI, which themselves can take up a lot of space. Make sure you understand what is happening in the activation. If a link to an object in the cache and this object lives longer than your activation, without clearing this link you will get a memory leak.
- Avoid using non-static inner classes . When creating a non-static inner class and its instance, you create an implicit reference to your outer class. If an instance of the inner class is needed for a longer period of time than the outer class, the outer class will continue to be in memory, even if it is no longer needed. For example, a non-static class is created that inherits AsyncTask inside the Activity class, then a transition to a new asynchronous task takes place and, while it lasts, the activation is completed. As long as this asynchronous task lasts, it will keep the activity alive. The solution is simple - do not do this, declare an internal static class, if necessary.
GPU profiling
A new addition to Android Studio 1.4 is GPU profiling rendering.
Under the Android window, go to the GPU tab, and you will see a graph showing the time it took to make each frame on the screen:
Each panel on the chart represents one frame drawn, and the color represents the various stages of the process.
- Draw (blue) represents the View # onDraw () method. This part builds / updates DisplayList objects, which will then be converted to OpenGL commands that are understandable to the GPU. High performance may be due to the complex used representations, which require more time to build their display list, or many representations become invalid in a short period of time.
- Prepare (purple) - another thread was added to Lollipop to help draw the UI faster. It is called RenderThread. He is responsible for converting the display lists to OpenGL commands and sending them to the graphics processor. Once this happens, the UI thread can proceed to processing the next frame. The time spent by the UI thread to transfer all the necessary RenderThread resources is reflected at this stage. If we have long / heavy mapping lists, this step may take longer.
- Process (red) - execute display lists to create OpenGL commands. This step may take longer if the lists are long or complex, because many elements need to be redrawn. The view may be redrawn, since it has become invalid or has been opened after the movement of the concealing view.
- Execute (yellow) - send OpenGL commands to the GPU. This stage can take a long time, as the CPU sends a buffer with commands to the GPU, expecting to get back a clean buffer for the next frame. The number of buffers is limited, and if the GPU is too busy, the processor will wait until the first one is available. Therefore, if we see high values at this step, this may mean that the GPU was busy with drawing our interface, which may be too complicated to be drawn in a shorter time.
More colors have been added to Marshmallow to display more steps, such as Measure / Layout, Input Handing, and others:
EDIT 09/29/2015: John Reck, a framework engineer from Google, added the following information about some of these colors:
“The exact definition of the word“ animation ”is all that is registered with Choreographer as CALLBACK_ANIMATION. This includes the Choreographer # postFrameCallback and View # postOnAnimation, which are used by view.animate (), ObjectAnimator, Transitions, and others ... And yes, this is the same thing that is labeled “animation” in systrace.
“Misc” is the delay between the vsync timestamp and the current timestamp when it was received. If you have already seen the logs from Choreographer "Missed vsync by blabla ms skipping blabla frames", now it will be represented as "misc". There is a difference between INTENDED_VSYNC and VSYNC in framestats dump (https://developer.android.com/preview/testing/performance.html#timing-info). ”
But before starting to use this feature, we need to enable the GPU rendering mode in the developer menu:
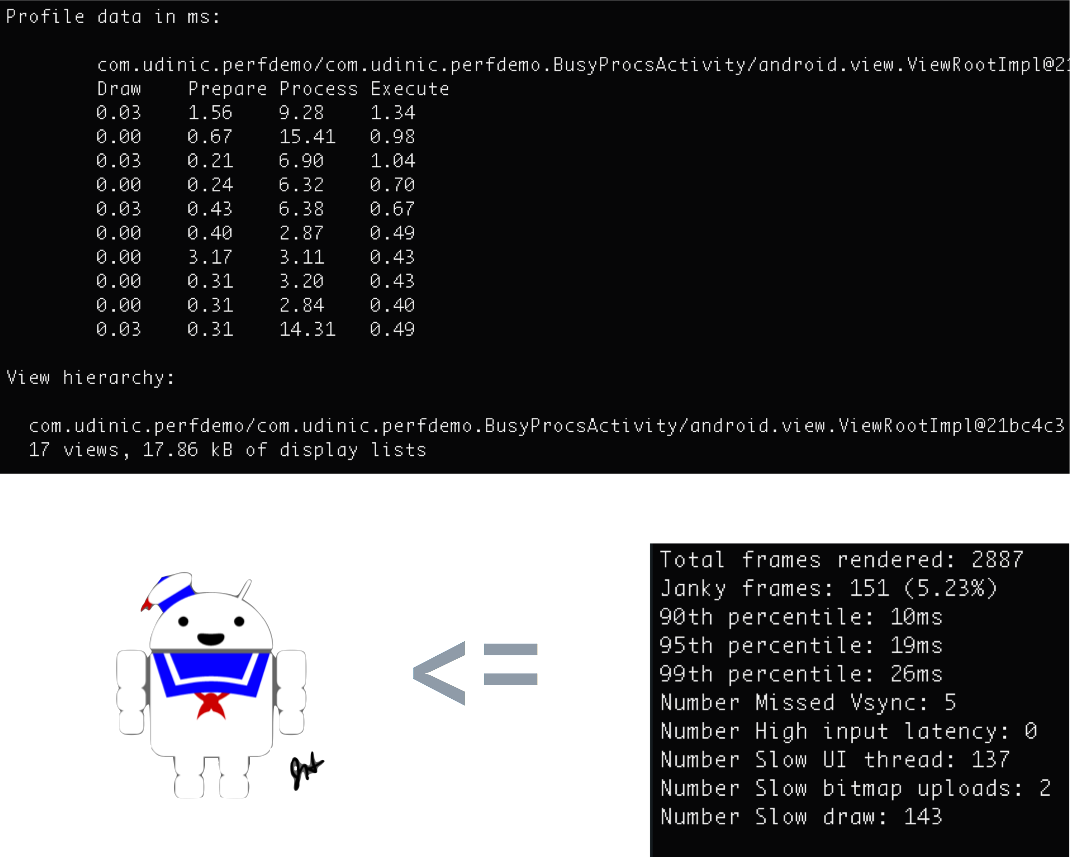
It can be (!), Using:
adb shell dumpsys gfxinfo <PACKAGE_NAME> we can get the information and build the schedule yourself. The command will display useful information, such as the number of elements in the hierarchy, the size of all display lists, and so on. In Marshmallow we get more information.
If we have automated UI testing of our application, we can build an assembly that runs this command after certain actions (list scrolling, heavy animation, etc.) and see if there are changes in values, such as “Janky Frames”, over time . This can help determine the decline in performance after several code changes, allowing us to fix the problem before the application has entered the market. We can get even more accurate information when we use the “framestats” keyword, as shown here .
But this is not the only way to see such a schedule!
As you can see in the developer menu of the Profile GPU Rendering, there is also the option “On screen as bars”. His choice will show a graph for each window on your screen along with a green line indicating a 16 ms threshold.
In the example to the right, we can see that some frames cross the green line, which means that they require more than 16ms to draw. Since the blue color seems to dominate, we understand that there were many representations to draw, or they were complex. In this case, I scroll the tape, which supports different types of presentation. Some items become invalid, and some become more complex than others. Perhaps the reason why some frames crossed this line is because an element is difficult to display.
Hierarchy viewer
I love this tool, and I am very sorry that many do not use it!
Using the Hierarchy Viewer, we can get performance statistics, see the complete view hierarchy on the screen, and access all the properties of an item. You can also dump all topic data, see all parameters used for each style attribute, but this is possible only if the Hierarchy Viewer is running standalone, not from Android Monitor. I use this tool when I create application layouts and I want to optimize them.
In the center we can see a tree reflecting the hierarchy of the view. The presentation hierarchy may be broad, but if it is too deep (~ 10 levels), it can cost us a lot. Each time a view dimension occurs in View # onMeasure (), or when its descendants are placed in View # onLayout (), these commands apply to the descendants of these views, doing the same. Some layouts will do each step twice, for example, RelativeLayout and some LinearLayout configurations, and if they are nested, the number of passes increases exponentially.
In the lower right corner we can see the “plan” of our layout, noting where each presentation is located. We can choose a view here, or in a tree and see all the properties on the left. When designing a layout, I'm sometimes not sure why a particular view ends where it ends. Using this tool, I can track the tree, select it and see where it is in the preview window. I can make interesting animations by looking at the final dimensions of the views on the screen, and use this information to precisely place elements around. I can find lost views that were overlaid by other ideas unintentionally.
For each view, we have the time it took to measure / create a layout / render it and all its descendants. The colors reflect how these representations are performed in comparison with other representations in the tree; this is a great way to find the weak link. Since we also see a preview of the view, we can go through the tree and follow the instructions that create them, finding extra steps that we could remove. One of the things that affects performance is called Overdraw.
Overdraw
As can be seen in the GPU profiling section, the Execute phase represented in yellow on the graph may take longer to complete if the GPU has to draw a lot of elements, increasing the time required to draw each frame. Overdraw occurs when we draw something on top of something else, such as a yellow button on a red background. The GPU needs to draw, first, a red background and then a yellow button on top of it, which makes inevitable overdraw. If we have too many overdraw layers, this may be the reason why the GPU works more intensively and does not have time to 16 ms.
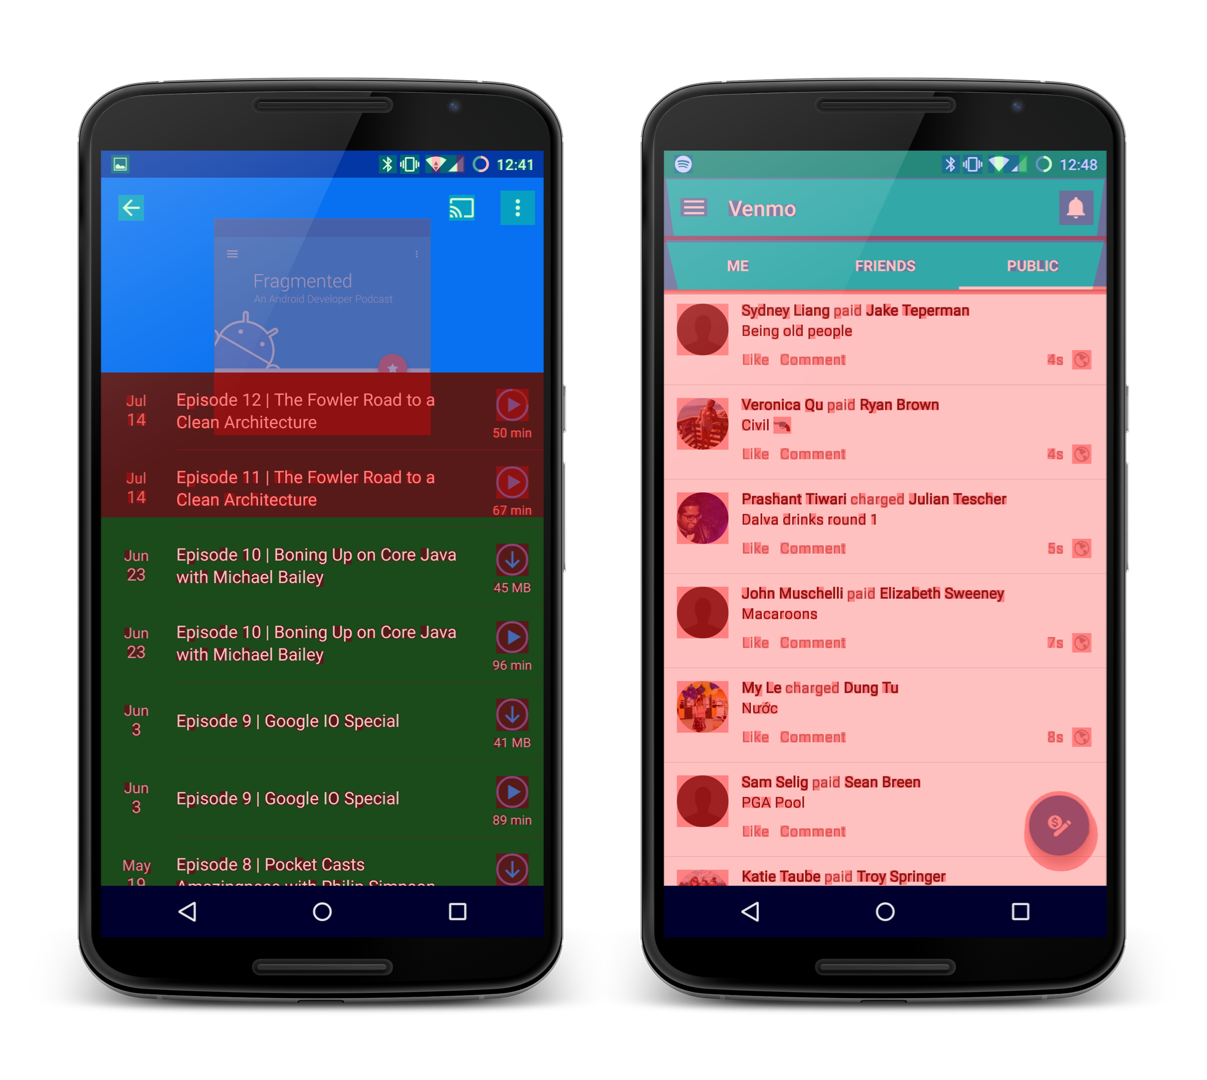
Using the “Debug GPU Overdraw” setting in the developer menu, all overdraw will be tinted to demonstrate the degree of overdraw in a given area. If overdraw has a 1x / 2x degree, this is normal, even small red areas are not bad either, but if we have too many red elements on the screen, we probably have a problem. Let's look at a few examples:
In the example on the left there is a list colored green, which is usually normal, but there is an overdraw at the top, which makes the screen red, and this is becoming a problem. In the example to the right, the entire list is light red. In both examples there is an opaque list with a 2x / 3x overdraw layer. These can happen if there is a background color on the whole screen in a window that overlaps your activit or fragment, as well as on the list view and the presentation of each of its elements.
Note: the default theme sets the background color for your entire window. If you have an activation with an opaque layout that covers the entire screen, you can remove the background for this window to remove one overdraw layer. This can be done in a thread or in code by calling getWindow (). SetBackgroundDrawable (null) in onCreate ().
Using the Hierarchy Viewer, you can export all your hierarchy layers to a PSD file to open it in Photoshop. As a result of researching different layers, all overdraw in the layout will be revealed. Use this information to remove redundant overdraws, and do not settle for green, aim for the blue!
Alpha
Using transparency can affect performance, and in order to understand why, let's see what happens when setting the alpha parameter in a view. Consider the following structure:
We see a layout that contains 3 ImageViews that overlap each other. In a direct implementation, setting alpha with setAlpha () will cause the command to be propagated to all representations of the children, ImageView in this case. These ImageViews will then be drawn with the alpha parameter in the frame buffer. Result:
This is not what we want to see.
Since each ImageView was rendered with an alpha value, all overlapping images will merge. Fortunately, the OS has a solution to this problem. The layout will be copied to a separate off-screen buffer, alpha will be used in this buffer as a whole and the result will be copied to the frame buffer. Result:
But ... we will pay our price for it.
Additional drawing of the presentation in the off-screen buffer before it is done in the frame buffer adds another invisible overdraw layer. The OS does not know exactly when to use this or a direct approach before, so by default it always uses one integrated one. But there are still ways to set alpha and avoid difficulties with the addition of off-screen buffer:
- TextViews - use setTextColor () instead of setAlpha (). Using the alpha channel for text will cause the text to be redrawn.
- ImageView - use setImageAlpha () instead of setAlpha (). Same reasons as TextView.
- Custom views - if our custom view does not support overlapping, this comprehensive solution does not matter to us. There is no way that our descendant views will be connected together, as shown in the example above. By redefining the hasOverlappingRendering () method so that it returns false, we signal the OS to take the direct path to our view. There is also an option to manually handle what happens when setting an alpha by overriding the onSetAlpha () method so that it returns true.
Hardware acceleration
When hardware acceleration was enabled in Honeycomb, we got a new rendering model to display our application on the screen. This includes a DisplayList structure that records view rendering commands for faster image acquisition. But there is another interesting feature that developers usually forget about - presentation levels.
Using them, we can draw the presentation in the off-screen buffer (as we saw earlier when using the alpha channel) and manipulate it as we wish. This is great for animation because we can animate complex views faster. Without levels, the animation of the representations would become inaccessible after changing the properties of the animation (such as x-coordinate, scale, alpha value, etc.). For complex representations, this inability extends to descendants, and they in turn will redraw themselves, which is an expensive operation. Using the presentation levels, relying on hardware, the texture for our presentation is created in the graphics processor. There are several operations that we can apply to the texture without having to replace it, such as changing the position along the x / y axes, rotation, alpha, and others. All this means that we can animate complex presentations on our screen without replacing them in the process of animation! This makes the animation more smooth. Here is a sample code showing how this can be done:
// Using the Object animator view.setLayerType(View.LAYER_TYPE_HARDWARE, null); ObjectAnimator objectAnimator = ObjectAnimator.ofFloat(view, View.TRANSLATION_X, 20f); objectAnimator.addListener(new AnimatorListenerAdapter() { @Override public void onAnimationEnd(Animator animation) { view.setLayerType(View.LAYER_TYPE_NONE, null); } }); objectAnimator.start(); // Using the Property animator view.animate().translationX(20f).withLayer().start(); Just right?
Yes, but there are a few points to keep in mind when using the hardware level.
- Do the cleanup after running your view — the hardware level uses space on the limited memory space on your GPU. Try to use it only in cases when it is needed, for example, in animation, and do the cleaning after. In the example above with ObjectAnimator, I used the withLayers () method, which automatically creates a layer at the beginning and deletes it when the animation ends.
- If you change your presentation after using the hardware level, it will lead to its unsuitability and you will have to re-play the presentation on the off-screen buffer. This will happen when the property is not optimized for the hardware level (currently optimized: rotation, scaling, movement along the x / y axes, alpha). For example, if you are animating a presentation using a hardware level and moving the presentation across the screen while the background color is being updated, this will result in constant updates on the hardware level. This requires additional costs that may make its use unjustified.
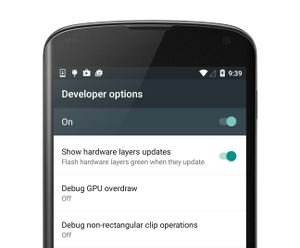
For the second case, there is a way to visualize this update. Using developer settings, we can activate “Show hardware layers updates”.
After that, the view will be highlighted in green when upgrading at the hardware level. I used it some time ago when I had a ViewPager that did not flip through the pages with the smoothing that I was expecting. After I turned on this option, I went back and flipped through the ViewPager, and this is what I saw:
Both pages were green throughout the entire scroll!
This means that the hardware level was used to optimize the pages, and the pages became unusable when we looked through the ViewPager. I updated the pages and flipped through them using the parallax effect in the background and gradually revived the elements on the page. What I didn't do was not create a hardware layer for the ViewPager pages. After examining the ViewPager code, I discovered that when the user starts scrolling, both pages are created at the hardware level and deleted after the scrolling ends.
While it makes sense to use hardware levels for scrolling through pages, in my case this did not work. Usually the pages do not change when we flip through the ViewPager, and since they can be quite complex, the hardware level helps to render the drawing much faster. In the application I was working on, this was not the case, and I removed this hardware layer using a small hack, which I wrote myself.
The hardware layer is not a silver bullet. It is important to understand how it works, and to use it properly, otherwise you may face a big problem.
Do it yourself
In preparing for all these examples shown here, I wrote a lot of code to simulate these situations. You can find them on the Github repository , as well as on Google Play . I shared the scenarios for various activations, and tried to document them as much as possible, to help understand what kind of problems you might encounter using activations. Read the activation documentation, open the tools and play with the app.
More information
As the Android OS evolves, the ways in which you can optimize your applications are evolving. New tools are introduced in the Android SDK, and new functions are added to the OS (for example, hardware levels). It is very important to learn new things and study compromises before you decide to change something.
There is a great YouTube playlist called Android Performance Patterns , with a lot of short videos from Google explaining various performance related things. You can find comparisons between different data structures (HashMap vs ArrayMap), Bitmap optimization, and even optimization of network requests. I highly recommend watching all of them.
Join the Android Performance Patterns Google+ community and discuss performance with other contributors, including Google employees, to share ideas, articles, and questions.
Other interesting links
- Learn how Graphics Architecture in Android works. It has everything you need to know about drawing your UI on Android, explains the various system components, such as SurfaceFlinger, and how they all interact with each other.
- Talk from Google IO 2012 shows how the drawing model works and how / why we get garbage when our UI is drawn.
- Android Performance Workshop talk from Devoxx 2013 demonstrates some of the optimizations that were made in Android 4.4 in the drawing model and presents various tools for optimizing performance (Systrace, Overdraw, etc.).
- A wonderful post about Preventive Optimization , and how it differs from Premature Optimization. Many developers do not optimize their code, because they think that this change is insignificant. One thought you need to remember is that all this adds up to a big problem . If you have the opportunity to optimize only a small part of the code, this may seem insignificant, I do not exclude.
- Android memory management is an old video from Google IO 2011, which is still relevant. It demonstrates how Android manages the memory of our applications, and how to use tools like Eclipse MAT to identify problems.
- A case study done by Google Romain Guy, an engineer, to optimize a popular twitter client. In this study, Romain shows how he found performance problems in the application and what he recommends doing to fix them. Here is the next post showing other problems after it has been recycled.
I hope you now have enough information and more confidence to start optimizing your applications today!
Start tracing, or turn on some of the other available developer options, and just start with them. I propose to share your thoughts in the comments.
Source: https://habr.com/ru/post/271811/
All Articles