COUNT (*)

I have a selection of simple questions that I like to ask during the interview. For example, how to calculate the total number of records to a table? It seems to be nothing complicated, but if you dig deeper, you can tell a lot of interesting nuances to the other person.
Let's start with a simple one ... Do these requests differ from one another in terms of the final result?
')
SELECT COUNT(*) FROM Sales.SalesOrderDetail SELECT COUNT_BIG(*) FROM Sales.SalesOrderDetail Most answered: "No."
Less often, they tried to formulate the answer more thoroughly: “Requests will return an identical result, but COUNT will return a value of type INT , and COUNT_BIG will return a type of BIGINT ”.
If you analyze the execution plan, you will notice the differences that many overlook. When using COUNT, Compute Scalar operation will be on the plan:

If you look at the properties of the operator, we will see there:
[Expr1003] = Scalar Operator(CONVERT_IMPLICIT(int,[Expr1004],0)) This is because when calling COUNT , COUNT_BIG is implicitly used and the result is converted to INT .
I would not say that significantly, but type conversion increases the load on the processor. Many, of course, can say that this statement is worthless when executed, but it is necessary to note a simple fact - SQL Server very often underestimates Compute Scalar statements.
I also know people who like to use SUM instead of COUNT :
SELECT SUM(1) FROM Sales.SalesOrderDetail This option is roughly equivalent to COUNT . We will also get an extra Compute Scalar on the execution plan:
[Expr1003] = Scalar Operator(CASE WHEN [Expr1004]=(0) THEN NULL ELSE [Expr1005] END) Now let's take a closer look at performance issues. ...
If you use the queries above, in order to count the number of SQL Server entries, you must run Full Index Scan (or Full Table Scan if the table is a heap). In any case, these operations are far from the fastest. It is best to use system views to get the number of records: sys.dm_db_partition_stats or sys.partitions (there are still sysindexes , but left for backward compatibility with SQL Server 2000 ).
USE AdventureWorks2012 GO SET STATISTICS IO ON SET STATISTICS TIME ON GO SELECT COUNT_BIG(*) FROM Sales.SalesOrderDetail SELECT SUM(p.[rows]) FROM sys.partitions p WHERE p.[object_id] = OBJECT_ID('Sales.SalesOrderDetail') AND p.index_id < 2 SELECT SUM(s.row_count) FROM sys.dm_db_partition_stats s WHERE s.[object_id] = OBJECT_ID('Sales.SalesOrderDetail') AND s.index_id < 2 If you compare the execution plans, then access to system views is less expensive:

At AdventureWorks, the advantage of using system views is not evident:
Table 'SalesOrderDetail'. Scan count 1, logical reads 276, ... SQL Server Execution Times: CPU time = 12 ms, elapsed time = 26 ms. Table 'sysrowsets'. Scan count 1, logical reads 5, ... SQL Server Execution Times: CPU time = 4 ms, elapsed time = 4 ms. Table 'sysidxstats'. Scan count 1, logical reads 2, ... SQL Server Execution Times: CPU time = 2 ms, elapsed time = 1 ms. Runtime on a partitioned table with 30 million entries:
Table 'big_test'. Scan count 6, logical reads 114911, ... SQL Server Execution Times: CPU time = 4859 ms, elapsed time = 5079 ms. Table 'sysrowsets'. Scan count 1, logical reads 25, ... SQL Server Execution Times: CPU time = 0 ms, elapsed time = 2 ms. Table 'sysidxstats'. Scan count 1, logical reads 2, ... SQL Server Execution Times: CPU time = 0 ms, elapsed time = 2 ms. If you need to check the presence of records in the table, the use of metadata as shown above will not give special advantages ...
IF EXISTS(SELECT * FROM Sales.SalesOrderDetail) PRINT 1 IF EXISTS( SELECT * FROM sys.dm_db_partition_stats WHERE [object_id] = OBJECT_ID('Sales.SalesOrderDetail') AND row_count > 0 ) PRINT 1 Table 'SalesOrderDetail'. Scan count 1, logical reads 2,... SQL Server Execution Times: CPU time = 1 ms, elapsed time = 3 ms. Table 'sysidxstats'. Scan count 1, logical reads 2,... SQL Server Execution Times: CPU time = 4 ms, elapsed time = 5 ms. And in practice, it will even be a bit slower, since SQL Server generates a more complex execution plan for sampling from metadata.

It becomes even more interesting when you need to count the number of records for all tables at once. In practice, I met several options that can be summarized.
Variant # 1 with the use of an undocumented procedure that bypasses all user tables with a cursor:
IF OBJECT_ID('tempdb.dbo.#temp') IS NOT NULL DROP TABLE #temp GO CREATE TABLE #temp (obj SYSNAME, row_count BIGINT) GO EXEC sys.sp_MSForEachTable @command1 = 'INSERT #temp SELECT ''?'', COUNT_BIG(*) FROM ?' SELECT * FROM #temp ORDER BY row_count DESC Option # 2 is dynamic SQL that generates SELECT COUNT (*) queries:
DECLARE @SQL NVARCHAR(MAX) SELECT @SQL = STUFF(( SELECT 'UNION ALL SELECT ''' + SCHEMA_NAME(o.[schema_id]) + '.' + o.name + ''', COUNT_BIG(*) FROM [' + SCHEMA_NAME(o.[schema_id]) + '].[' + o.name + ']' FROM sys.objects o WHERE o.[type] = 'U' AND o.is_ms_shipped = 0 FOR XML PATH(''), TYPE).value('.', 'NVARCHAR(MAX)'), 1, 10, '') + ' ORDER BY 2 DESC' PRINT @SQL EXEC sys.sp_executesql @SQL Option # 3 is a quick option for every day:
SELECT SCHEMA_NAME(o.[schema_id]), o.name, t.row_count FROM sys.objects o JOIN ( SELECT p.[object_id], row_count = SUM(p.row_count) FROM sys.dm_db_partition_stats p WHERE p.index_id < 2 GROUP BY p.[object_id] ) t ON t.[object_id] = o.[object_id] WHERE o.[type] = 'U' AND o.is_ms_shipped = 0 ORDER BY t.row_count DESC I gave a lot of praises that system views are so good. However, when working with them, “pleasant” surprises may lie in wait for us.
It is remembered that there was such a fun bug when, when migrating from SQL Server 2000 to 2005, some system views were incorrectly updated. Particularly lucky people, in this case, incorrect values about the number of records in the tables were returned from the metadata. It was treated with all this command DBCC UPDATEUSAGE .
Together with SQL Server 2005 SP1, this bug was fixed and everything would be fine ... But I observed a similar situation one more time when I restored backup from SQL Server 2005 SP4 to SQL Server 2012 SP2 . Alas, I can’t reproduce the problem on a real environment, so I’m a little deceiving the optimizer:
UPDATE STATISTICS Person.Person WITH ROWCOUNT = 1000000000000000000 I will tell on a simple example.
The most innocuous query started running longer than usual:
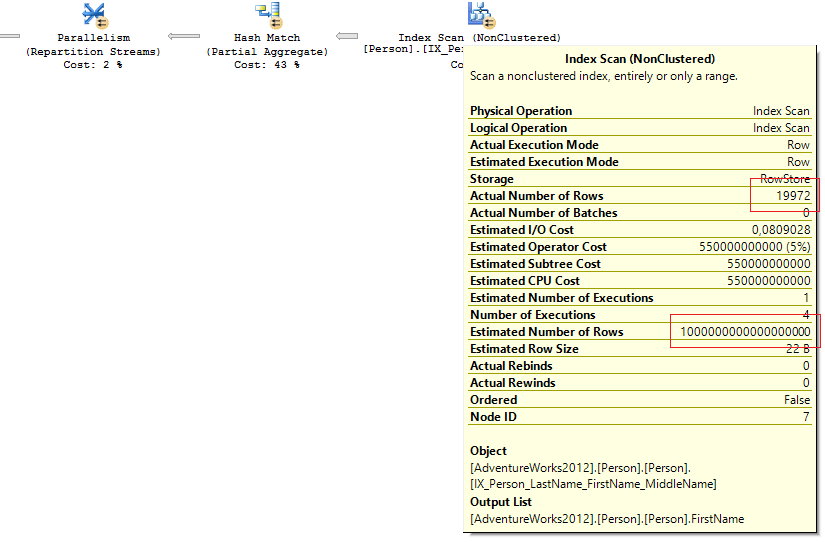
SELECT FirstName, COUNT(*) FROM Person.Person GROUP BY FirstName Looked at the plan for the request and saw there is clearly an inadequate value Estimated number of rows :
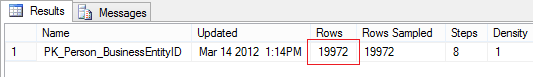
Looked at the statistics on the cluster index:
DECLARE @SQL NVARCHAR(MAX) DECLARE @obj SYSNAME = 'Person.Person' SELECT @SQL = 'DBCC SHOW_STATISTICS(''' + @obj + ''', ' + name + ') WITH STAT_HEADER' FROM sys.stats WHERE [object_id] = OBJECT_ID(@obj) AND stats_id < 2 EXEC sys.sp_executesql @SQL Everything was normal:
But in system representations about which we spoke earlier:
SELECT rowcnt FROM sys.sysindexes WHERE id = OBJECT_ID('Person.Person') AND indid < 2 SELECT SUM([rows]) FROM sys.partitions p WHERE p.[object_id] = OBJECT_ID('Person.Person') AND p.index_id < 2 there was sadness:

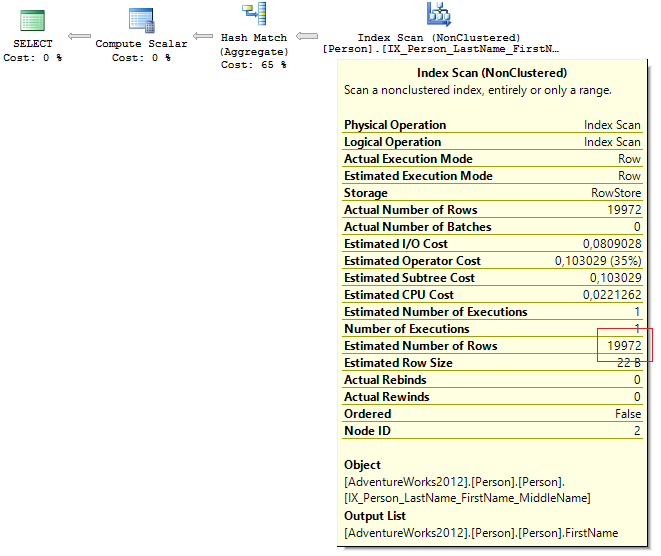
The query did not have predicates for filtering and the optimizer chose Full Index Scan . With Full Index / Table Scan, the optimizer does not take the expected number of rows from statistics, but refers to metadata (it is not sure if it always happens).
It’s no secret that, based on Estimated number of rows, SQL Server generates an execution plan and calculates how much memory is needed to execute it. If the estimate is incorrect, then more memory may be allocated to execute the request than is actually necessary.
SELECT session_id, query_cost, requested_memory_kb, granted_memory_kb, required_memory_kb, used_memory_kb FROM sys.dm_exec_query_memory_grants This is where the incorrect estimate of the number of lines leads:
query_cost requested_memory_kb granted_memory_kb required_memory_kb used_memory_kb ----------- -------------------- -------------------- -------------------- -------------- 1133156839 769552 769552 6504 6026 The problem was solved quite simply:
DBCC UPDATEUSAGE(AdventureWorks2012, 'Person.Person') WITH COUNT_ROWS DBCC FREEPROCCACHE After recompilating the request, everything returned to normal:
query_cost requested_memory_kb granted_memory_kb required_memory_kb used_memory_kb ----------- -------------------- -------------------- -------------------- -------------- 0,2919 1168 1168 1024 952 If system representations no longer seem to be a "saving wand", what options do we have left? You can do everything in the old fashioned way:
SELECT COUNT_BIG(*) FROM ... But with intensive insertion into the table, I would not trust the results. The "magic" hint NOLOCK does not guarantee the correct value:
SELECT COUNT_BIG(*) FROM ... WITH(NOLOCK) In fact, to get the correct value for the number of rows in a table, you need to perform a query under the SERIALIZABLE isolation level either using the TABLOCKX hint :
SELECT COUNT_BIG(*) FROM ... WITH(TABLOCKX) And what we get in the end ... exclusive table locking for the period of the query execution. And then everyone should decide for himself what is better for him to use. My choice is metadata.
Even more interesting is when you need to quickly calculate the number of rows by condition:
SELECT City, COUNT_BIG(*) FROM Person.[Address] --WHERE City = N'London' GROUP BY City If the table does not have frequent insert-delete operations, then you can create an indexed view:
IF OBJECT_ID('dbo.CityAddress', 'V') IS NOT NULL DROP VIEW dbo.CityAddress GO CREATE VIEW dbo.CityAddress WITH SCHEMABINDING AS SELECT City, [Rows] = COUNT_BIG(*) FROM Person.[Address] GROUP BY City GO CREATE UNIQUE CLUSTERED INDEX IX ON dbo.CityAddress (City) For these queries, the optimizer will generate an identical plan based on the cluster index of the view:
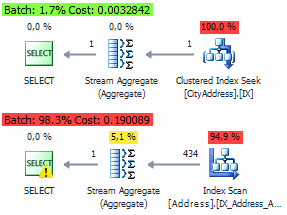
SELECT City, COUNT_BIG(*) FROM Person.[Address] WHERE City = N'London' GROUP BY City SELECT * FROM dbo.CityAddress WHERE City = N'London' Execution plan with and without an index view:
With this post I wanted to show that there are no perfect solutions for all occasions. And in each specific situation you need to act with an individual approach.
Everything was tested on SQL Server 2012 SP3 (11.00.6020) .
As conclusions ... When you need to calculate the total number of rows on a table, then I use metadata - this is the fastest way. And do not be afraid of the situation with the old bug, which I cited above.
If you need to quickly calculate the number of rows in a section of a field or by condition - then I try to use indexed views or filtered indexes. It all depends on the situation.
When the table is small or performance issues are not so hot, it’s really easier to write SELECT COUNT (*) in the old-fashioned way ...
If you want to share this article with an English-speaking audience:
What is the fastest way to calculate the record COUNT?
Source: https://habr.com/ru/post/271797/
All Articles