Spreadsheets under the hood

There may be multiple tables in our document. The tables have columns, rows, cells, and each of these elements can be pasted, deleted, moved, and edited. As a result of some such operations, it becomes necessary to recalculate formulas. The highlight of our editor is that we can recalculate only those formulas that really need to be recounted. That is, the formula, the value of which could change. In this way, we improve efficiency when editing large documents, and also avoid situations where the value of a cell containing, for example, the RAND function, changes with every editing of a document.
HOW TO CALCULATE FORMULAS?
Before starting the calculations, we need to collect information about the changes in the table, determine which particular formulas should be recounted, and establish the order of calculation.
Consider the simplest option: the formula “= 2 + 2” is entered into an empty cell. In this case, you just need to calculate the value of this formula.
A more complicated option is when the formula refers to another cell, as shown in Figure 1. Suppose that the value of cell B2 has changed. Then you need to somehow determine that there is a formula in B1 that refers to our cell, and calculate it, and then calculate the formula in A1.
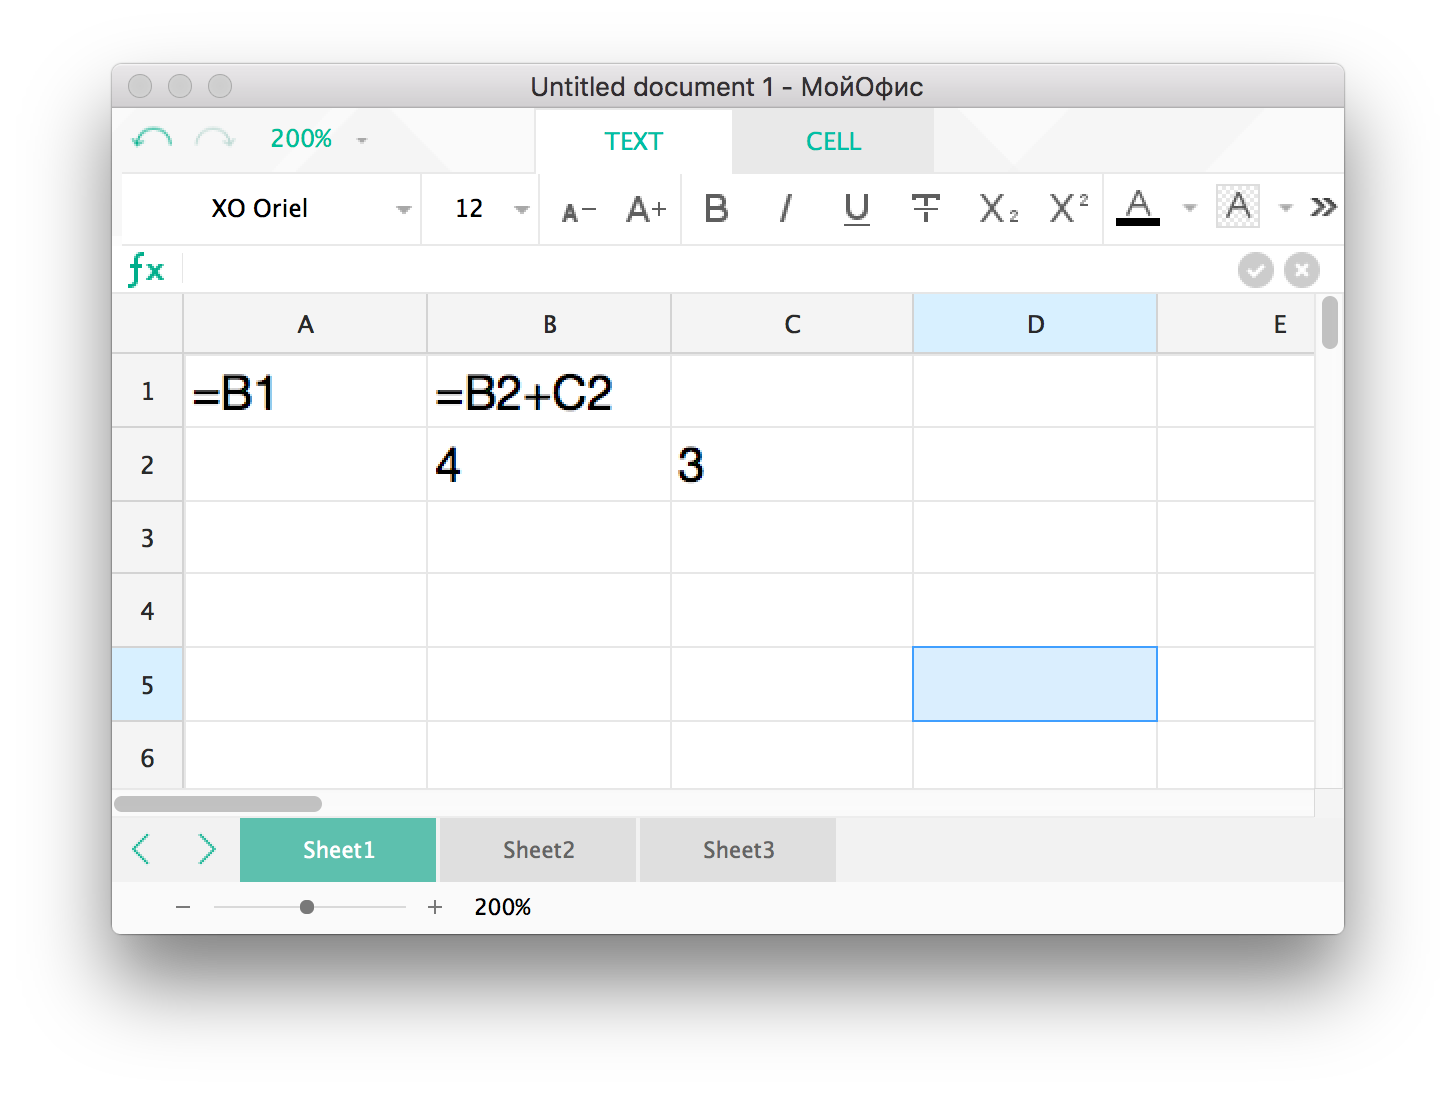
Fig. 1. An example of a simple relationship between formulas.
')
In this case, the formulas must be calculated strictly in the order in which they refer to each other. Otherwise, we will use the value of the cell that is not yet counted.
But this option can be complicated if the formulas form a cycle, as shown in Figure 2.

Fig. 2. An example of a cyclic relationship between formulas
Before proceeding to the calculation, it is necessary to find the cycles and determine the order in which the formulas are calculated. Because the cycle may not be like a ring, but be a strongly connected graph, where each vertex depends on each. Different order of calculation of formulas in the same cycle can lead to different results. We always guarantee the same result when recalculating cyclic formulas, which most other editors don’t do.
There are two criteria for exiting the cycle: the achievement of the maximum number of iterations and the achievement of a certain accuracy of the result of the calculation. Until the cycle is computed, we cannot continue to calculate the formulas dependent on it.
Additional problems arise with functions of type INDIRECT , which are not directly dependent on the cell. To determine what determines the formula containing a similar function, you must first calculate the value of the function parameter. And if this formula falls into a cycle that changes the value of the function parameter and with it the dependence of the formula at each iteration, it turns out that the dependency graph between the formulas can change dynamically during the calculation.
From the above we compose the following algorithm for calculating the formulas:
- Determine which cells have been modified.
- Find formulas that reference these cells.
- Build a dependency graph between formulas.
- Find cycles in the graph.
- Establish the procedure for calculating formulas.
- Calculate formulas with the possibility of parallelization of the calculation.
- If an implicit link is found in the formula and this link has changed as a result of the calculation, it is necessary to run the algorithm from the beginning.
HOW TO FIND FORMULAS FOR RECEIPT
In the above formula calculation algorithm, the first item is trivial. Let's take a closer look at the second step: how to determine which formulas refer to our cell.
Since the table size is huge - 1.7 * 10 ^ 10 cells, and the formula can refer to a whole column or a whole line, for example, “= A: B”, it does not make sense to store feedback from each cell to the formula. Rechecking all formulas every time a cell is changed is also inefficient. We decided to store data on which cells each formula refers to. Thus, for each table, we store references as coordinates of the upper left and lower right corner of the range. Now for reference A: B coordinates will look like (0, 0; 1, 1 048 576), where 1 048 576 is the maximum possible number of rows . When we find out that a cell has changed (COL, ROW), we can determine which ranges it falls into.
Suppose that we have in the document there are N links, and M cells have changed. Then the maximum possible size of the answer to the question “Which formulas should be recalculated?” Can be M * N, if it suddenly turns out that all the ranges overlap and all the cells fall into each of the ranges. But this is a rare case. Most often, ranges are sparse and we can think about how to optimize the search so as not to go through all the ranges for each of the cells. A simple and straightforward way to speed up the search a bit - the algorithm of a sweeping straight .
Let each range have two events - the beginning and the end. Sort events by the X coordinate. We also sort all changed cells (points) by X. Next, we represent the vertical line that we move along the X axis from point to point, and we support the collection of ranges with which our line intersects. For the range collection, we chose a hash table, because it is most effective if you want to add and remove items in a random order. When the event crosses the beginning of the range, add it to the collection; when the end crosses, we delete it. Thus, for each of the points, we always know which ranges it falls along the X axis. Among them, we will find those that fit on Y by an ordinary search.
Consider the example in the figure. The colored squares indicate the ranges, and the dots on the X axis are events. Let's go through the list of events to point 1 and see that we entered the red, blue and green ranges. After that, check each of them along the Y axis and determine that the point falls only in red and blue. Then we move to point 2 through X. First we see that the red range is over, remove it from the list, then delete the green. Add yellow. Point 2 falls in the yellow and blue ranges on the X axis, the same is done for Y.

Fig. 3. The scheme of the algorithm of the sweeping straight line as applied to the search for the occurrence of points in two-dimensional ranges
Although in the worst case, the running time of the algorithm is M * N, on average, the algorithm should work much faster. Under conditions of a sparse table, the running time may approach N + M * log (M). Data storage requires M + N memory. Obviously, this is the lowest possible cost. There is also a field for further optimizations, which we decided to postpone if we don’t run into performance problems.
Above, we mentioned that the search for ranges along the Y-axis is performed by brute force. But if a large number of points and ranges coincide along the X axis, you can apply the sweeping straight algorithm to search along the Y axis. To do this, create a list of events sorted along the Y axis for the current ranges. You do not need to sort the points, it is assumed that they have already been sorted earlier by X and Y. Then the search time along the Y axis will be N * log (N) + M, the optimization can be applied with such M and N, when the condition N * log is satisfied ( N) + M <M * N.
In the following articles, we will continue to talk about how we solved the problems of building a dependency graph between formulas, searched for cycles and set the order for calculating formulas in cycles and in a graph, about possible problems and their solutions when calculating functions with implicit dependencies, as well as about parallelizing calculations.
See you.
Source: https://habr.com/ru/post/271685/
All Articles