A way to quickly measure the performance of a random server
In the world of web development, there is often a problem of selecting a server for a web application, or, in analogy, testing the performance of an existing server. Perhaps we need to buy a new server so that it can withstand the expected load. Maybe the customer sends us his existing server for deployment. In any case, if after the deployment and launch of the application it will show poor performance, it will be asked from the team.
The main problem is that you need to quickly evaluate server performance without using special (read, complicated) tools and, of course, before the release. We must be able to remove some metrics from the server and, multiplying them by the known indicators of the application, obtain an estimate of the application's performance on this server.
In life, not every developer can accomplish this task, and of the rest, not everyone wants to perform it.
')
In this article I want to talk about the techniques and tools that we use to assess server performance.
The development team is coming to release and is soon preparing to release the first version of the product. The next step is to deploy the application on the battle server, which, under the terms of the project, must be purchased and configured. At the general meeting, the project manager suggests finding the person responsible for solving this “simple” questions: “So, who will choose the hosting and server? I will put the required amount in the budget for the next iteration. ” As a rule, there are no applicants for this task :). Moreover, direct delegation - “Vasya, take care of this task!” - also does not work: Vasya instantly finds and lists at least a dozen urgent / important tasks that now hang on it and hand them in yesterday (“in general, we - not admins "). Obeying the general feeling of self-preservation, the team coherently prompts the Project Manager where exactly to find such a specialist (no closer than in the next division), and He will select the perfect server configuration for sure.
Under the terms of the project server provides the customer. It looks like a great condition at the start of the project, but it is not so when we come to the release. To the client’s question “Is the server powerful?” There should be an invariable answer: “And then!”. After deployment, the Project Manager looks at the timings of web application responses with sad eyes. Unpleasant thoughts “Who is to blame?” And “What to do?” Appear. There comes an understanding that the server configuration had to be selected by oneself, but, on the other hand, a specialist from the neighboring unit was not found. In fact, it turns out that this powerful server is a cheap VPS, the parameters of which look good, but it shares the resources of the host with the army of its fellow neighbors. The client paid for the server for five years ahead :) and is not going to change anything (it was necessary to say before).
Advanced level - the client has a server and an admin. Server settings do not cause complaints, but after application deployment we see terrible brakes, lags, delays. Our development server is three times weaker in parameters, but the application runs eight times faster. None of our proposals for replacing the server or buying a new one is not accepted, since the admin has his own opinion - this is hindered by “your” application. The client does not know who to believe; he does not like the idea of attracting new expenses either, so the admin's argument counts. The Project Manager requires the team to clearly explain “why the application is slowing down” and the evidence with the server’s “fault” figures. The team, as always, has plenty of free time, so everyone eagerly tackles the task and puts a beer to a specialist from the neighboring department for a hint “where to dig”.
We summarize what situations we face and what tasks need to be able to solve:
- Selection of the server for the application and load
- Evaluation of the capabilities of the existing server
- To be able to answer the question "Why so slowly?"
The most accurate way to measure server performance is at the same time the most obvious: you need to install the application on the server and activate the real load. This method, although it gives an accurate result, is useless :) for several reasons:
Server purchased, operating system installed, sshd running. Open the console and enter the server. The black console, the green letters and the flashing heading mutely ask you: “What's next?”. It's time to think about what we will measure and what the performance is made of.
Up to this point, the question seemed simple: “I will launch a benchmark and everything will be clear.” Now, at the sight of a flashing console cursor, the thought has stopped and can in no way give out the necessary command.
What determines the performance of a web application to a greater degree:
We need to have four tools that could measure the speed of work separately:
With the measurement results in hand, we can comprehensively talk about the performance of the server as a whole, and we can also predict the performance of the web application.
github.com/akopytov/sysbench
It is impossible to describe the tool better than the author did, therefore I quote:
This is what you need! Sysbnech allows you to quickly get an idea of system performance without installing complex benchmarks and special tools.
Installing sysbench is simple:
You can compile:
To do this, run the calculation of twenty thousand prime numbers.
By default, the calculation will be performed in a single thread. Use the key --num-threads = N if we want to perform parallel computing.
The result of the test:
The most interesting thing about this test is the total time value. By running this test on multiple servers, we can compare the readings.
I will give an example of running this test on those servers that I had on hand at the time of preparing the article.

Notes:
Checking the disk subsystem is performed in three steps:
Preparation of test files:
The command will create a set of files with a total size of 70 gigabytes. The size should significantly exceed the amount of RAM, so that the test result is not affected by the operating system cache.
Test execution:
The test will be performed in a random read mode (rndw) for 300 seconds, after which the totals will be shown. Again, by default, testing will be performed in one thread (Number of threads: 1).
Cleaning up temporary files:
Example test result:
As a measure of the performance of the disk subsystem, you can use the value of the average data transfer rate (in this example it is 21.659Mb / sec).
Let's see what this test showed on my servers:
Notes:
The test checks the execution speed of MySQL server transactions, with each transaction consisting of both read and write requests.
It is very convenient to change the server settings in my.cnf, restart it and run a series of tests - you can immediately see how the performance changes.
Preparation for testing:
Run test:
The --oltp-read-only parameter can be set to the value on, then only read requests will be executed, which will allow evaluating the speed of the DBMS operation in the mode, for example, of a slave database.
The result of the test:
The most interesting parameter in the report is the number of transactions per second (transactions per sec).
How this test showed itself on the servers:
Notes:
Unfortunately, the sysbench tool has no built-in tools for testing PostgreSQL. But this does not bother us at all, since you can use the pgbench utility.
Additional Information:
www.postgresql.org/docs/devel/static/pgbench.html
The default performance test script repeatedly performs the following transaction:
To create test data, execute the command:
Perform testing:
Command keys mean that 4 clients will perform 5000 transactions in 4 threads. As a result, 20,000 transactions will be completed.
Result:
The most important thing here is tps.
Unfortunately, there are no comparative tests on different servers :)
Having played enough with sysbench and winding kilowatts of energy on the CPU of many servers, we learned quickly and very adequately assess the performance of a randomly taken server, which, in turn, allows us to give an expert forecast of the performance of a web application on this server.
However, there are situations when sysbench showed a good result, and the php application on this server shows very poor performance indicators.
Of course, the result is influenced by such parameters as:
I would very much like to have a tool that would be easy to install and, after launch, would produce a clear performance metric for the current PHP on the server. Moreover, I wanted this tool not to be affected by the performance of the disk subsystem (or network) - we measure only the work of the PHP interpreter on the bundle Processor + Memory.
Simple googling / thinking led to the idea that:
What was done: github.com/florinsky/af-php-bench
The script is compiled into a phar-archive, which makes it easier to download and run on an arbitrary server.
The minimum PHP version to run is 5.4.
For start:
The script performs ten tests, divided into three groups:
Test report:
The script allows not only to assess the overall performance of PHP on this server (total time), but also to see what it is made of. I repeatedly saw that the mediocre overall result was formed only because of one test: somewhere it could be the slow work of a random number generator, and somewhere it was work with long strings.
On the results page (https://github.com/florinsky/af-php-bench/blob/master/RESULTS.md) I wrote down the reports I received and grouped them into a general table. Sometimes the results are surprising :)
I would like to add that the above tools allow us to evaluate server performance only right now, at the time of measurement. It is necessary to understand that the processes running in parallel can influence the operation of the server. And if the measurement showed you a good result, it does not mean that he will always be like that.
This problem is especially acute if you analyze the server of a client that is already being used “to its fullest”. You do not know what cron-tasks are being performed, what processes are dormant and are waiting for their event to enable a long gzip / tar, the antivirus / spam filter and a dozen virtual machines still work here, in which the mysterious happens.
Atop and iostat help us to analyze the server behavior in time. We collect statistics for several days (or more), after which you can view it.
Write data to file:
Read entry:
CPU Load Measurement:
Conclusion:
Measurement of the disk subsystem load:
Conclusion:
And, of course, you can use Munin and his ilk to collect statistics from the server in a long chronological order.
Thanks for attention!
The main problem is that you need to quickly evaluate server performance without using special (read, complicated) tools and, of course, before the release. We must be able to remove some metrics from the server and, multiplying them by the known indicators of the application, obtain an estimate of the application's performance on this server.
In life, not every developer can accomplish this task, and of the rest, not everyone wants to perform it.
')
In this article I want to talk about the techniques and tools that we use to assess server performance.
Typical situations
№1
The development team is coming to release and is soon preparing to release the first version of the product. The next step is to deploy the application on the battle server, which, under the terms of the project, must be purchased and configured. At the general meeting, the project manager suggests finding the person responsible for solving this “simple” questions: “So, who will choose the hosting and server? I will put the required amount in the budget for the next iteration. ” As a rule, there are no applicants for this task :). Moreover, direct delegation - “Vasya, take care of this task!” - also does not work: Vasya instantly finds and lists at least a dozen urgent / important tasks that now hang on it and hand them in yesterday (“in general, we - not admins "). Obeying the general feeling of self-preservation, the team coherently prompts the Project Manager where exactly to find such a specialist (no closer than in the next division), and He will select the perfect server configuration for sure.
№2
Under the terms of the project server provides the customer. It looks like a great condition at the start of the project, but it is not so when we come to the release. To the client’s question “Is the server powerful?” There should be an invariable answer: “And then!”. After deployment, the Project Manager looks at the timings of web application responses with sad eyes. Unpleasant thoughts “Who is to blame?” And “What to do?” Appear. There comes an understanding that the server configuration had to be selected by oneself, but, on the other hand, a specialist from the neighboring unit was not found. In fact, it turns out that this powerful server is a cheap VPS, the parameters of which look good, but it shares the resources of the host with the army of its fellow neighbors. The client paid for the server for five years ahead :) and is not going to change anything (it was necessary to say before).
Number 3
Advanced level - the client has a server and an admin. Server settings do not cause complaints, but after application deployment we see terrible brakes, lags, delays. Our development server is three times weaker in parameters, but the application runs eight times faster. None of our proposals for replacing the server or buying a new one is not accepted, since the admin has his own opinion - this is hindered by “your” application. The client does not know who to believe; he does not like the idea of attracting new expenses either, so the admin's argument counts. The Project Manager requires the team to clearly explain “why the application is slowing down” and the evidence with the server’s “fault” figures. The team, as always, has plenty of free time, so everyone eagerly tackles the task and puts a beer to a specialist from the neighboring department for a hint “where to dig”.
We summarize what situations we face and what tasks need to be able to solve:
- Selection of the server for the application and load
- Evaluation of the capabilities of the existing server
- To be able to answer the question "Why so slowly?"
Requirements for measurement tools
The most accurate way to measure server performance is at the same time the most obvious: you need to install the application on the server and activate the real load. This method, although it gives an accurate result, is useless :) for several reasons:
- We want to know the evaluation of the server in advance, before launching into production.
- The measurement method should be fast and cheap.
- The measurement tool should be easy to use and install on the server.
- The measurement result should be easily interpretable and comparable.
Measurement object
Server purchased, operating system installed, sshd running. Open the console and enter the server. The black console, the green letters and the flashing heading mutely ask you: “What's next?”. It's time to think about what we will measure and what the performance is made of.
Up to this point, the question seemed simple: “I will launch a benchmark and everything will be clear.” Now, at the sight of a flashing console cursor, the thought has stopped and can in no way give out the necessary command.
What determines the performance of a web application to a greater degree:
- Speed of operation of a bunch of CPU + RAM
- Disk Subsystem Speed
- The performance of the language execution environment (in our case it is PHP)
- Setting up the database (we have this is MySQL or PostgreSQL)
- And, of course, from the application itself (on what resources it uses)
We need to have four tools that could measure the speed of work separately:
- for server components: CPU + RAM and Disk subsystem
- for software components: MySQL and PHP
With the measurement results in hand, we can comprehensively talk about the performance of the server as a whole, and we can also predict the performance of the web application.
Measurement tools
sysbench
github.com/akopytov/sysbench
It is impossible to describe the tool better than the author did, therefore I quote:
SysBench is a modular, cross-platform and multi-threaded benchmark.
Do you want to make a database of database benchmarks?
This is what you need! Sysbnech allows you to quickly get an idea of system performance without installing complex benchmarks and special tools.
Installing sysbench is simple:
apt-get install sysbench
You can compile:
$ ./autogen.sh
$ ./configure
$ make
Check CPU performance
To do this, run the calculation of twenty thousand prime numbers.
$ sysbench --test=cpu --cpu-max-prime=20000 run
By default, the calculation will be performed in a single thread. Use the key --num-threads = N if we want to perform parallel computing.
The result of the test:
CPU: Test execution summary: total time: 17.3915s total number of events: 10000 total time taken by event execution: 17.3875 per-request statistics: min: 1.66ms avg: 1.74ms max: 4.00ms approx. 95 percentile: 2.03ms The most interesting thing about this test is the total time value. By running this test on multiple servers, we can compare the readings.
I will give an example of running this test on those servers that I had on hand at the time of preparing the article.
Notes:
- G2 is about three times faster than A3
- A simple VPS'k on regrau for 250 rubles / month is comparable to the G2 :)
- Virtual netbook based on Xeon X3440 worked the same way as NUC i5
- Surprised by the same results on four servers
- Probably, the calculation of prime numbers takes place on the same CPU blocks, which do not reflect the overall processor performance.
Testing the disk subsystem
Checking the disk subsystem is performed in three steps:
- Prepare (generate) a set of test files
- Perform testing, remove indicators
- Clean up trash
Preparation of test files:
$ sysbench --test=fileio --file-total-size=70G prepare
The command will create a set of files with a total size of 70 gigabytes. The size should significantly exceed the amount of RAM, so that the test result is not affected by the operating system cache.
Test execution:
$ sysbench --test=fileio --file-total-size=70G --file-test-mode=rndrw --init-rng=on --max-time=300 --max-requests=0 run
The test will be performed in a random read mode (rndw) for 300 seconds, after which the totals will be shown. Again, by default, testing will be performed in one thread (Number of threads: 1).
Cleaning up temporary files:
$ sysbench --test=fileio cleanup
Example test result:
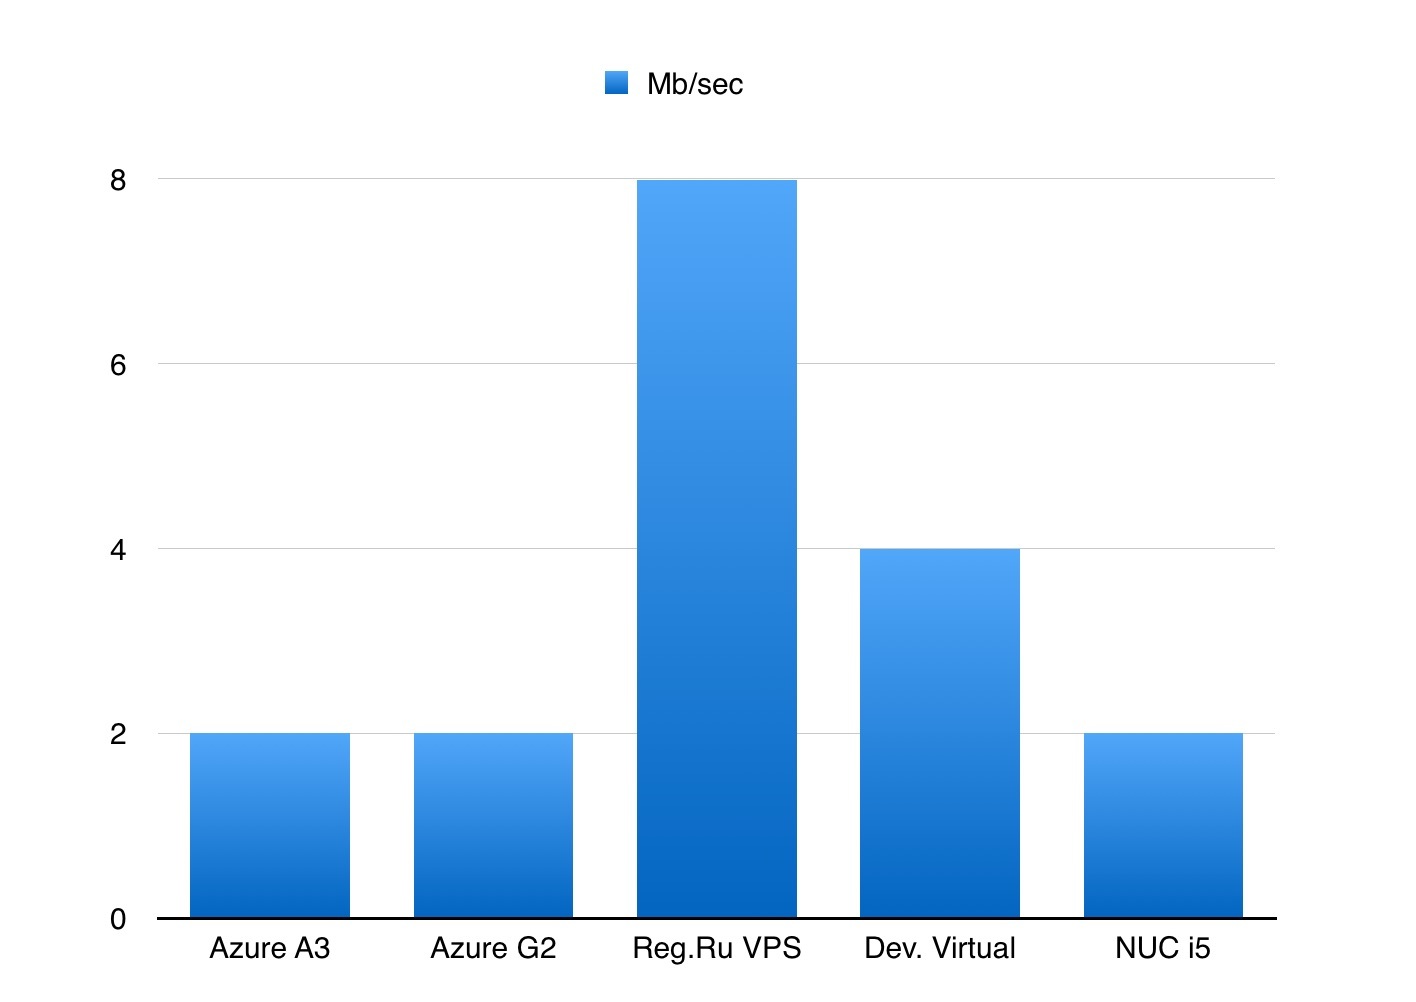
FileIO: Operations performed: 249517 Read, 166344 Write, 532224 Other = 948085 Read 3.8073Gb Written 2.5382Gb Total transferred 6.3455Gb (21.659Mb/sec) 1386.18 Requests/sec executed Test execution summary: total time: 300.0045s total number of events: 415861 total time taken by event execution: 178.9646 per-request statistics: min: 0.00ms avg: 0.43ms max: 205.67ms approx. 95 percentile: 0.16ms Threads fairness: events (avg/stddev): 415861.0000/0.00 execution time (avg/stddev): 178.9646/0.00 As a measure of the performance of the disk subsystem, you can use the value of the average data transfer rate (in this example it is 21.659Mb / sec).
Let's see what this test showed on my servers:
Notes:
- Suspiciously low speeds on all tested servers are striking.
- The NUC i5 has an ssd disk installed, no matter how many times I run the test, the data transfer rate has always been in the range from 1.5 to 2 Mb / sec
- On my working MacBook Pro 2015 with ssd, the speed value in this test is 140Mb / sec 8-)
MySQL OLTP test
The test checks the execution speed of MySQL server transactions, with each transaction consisting of both read and write requests.
It is very convenient to change the server settings in my.cnf, restart it and run a series of tests - you can immediately see how the performance changes.
Preparation for testing:
$ sysbench --test=oltp --oltp-table-size=1000000 --mysql-db=test --mysql-user=root --mysql-password=pass prepare
Run test:
$ sysbench --test=oltp --oltp-table-size=1000000 --mysql-db=test --mysql-user=root --mysql-password=pass --max-time=60 --oltp-read-only=off --max-requests=0 --num-threads=8 run
The --oltp-read-only parameter can be set to the value on, then only read requests will be executed, which will allow evaluating the speed of the DBMS operation in the mode, for example, of a slave database.
The result of the test:
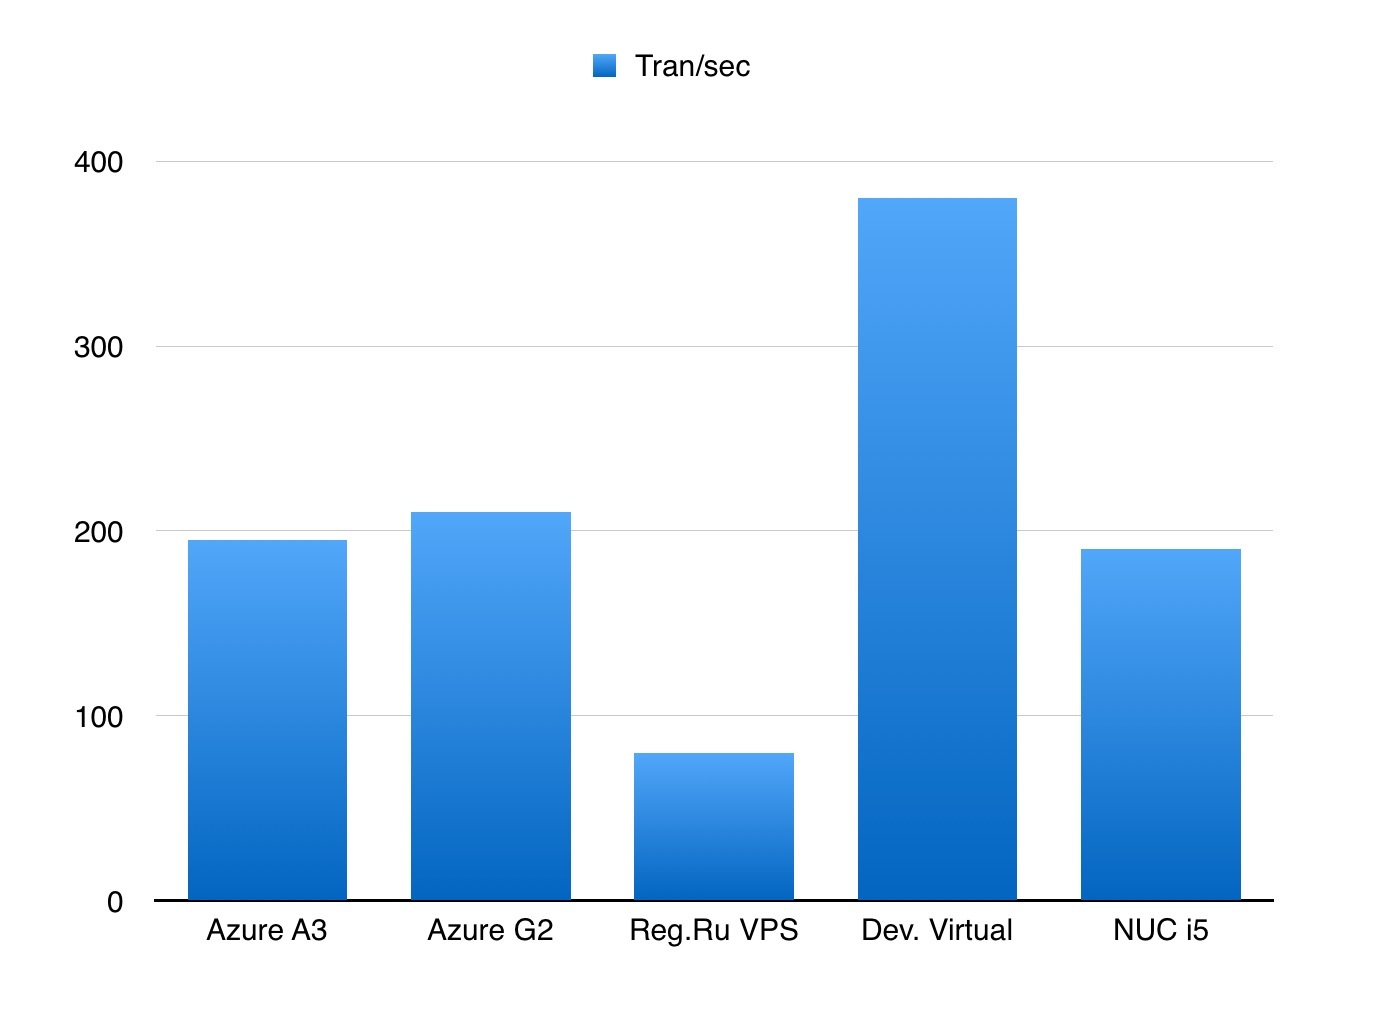
OLTP test statistics: queries performed: read: 564158 write: 0 other: 80594 total: 644752 transactions: 40297 (671.57 per sec.) deadlocks: 0 (0.00 per sec.) read/write requests: 564158 (9402.01 per sec.) other operations: 80594 (1343.14 per sec.) Test execution summary: total time: 60.0040s total number of events: 40297 total time taken by event execution: 479.8413 per-request statistics: min: 1.14ms avg: 11.91ms max: 70.93ms approx. 95 percentile: 15.54ms The most interesting parameter in the report is the number of transactions per second (transactions per sec).
How this test showed itself on the servers:
Notes:
- MySQL configuration was the same on all servers.
- Surprised by the lack of significant differences between the servers A3 and G2
- NUC i5 is comparable to G2
How to measure PostgreSQL performance?
Unfortunately, the sysbench tool has no built-in tools for testing PostgreSQL. But this does not bother us at all, since you can use the pgbench utility.
Additional Information:
www.postgresql.org/docs/devel/static/pgbench.html
The default performance test script repeatedly performs the following transaction:
BEGIN; UPDATE pgbench_accounts SET abalance = abalance + :delta WHERE aid = :aid; SELECT abalance FROM pgbench_accounts WHERE aid = :aid; UPDATE pgbench_tellers SET tbalance = tbalance + :delta WHERE tid = :tid; UPDATE pgbench_branches SET bbalance = bbalance + :delta WHERE bid = :bid; INSERT INTO pgbench_history (tid, bid, aid, delta, mtime) VALUES (:tid, :bid, :aid, :delta, CURRENT_TIMESTAMP); END; To create test data, execute the command:
$ pgbench -h localhost -U test_user -i -s 100 test
Perform testing:
$ pgbench -h localhost -U test_user -t 5000 -c 4 -j 4 test
Command keys mean that 4 clients will perform 5000 transactions in 4 threads. As a result, 20,000 transactions will be completed.
Result:
starting vacuum...end. transaction type: TPC-B (sort of) scaling factor: 10 query mode: simple number of clients: 4 number of threads: 4 number of transactions per client: 5000 number of transactions actually processed: 20000/20000 latency average: 0.000 ms tps = 3350.950958 (including connections establishing) tps = 3357.677756 (excluding connections establishing) The most important thing here is tps.
Unfortunately, there are no comparative tests on different servers :)
What about PHP performance?
Having played enough with sysbench and winding kilowatts of energy on the CPU of many servers, we learned quickly and very adequately assess the performance of a randomly taken server, which, in turn, allows us to give an expert forecast of the performance of a web application on this server.
However, there are situations when sysbench showed a good result, and the php application on this server shows very poor performance indicators.
Of course, the result is influenced by such parameters as:
- PHP version
- Presence of accelerator
- How and what compiled PHP
- Which extensions are activated
I would very much like to have a tool that would be easy to install and, after launch, would produce a clear performance metric for the current PHP on the server. Moreover, I wanted this tool not to be affected by the performance of the disk subsystem (or network) - we measure only the work of the PHP interpreter on the bundle Processor + Memory.
Simple googling / thinking led to the idea that:
- No existing tool
- Need to write your own reference algorithm (script)
- By virtue of the invariance of the algorithm, the obtained results can be compared
What was done: github.com/florinsky/af-php-bench
The script is compiled into a phar-archive, which makes it easier to download and run on an arbitrary server.
The minimum PHP version to run is 5.4.
For start:
$ wget github.com/florinsky/af-php-bench/raw/master/build/phpbm.phar
$ php phpbm.phar
The script performs ten tests, divided into three groups:
- The first group is common operations (loops, rand, creating / deleting objects)
- The second group of tests tests string functions, implode / explode, hash calculation
- Third - work with arrays
- All measurements are performed in seconds.
Test report:
[GENERAL] 1/10 Cycles (if, while, do) ...................... 6.72s 2/10 Generate Random Numbers ..................... 3.21s 3/10 Objects ..................................... 4.82s Time: .. 14.76 [STRINGS] 4/10 Simple Strings Functions ................... 13.09s 5/10 Explode/Implode ............................ 15.90s 6/10 Long Strings ............................... 30.37s 7/10 String Hash ................................ 23.57s Time: .. 82.93 [ARRAYS] 8/10 Fill arrays ................................ 22.32s 9/10 Array Sort (Integer Keys and Values) ....... 17.17s 10/10 Array Sort (String Keys and Values) ........ 14.29s Time: .. 53.79 TOTAL TIME: . 151.47 The script allows not only to assess the overall performance of PHP on this server (total time), but also to see what it is made of. I repeatedly saw that the mediocre overall result was formed only because of one test: somewhere it could be the slow work of a random number generator, and somewhere it was work with long strings.
On the results page (https://github.com/florinsky/af-php-bench/blob/master/RESULTS.md) I wrote down the reports I received and grouped them into a general table. Sometimes the results are surprising :)
Conclusion
I would like to add that the above tools allow us to evaluate server performance only right now, at the time of measurement. It is necessary to understand that the processes running in parallel can influence the operation of the server. And if the measurement showed you a good result, it does not mean that he will always be like that.
This problem is especially acute if you analyze the server of a client that is already being used “to its fullest”. You do not know what cron-tasks are being performed, what processes are dormant and are waiting for their event to enable a long gzip / tar, the antivirus / spam filter and a dozen virtual machines still work here, in which the mysterious happens.
Atop and iostat help us to analyze the server behavior in time. We collect statistics for several days (or more), after which you can view it.
atop
Write data to file:
$ atop -w /tmp/atop.raw 1 60
Read entry:
atop -r /tmp/atop.raw
iostat
CPU Load Measurement:
$ iostat -c 1
Conclusion:
%user %nice %system %iowait %steal %idle 82.21 0.00 17.79 0.00 0.00 0.00 79.05 0.00 20.70 0.00 0.00 0.25 80.95 0.00 19.05 0.00 0.00 0.00 80.95 0.00 19.05 0.00 0.00 0.00 80.85 0.00 18.91 0.25 0.00 0.00 ... Measurement of the disk subsystem load:
$ iostat -xd /dev/sda 1
Conclusion:
rkB/s wkB/s await r_await w_await svctm %util 0.00 2060.00 4.05 0.00 4.05 3.98 95.60 0.00 2000.00 3.97 0.00 3.97 3.95 96.40 0.00 1976.00 3.92 0.00 3.92 3.92 95.60 0.00 2008.00 3.95 0.00 3.95 3.93 96.00 0.00 2008.00 3.92 0.00 3.92 3.92 96.80 0.00 2020.00 4.03 0.00 4.03 4.00 97.60 0.00 2016.00 3.97 0.00 3.97 3.97 97.20 ... And, of course, you can use Munin and his ilk to collect statistics from the server in a long chronological order.
Thanks for attention!
Source: https://habr.com/ru/post/271485/
All Articles