Price elasticity in retail
In economic theory, many sections are devoted to the process of pricing in trade.
But in the practical use of pricing tools, retailers face many problems, this leads to errors in determining the price and, as a result, losses in profits.
For example, when a retailer lowers the price, consumer demand rises, but there is no profit. Increases the price of the goods - the demand falls.
')
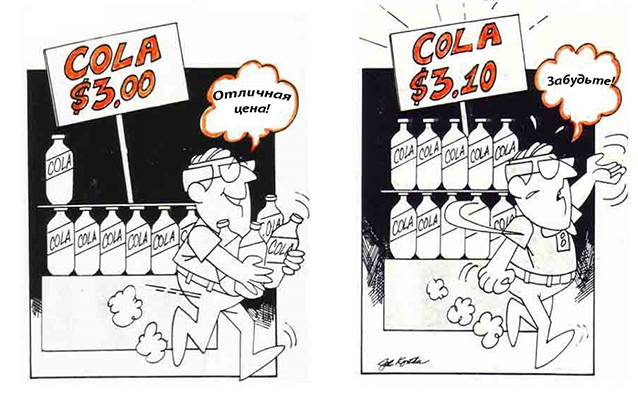
As you can see, there is a strong relationship between price, demand and profit.
Elasticity allows you to find the optimal ratio of cost and quantity of sales, allowing you to increase profits. In other words, price acts as a balancing factor between expected demand and income.
Many existing models of price elasticity claim to “world domination”, but the problem is that it is impossible to take into account in modeling absolutely all factors affecting price and demand.
The model we developed offers price correction for each store separately, using historical data for half a year and taking into account factors of frequency, quantity and stability of sales, which increase the accuracy of the analysis. The model does not assume the maximum coverage of all possible factors and cases of price changes, but it does work to adjust the price of certain goods in our customers' stores.
Our approach is different from the classical one, and we will explain below.
The classic model of price elasticity is the determination of the point price elasticity coefficient.

This approach is good in theory, but not sufficiently reliable in practice because:
The disadvantages of the model of price elasticity can be seen by visualizing the ratio of price changes and sales for a particular product.
Build a graph:
horizontally - price changes;
vertically - changes in sales of goods.
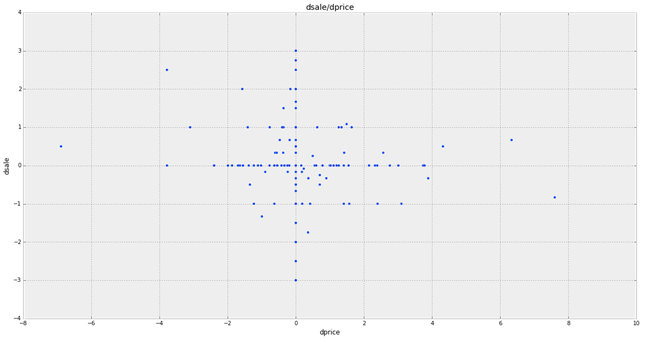
What did we get? Most points are concentrated around 0, both in y and in x. As you can see, price changes have virtually no effect on demand, and demand itself varies with a stable price. Tracking specific dependencies is not possible.
We will look for a different approach to determine the optimal price for the goods.
1. It is necessary to determine the period for the analysis of the ratio of price and demand.
The period chosen by us for the analysis of price elasticity is six months. This allows for calculations to minimize the risks of inflation and other external fluctuations of the retail market.
2. We carry out calculations for each store separately.
The optimal price for the goods of each store is calculated separately, since each store has its own size, range, customer contingent, customer demand.
3. For analysis, we take only products with relatively stable demand, which are sold at least twice a week.
4. We track demand fluctuations depending on the price.
We will build a graph, placing the sale of goods on the vertical axis, the price of goods - on the horizontal.
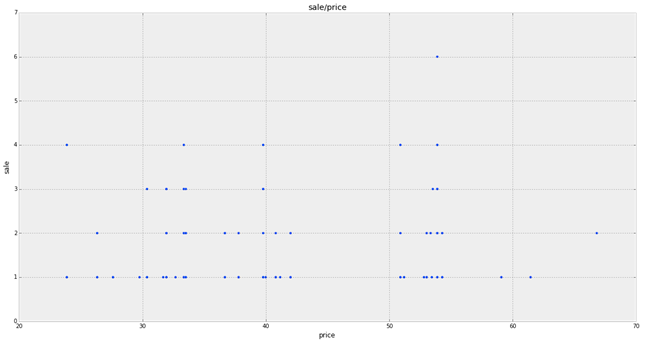
As you can see, the sales points on the chart are grouped relative to the X axis by price changes.
In the grocery retail, where prices do not change dramatically, it would be logical to group sales by price changes in increments of 0.5 UAH. Next, we determine the average number of sales in each group and exclude from the analysis all single sales as unreliable.
5. Place the obtained points of the average sales of goods for each price group on the chart.
The graph clearly shows that there is a dependence of the obtained data and we can determine the linear regression (trend).
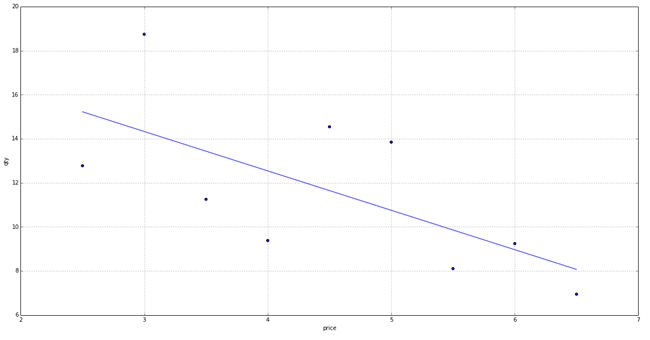
Experimentally, we determined that the model can be used if the price of a product has changed at least 4 times, otherwise the result will be inaccurate.
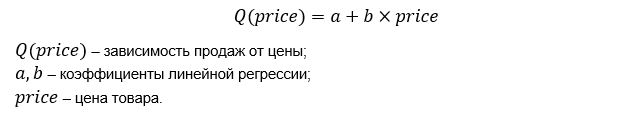
6. We obtained a formula for determining the dependence of the quantity of sales on the price.
We will also consider variants to be unreliable when b> = 0. In this case, for some reason, the demand for goods increases, although the price rises. So these indicators need to be studied separately. It is possible that the demand for this product is not elastic at all, which means it does not fit into our model.
Visually, the graph when the indicator b> = 0 looks like this:
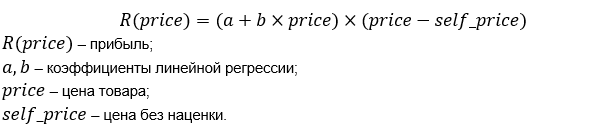
7. Build a model of dependence of profit on the price of the goods.
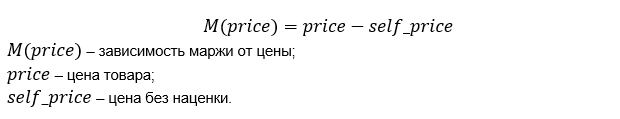
To do this, we need to determine the dependence of the margin on the price.
Profit is equal to the dependence of sales, multiplied by the margin of the price.
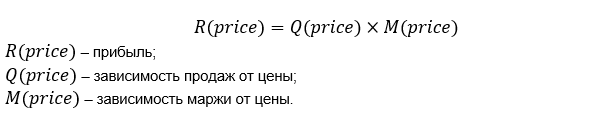
Substitute in the formula the dependence of sales and margin on price.
8. Build a graph of profit from the price of the goods.
Vertical - daily profit.
Horizontally - the price of the goods.
The chart begins to be built from the price point with no extra charge, in which the profit is equal to 0.
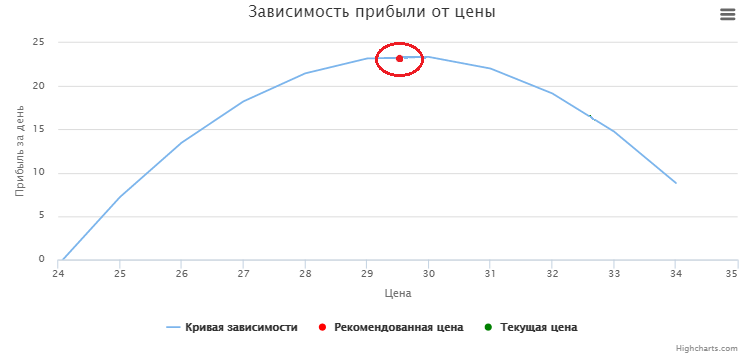
We find a point on the graph in which the profit will be maximum and determine the value of the optimal price.
The model shows recommendations for lowering the price from current to optimal, which will bring additional profit by increasing the number of sales per day.
We will not consider the possibility of raising the price to the optimum (as in the graph below). Indeed, when pricing it is necessary to take into account many external factors: the price of competitors, network pricing policy, government recommendations and restrictions.

Let us examine several cases of using the BI Datawiz.io functional to select the optimal price for a product. The service analyzes the changes in prices and demand for each product of the store, and on the basis of the model described, makes recommendations on the optimal change in the price of goods, where this will entail an increase in profits.
In Store 1 , one recommendation was formed for the Soviet Champagne product from Our Kiev brand.

The table shows:
Those. all the necessary information to make a decision.
For more in-depth analysis and informed decision-making, the retailer can look at the graphs of the dependence of the number of sales on the price and make sure that the calculations and recommendations are correct.
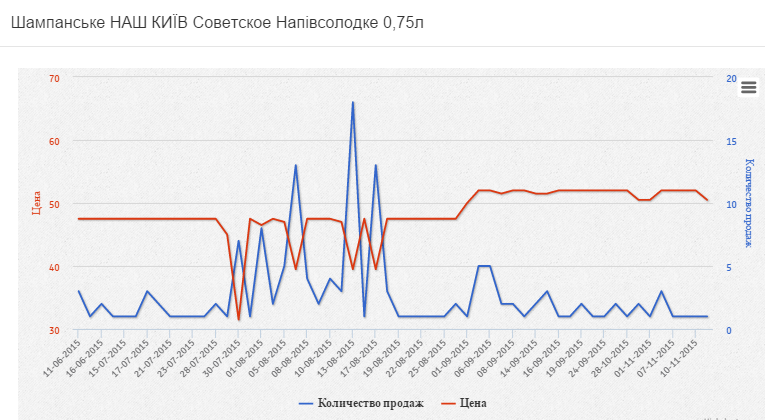
As we see, with a short-term price reduction (most likely during this period there were stocks for the goods), the sales of goods increased significantly. The increase in the price of all alcohol, including champagne, from September 1 led to a drop in sales.
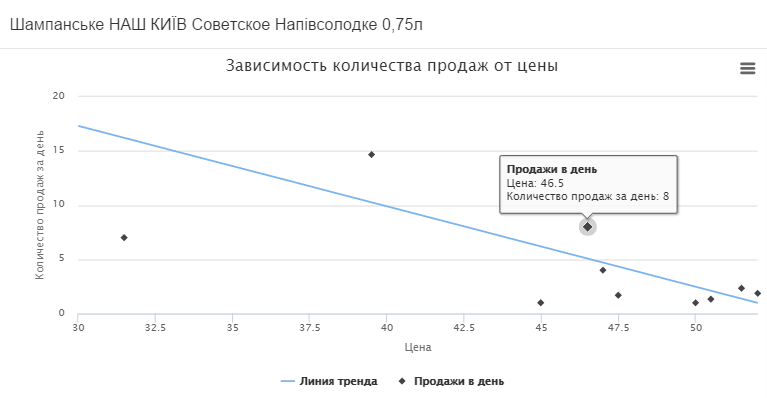
In the second graph, we see how the average sales per day changed depending on the price and the trend line formed.
On graph 3, the current and recommended price for our Kiev champagne is determined.
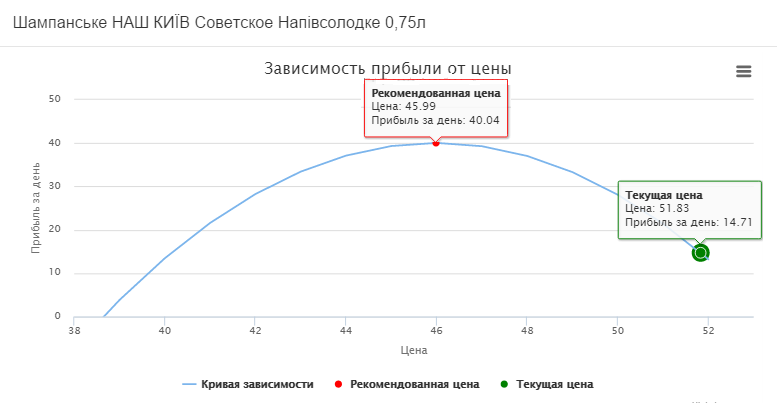
So, at the moment champagne is sold at a price of 51, 83 UAH. per unit, the profit per day is 14.71 UAH. By reducing the price to 45.99 UAH. sales will grow and the daily profit will be 40.04 UAH.
This is 25.33 UAH. more than the current daily profit.
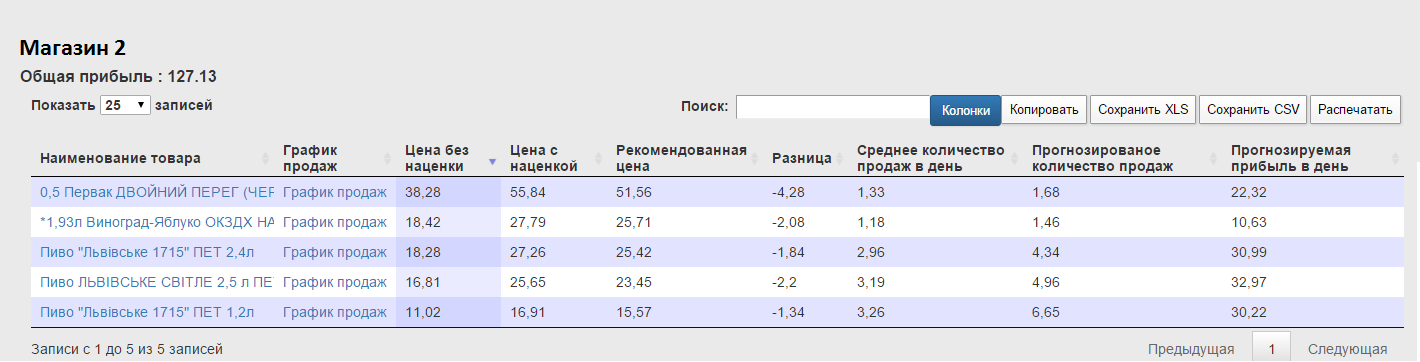
In Shop 2, we see recommendations for price changes for 5 products. The total daily profit of the store will be 127.13 UAH.
Consider the graphs of the formation of the optimal price on the example of Lvivske beer in PET bottles of 1.2 liters.
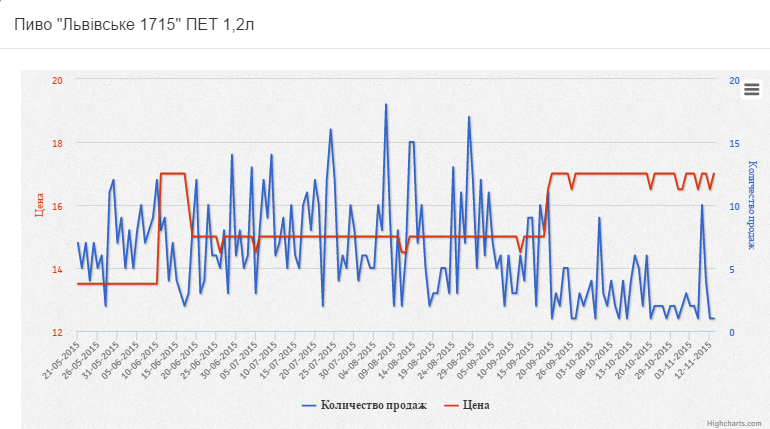
As you can see, over the past six months, the price of this product has changed 6 times. And consumer demand fluctuated quite strongly even at the same price.
There is a linear relationship.
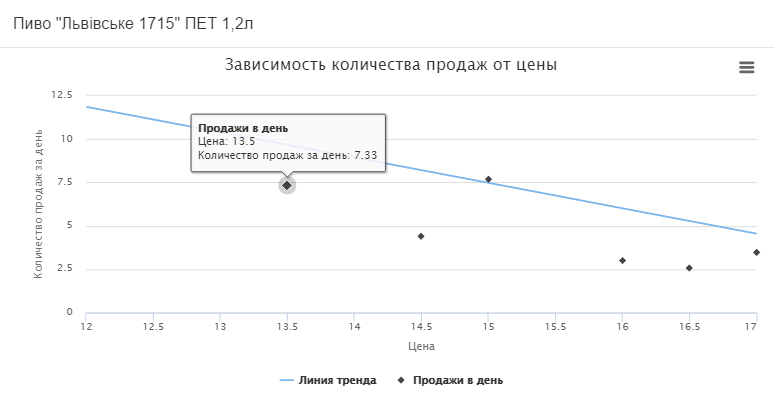
It is recommended to reduce the price from 16.91 UAH. up to 15.57 UAH. at the same time the daily profit will increase by 2.65 UAH. and will be 30.22 UAH., as seen on the curve below.
In Store 3, the service has built recommendations for 4 products.
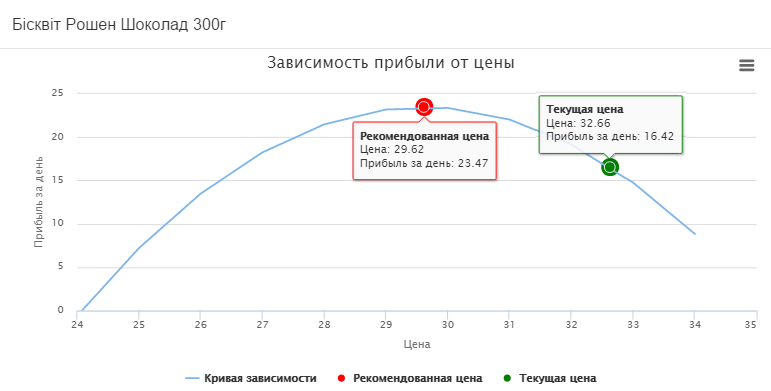
Let us analyze the price elasticity of the product Chocolate sponge cake from the Roshen brand.
On the chart, we see 5 price changes, but with the last price increase to UAH 33.5. everyday sales of goods do not exceed 1, which means we do not use such data. This can be seen in graph 2, where 4 indicators of sales are taken into account.
The following graph shows the current price of biscuit which is 32.66 UAH. with an everyday income of 16.42 UAH. The recommended price is UAH 29.62, which will increase the profit by UAH 7.05.
We note that our proposed approach to determining the optimal price is close to the practice and the real state of affairs in retail, eliminates the risks of the classical approach to price elasticity, which uses only two indicators, does not take into account seasonality and other factors.
The model developed by us takes into account the time factor, frequency, quantity and stability of sales. Gives the opportunity for self-analysis using the visualization of historical data, changes in prices and demand.
The BI Datawiz.io service with the help of the developed model processes the entire volume of sales data and shows the results in the form of a list of products for which the retailer will bring a price reduction.
But in the practical use of pricing tools, retailers face many problems, this leads to errors in determining the price and, as a result, losses in profits.
For example, when a retailer lowers the price, consumer demand rises, but there is no profit. Increases the price of the goods - the demand falls.
')
As you can see, there is a strong relationship between price, demand and profit.
Elasticity allows you to find the optimal ratio of cost and quantity of sales, allowing you to increase profits. In other words, price acts as a balancing factor between expected demand and income.
Many existing models of price elasticity claim to “world domination”, but the problem is that it is impossible to take into account in modeling absolutely all factors affecting price and demand.
The model we developed offers price correction for each store separately, using historical data for half a year and taking into account factors of frequency, quantity and stability of sales, which increase the accuracy of the analysis. The model does not assume the maximum coverage of all possible factors and cases of price changes, but it does work to adjust the price of certain goods in our customers' stores.
Our approach is different from the classical one, and we will explain below.
The classic model of price elasticity is the determination of the point price elasticity coefficient.
This approach is good in theory, but not sufficiently reliable in practice because:
- The sale of goods is influenced by many factors other than price - competition, advertising, customer loyalty to the brand, availability of goods, etc.
- The model does not include the time factor, which means it excludes seasonal effects on consumer demand that are important for retail.
- Two price indicators for accurate analysis are few.
The disadvantages of the model of price elasticity can be seen by visualizing the ratio of price changes and sales for a particular product.
Build a graph:
horizontally - price changes;
vertically - changes in sales of goods.
What did we get? Most points are concentrated around 0, both in y and in x. As you can see, price changes have virtually no effect on demand, and demand itself varies with a stable price. Tracking specific dependencies is not possible.
We will look for a different approach to determine the optimal price for the goods.
1. It is necessary to determine the period for the analysis of the ratio of price and demand.
The period chosen by us for the analysis of price elasticity is six months. This allows for calculations to minimize the risks of inflation and other external fluctuations of the retail market.
2. We carry out calculations for each store separately.
The optimal price for the goods of each store is calculated separately, since each store has its own size, range, customer contingent, customer demand.
3. For analysis, we take only products with relatively stable demand, which are sold at least twice a week.
4. We track demand fluctuations depending on the price.
We will build a graph, placing the sale of goods on the vertical axis, the price of goods - on the horizontal.
As you can see, the sales points on the chart are grouped relative to the X axis by price changes.
In the grocery retail, where prices do not change dramatically, it would be logical to group sales by price changes in increments of 0.5 UAH. Next, we determine the average number of sales in each group and exclude from the analysis all single sales as unreliable.
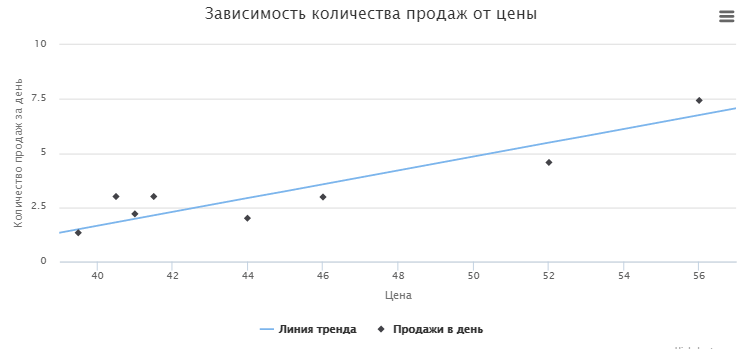
5. Place the obtained points of the average sales of goods for each price group on the chart.
The graph clearly shows that there is a dependence of the obtained data and we can determine the linear regression (trend).
Experimentally, we determined that the model can be used if the price of a product has changed at least 4 times, otherwise the result will be inaccurate.
6. We obtained a formula for determining the dependence of the quantity of sales on the price.
We will also consider variants to be unreliable when b> = 0. In this case, for some reason, the demand for goods increases, although the price rises. So these indicators need to be studied separately. It is possible that the demand for this product is not elastic at all, which means it does not fit into our model.
Visually, the graph when the indicator b> = 0 looks like this:
7. Build a model of dependence of profit on the price of the goods.
To do this, we need to determine the dependence of the margin on the price.
Profit is equal to the dependence of sales, multiplied by the margin of the price.
Substitute in the formula the dependence of sales and margin on price.
8. Build a graph of profit from the price of the goods.
Vertical - daily profit.
Horizontally - the price of the goods.
The chart begins to be built from the price point with no extra charge, in which the profit is equal to 0.
We find a point on the graph in which the profit will be maximum and determine the value of the optimal price.
The model shows recommendations for lowering the price from current to optimal, which will bring additional profit by increasing the number of sales per day.
We will not consider the possibility of raising the price to the optimum (as in the graph below). Indeed, when pricing it is necessary to take into account many external factors: the price of competitors, network pricing policy, government recommendations and restrictions.
Let us examine several cases of using the BI Datawiz.io functional to select the optimal price for a product. The service analyzes the changes in prices and demand for each product of the store, and on the basis of the model described, makes recommendations on the optimal change in the price of goods, where this will entail an increase in profits.
In Store 1 , one recommendation was formed for the Soviet Champagne product from Our Kiev brand.
The table shows:
- Name of product;
- price without extra charge;
- current price with extra charge;
- recommended price;
- average number of sales per day;
- the projected amount of sales when the price changes;
- the projected increase in profits for a particular product and for the store as a whole.
Those. all the necessary information to make a decision.
For more in-depth analysis and informed decision-making, the retailer can look at the graphs of the dependence of the number of sales on the price and make sure that the calculations and recommendations are correct.
As we see, with a short-term price reduction (most likely during this period there were stocks for the goods), the sales of goods increased significantly. The increase in the price of all alcohol, including champagne, from September 1 led to a drop in sales.
In the second graph, we see how the average sales per day changed depending on the price and the trend line formed.
On graph 3, the current and recommended price for our Kiev champagne is determined.
So, at the moment champagne is sold at a price of 51, 83 UAH. per unit, the profit per day is 14.71 UAH. By reducing the price to 45.99 UAH. sales will grow and the daily profit will be 40.04 UAH.
This is 25.33 UAH. more than the current daily profit.
In Shop 2, we see recommendations for price changes for 5 products. The total daily profit of the store will be 127.13 UAH.
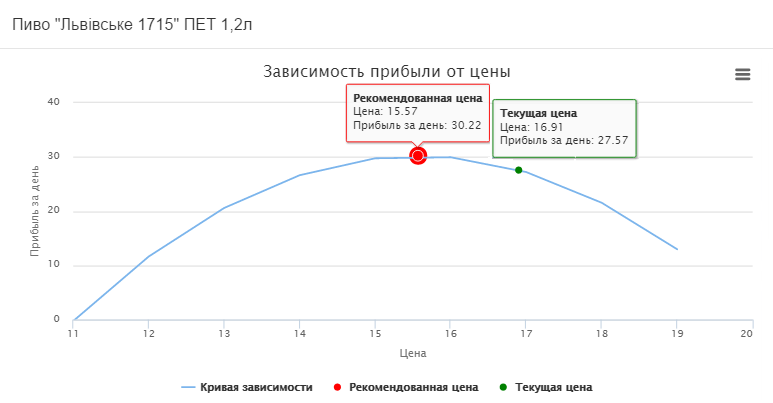
Consider the graphs of the formation of the optimal price on the example of Lvivske beer in PET bottles of 1.2 liters.
As you can see, over the past six months, the price of this product has changed 6 times. And consumer demand fluctuated quite strongly even at the same price.
There is a linear relationship.
It is recommended to reduce the price from 16.91 UAH. up to 15.57 UAH. at the same time the daily profit will increase by 2.65 UAH. and will be 30.22 UAH., as seen on the curve below.
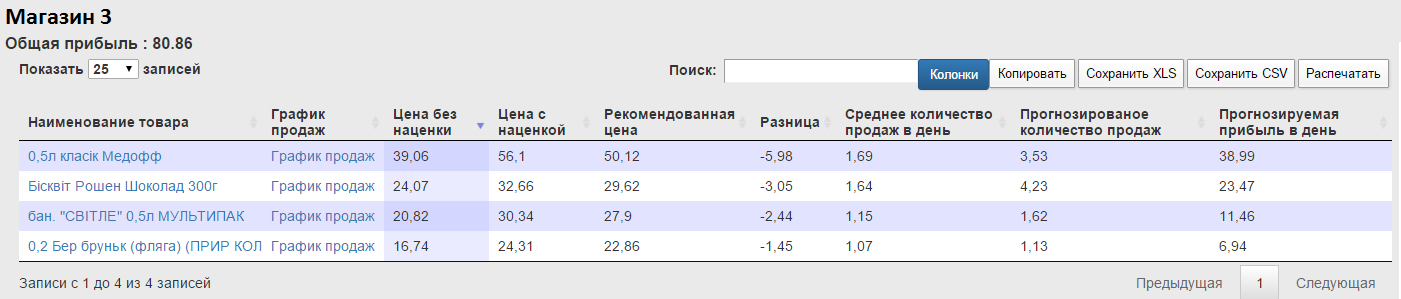
In Store 3, the service has built recommendations for 4 products.
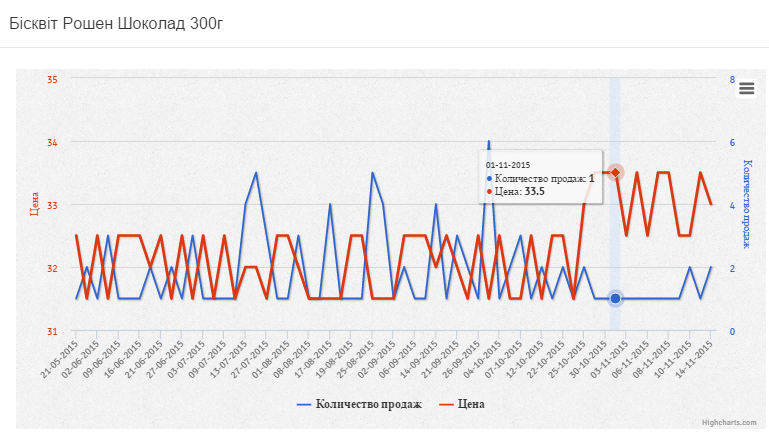
Let us analyze the price elasticity of the product Chocolate sponge cake from the Roshen brand.
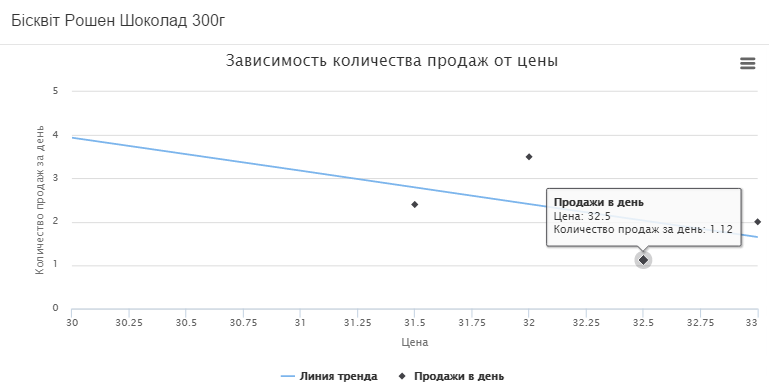
On the chart, we see 5 price changes, but with the last price increase to UAH 33.5. everyday sales of goods do not exceed 1, which means we do not use such data. This can be seen in graph 2, where 4 indicators of sales are taken into account.
The following graph shows the current price of biscuit which is 32.66 UAH. with an everyday income of 16.42 UAH. The recommended price is UAH 29.62, which will increase the profit by UAH 7.05.
We note that our proposed approach to determining the optimal price is close to the practice and the real state of affairs in retail, eliminates the risks of the classical approach to price elasticity, which uses only two indicators, does not take into account seasonality and other factors.
The model developed by us takes into account the time factor, frequency, quantity and stability of sales. Gives the opportunity for self-analysis using the visualization of historical data, changes in prices and demand.
The BI Datawiz.io service with the help of the developed model processes the entire volume of sales data and shows the results in the form of a list of products for which the retailer will bring a price reduction.
Source: https://habr.com/ru/post/271169/
All Articles