Zabbix - optimization with high loads

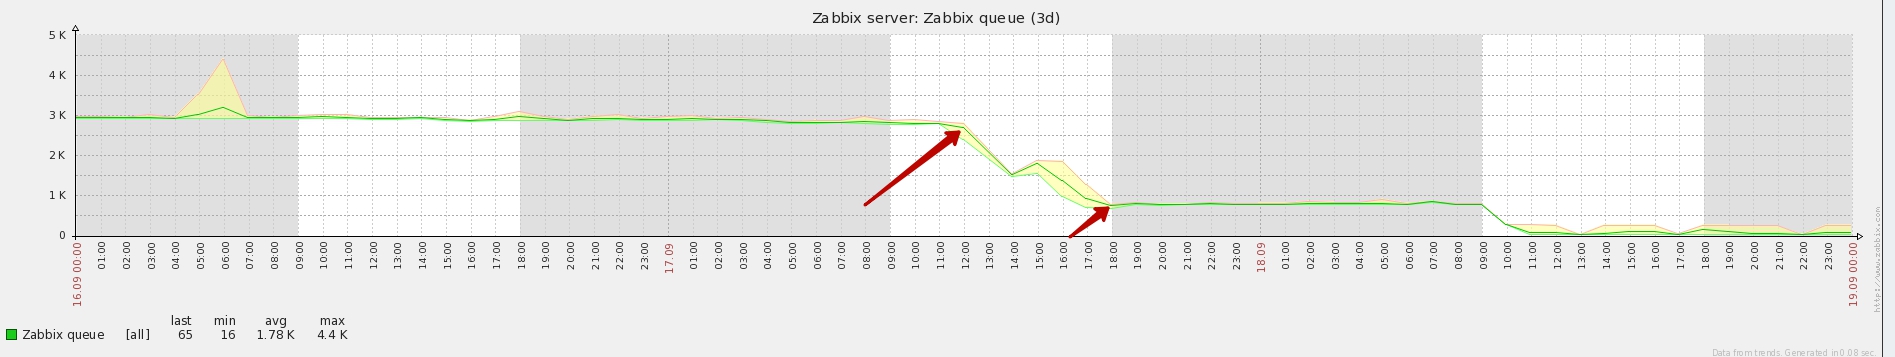
Recently it became obvious that our zabbiks is not coping with the load. There were frequent false positives, dips appeared in the charts. The reason turned out to be simple, the queue in zabbix grew to indecent sizes and was about 2000. There was an obvious solution - an increase in instances, but resources did not allow it and as it became obvious in the future it would be a bad decision. How we solved this problem below. Looking ahead: the problem was successfully solved and the queue was reduced to 30-40 on average.
')
As seen in the picture there were 3 turning points, in fact, as well as two problems. Here are more about them:
1 problem is the hosts that are not active for a long time, but not deleted. Their survey takes time and resources. Identify them was easy. We have monitored hosts only with agents. All hosts whose agent was unavailable were marked as problematic. Further analysis was performed and remote hosts were removed to the end, and for the rest, the firewall rules were corrected. But it turned out not so simple. In the process of searching for outdated hosts, several duplicate hosts were noticed. By duplicate hosts, we mean completely identical hosts with one ID in the database. The reason for duplication was never found out, a bug was created in zabbix, but, unfortunately, there was no reaction at the time of this writing. But to search for duplicate hosts a request was made directly to the database:
select host, Count(host) as Count from hosts group by host having count(host)>1; This query returns a list of identical hosts, of which there are more than one.
2 problem was from the same area. It consisted in a large number of no longer relevant items left over from the old templates. To solve this moment, all the items with the status not supported were analyzed and the extra ones were removed.
Well, the third final chord is a Linux template. Types of checks have been configured to use zabbix active agent. How it differs from ordinary checks is well described in the documentation. When there are a lot of checks, they begin to consume server resources. For the template, it was quickly changed from zabbix agent (active) to zabbix agent.
As a result of these three simple actions, the queue was reduced from more than 3 K to 30-40.
PS: Another convenient tool for analyzing the load on zabbix is embedded in zabbix, a time analyzer for receiving data. You can view it: Administration -> Queue. The logic is simple: the longer the data acquisition time, the greater the load on the server.
Further plans are to change the DBMS from mysql to postgresql. According to the results, we will definitely share with you how we did it and what results we got.
Author: Magvai69 System Administrator
Source: https://habr.com/ru/post/271097/
All Articles