Algorithms and trading on the stock exchange: Hiding large transactions and predicting the price of shares

New York University professor of mathematics and financial markets expert Marco Avellaneda (Marco Avellaneda) made a presentation in which he described how large investors “hide” their large-scale transactions using algorithms, while other traders are engaged in predicting stock price changes.
In our today's material - the main points of this work.
')
Why do we need algorithms
Algorithmic trading since its inception in the early 90s of the last century has been a tool for large investors and hedge funds. Decimalization (the transition on the New York Stock Exchange to use in trading shares on the decimal system - the minimum price step began to equal 1 cent, not 1/16 of a dollar), Direct Market Access (DMA) technology, 100% electronic exchanges , reduction of commissions of stock exchanges and brokers, the emergence of various stock exchanges in the USA and in other countries - all this led to an explosive growth in the number of traders using algorithms.
Avellaneda describes the purpose of using algorithms in stock trading as follows. In the opinion of the professor, in the case of large institutional investors, they are used primarily not to maximize the potential profits from a particular transaction, but to control market risk and order execution costs.
Simply put, usually large investors need to perform operations with a large amount of shares. Often the volume of the transaction is higher than the market can "digest" without changing the price of the stock. The need to make the purchase of a huge number of shares will lead to a change in their price and the emergence of the so-called "slippage." Thus, it will not be possible to execute the entire order at the same price - at first the transactions will be held at the right price, but gradually it will become less and less profitable.
To avoid this, it is necessary to break large orders into smaller ones that are executed via the Internet within minutes, hours or days.
To make this as profitable as possible, the algorithm must control the average share price. You can evaluate it by comparing with the market “benchmark” - the global average price per day, the closing price or the opening price, etc.
But the problem of determining how to break a large order into smaller ones is not the only one. The algorithm must also decide how exactly to place an order on the market - in the form of a limit or market order - and at what price. It is necessary to achieve the best price for each such child order.
The development of financial markets and the emergence of new trading instruments have made this task much more difficult and interesting.
The times when customers could transfer applications to their brokers only by phone or fax are a thing of the past. Now there are different ways to connect to electronic trading. For example, it is possible to connect a trading robot to the brokerage system using an API - in this case, orders are sent to the brokerage system, and from there they go to the exchange (ITinvest has its own SmartCOM API ).

In the case of algorithmic trading, as a rule, the speed of the strategy is important, so many traders prefer to use the direct market access technology (DMA - ITinvest provides such access to Russian and foreign exchanges). In case of its application, the trading robot interacts directly with the exchange trading system, bypassing the broker system, which allows to gain time.
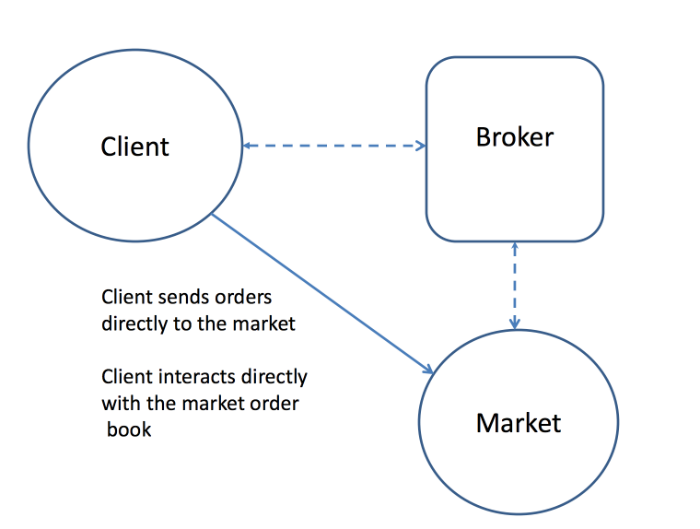
But this is not the most difficult trade option. The emergence of a large number of different trading platforms has led to the development of algorithms for “smart routing” orders - such systems not only try to make the most profitable transactions on a particular stock exchange, but also analyze which of the available sites are currently better conditions to send an order there .
Thus, there are three levels of development of modern algorithms.
- Macro Trading Algorithms - determine the trading strategy;
- Micro trading algorithms - in fact, trading "engines" of placing orders;
- Smart routing algorithms - if the work is carried out on several exchanges simultaneously.
Examples of trading algorithms
There are several types of algorithmic strategies. One of them is the executive strategy, which is aimed at solving the problem of buying or selling a large amount of a financial instrument (for example, stocks) with a minimum deviation of the final weighted average transaction price from the current market price.
Examples of algorithms that solve this problem are the TWAP and VWAP algorithms.
TWAP algorithm
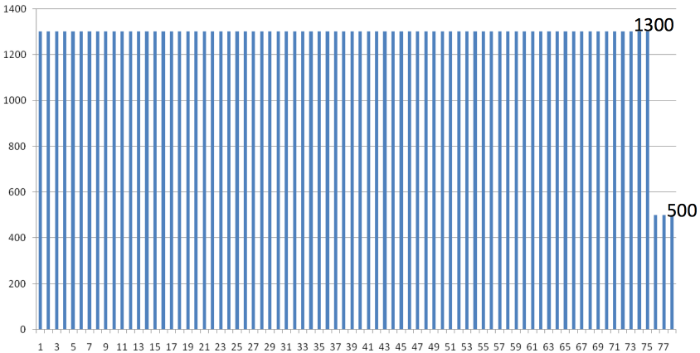
Using TWAP (Tie Weighted Average Price - time-weighted average price) implies uniform execution of an order to buy or sell for a given number of iterations over a given period of time. For this purpose, market orders are constantly placed at the prices of the best demand or supply, adjusted by the specified percentage deviation.
For example, the purchase of 100 thousand shares during the day may look like this (five-minute consecutive intervals are used):
VWAP algorithm
VWAP (Volume weighted average price) is based on the following scheme. Trading volume is usually higher at the beginning and end of the trading session, and in its middle it is smaller. To execute a large order with minimal cost, it is broken down into smaller orders based on the time of day.
For this:
- The algorithm estimates the average trading volume at five-minute intervals.
- Within each interval, deals are made on the amount of the instrument, which is proportional to the standard volume.
The properties of this algorithm include completeness (the size of transactions is always known in advance), as well as the use of historical data for estimating the volume function.


Percentage of Volume (POV)
The Percentage of Volume (POV) algorithm solves the same problem as VWAP, but using information on the trading volume on a particular current day as a benchmark. The idea is to have a constant percentage of participation in the auction throughout the selected period.
If you still need to “trade” shares of Q volume, and the “participation rate” in γ trading, the algorithm calculates the trading volume V traded in the period (t - ΔT, t) and executes orders for the number of financial instrument q = min (Q, V * γ).

V (t) = total trading volume, which took place on the market by the time t;
Q (t) = the number of shares that still need to be bought / sold (Q (0) = initial amount).
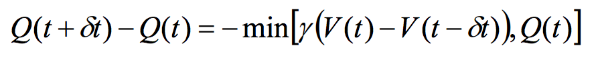

Eventually:

How else are the algorithms used?
In addition to executive strategies, there are a number of strategies aimed at extracting profit using other models. Here are some of them:
- Arbitration strategies are a subset of pair trading strategies that are based on an analysis of the price ratios of two highly correlated financial instruments. In the case of arbitrage, such a pair consists of the same or related assets, the correlation of which is close to one — for example, the shares of the same company on different exchanges. For successful trading in the framework of arbitration strategies, the speed of obtaining data and issuing / modifying buy or sell orders is critical.
- Providing liquidity (market-making) - market-making involves maintaining spreads for the purchase and sale of a financial instrument. Market makers are the main suppliers of instant liquidity, so the exchanges often attract them to work with illiquid instruments by providing preferential conditions.
- Price prediction - strategies that analyze various data (including using technical analysis indicators) to build hypotheses about which direction the price of a financial instrument can move in a given period of time.
Predicting prices in high frequency trading
In order to "predict" the price movement, the algorithm must simulate the hidden liquidity of the market given the liquidity of the bids to buy and sell. The "exhaustion" of the queue of applications for the purchase or sale may indicate an early price movement.
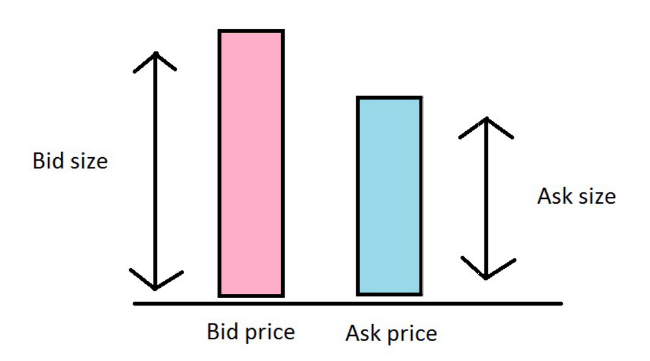
A price change occurs when at one of the price levels all orders for purchase or sale disappear, and there is the next level of bid and ask prices.
The probability that the queue of requests for an ask will be depleted earlier than the queue of requests for a bid is calculated as follows:
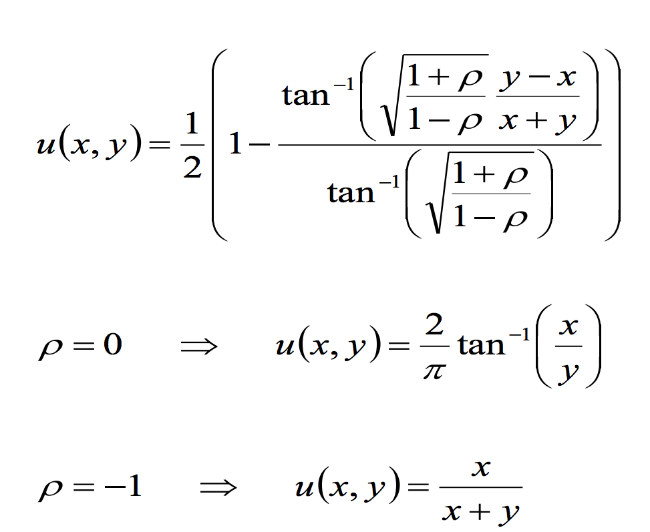
The final formula for the probability of price increase:
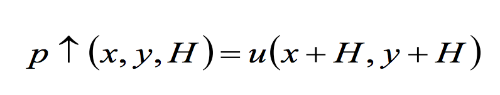
where H is the hidden liquidity of the market, that is, transactions that are unknown to the general public (for example, transactions of large financial organizations that are concluded outside the stock exchanges).
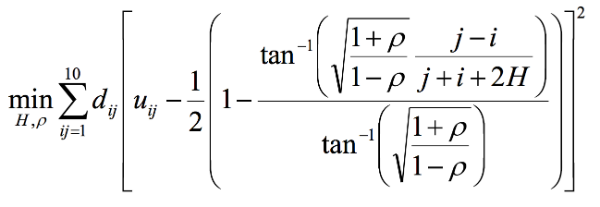
The evaluation procedure is as follows:
- At the first stage, the collected data is divided by exchanges, one trading day is analyzed at a time;
- Quotations of bid and asc values are arranged by deciles . For each such set (i, j), the frequency of the price increase u_ij is calculated.
- The number of occurrences of each d_ij value is counted.
- A model compliance analysis is performed using the least squares method :
Conclusion
On many stock exchanges (for example, in the USA and Russia), the turnover of algorithmic trading has been more than 50% for quite some time. At the same time, algorithms are often used not only to “outrun” competitors in the speed of transactions and earn money on it.
Large players can use this tool in order to break large transactions into smaller ones, which allow to carry out an operation with a specified amount of a financial instrument, without shifting its market price to one side or the other. For this, TWAP, VWAP and PoV algorithms are used.
In addition, algorithms are used to implement “quantum strategies”, such as arbitration or market-making. In addition, there are opportunities to calculate the probability of price changes for specific financial instruments.
That's all for today, thank you for your attention!
Other ITinvest articles on trading:
Source: https://habr.com/ru/post/271059/
All Articles