Power Query: steroids for MS Excel and Power BI
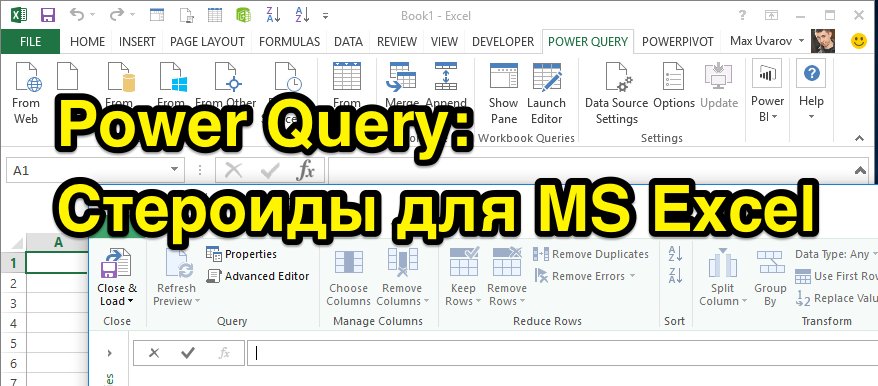
In this article I want to talk about some of the features of a free and extremely useful, but still little-known add-in over MS Excel called Power Query .
Power Query allows you to take data from various sources (such as csv, xls, json, text files, folders with these files, various databases, various api like Facebook opengraph, Google Analytics, Yandex.Metrica, CallTouch and much more) , create repeatable processing sequences for this data and load them into Excel tables or the data model itself.
')
And under the cut you can find the details of all this magnificence of possibilities.
Compatibility and technical details
Power Query is available for free for all versions of Windows Excel 2010, 2013 and is built in by default in Windows Excel 2016. For MacOS X users, Power Query is not available (however, even without this, Mac Excel is ugly and advanced users, including me, most often work with normal Excel through Parallels or running it on a remote Windows machine).
Also, Power Query is built into a new business intelligence product, Power BI , and it is also rumored that Power Query will also appear as part of other Microsoft products. Those. Power Query is waiting for a bright future and it's time for the followers of Microsoft technologies (and not only) to master its development.
How does it work
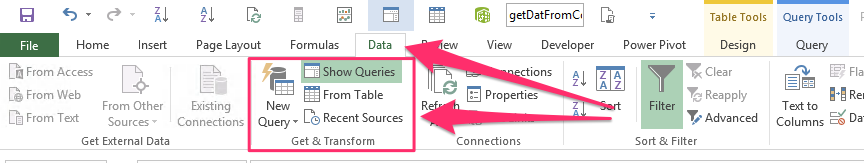
After installing Power Query, a separate tab of the same name appears in the Excel 2010–2013 interface.

In the new Excel 2016, the Power Query functionality is available on the Data tab, in the “Get & Transform” block.
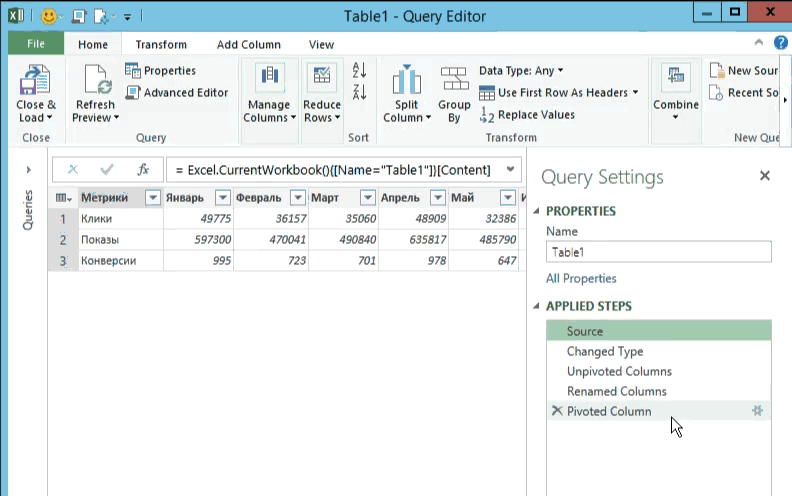
First, in the Excel interface, we select a specific data source, from where we need to get them, and the Power Query window itself opens with a preview of the first lines of the loaded data (area 1). In the upper part of the window is the Ribbon with data processing commands (area 2). And on the right side of the screen (area 3) we have a panel with a sequence of all actions that apply to the data.

Power Query Features
Power Query has a lot of features and I want to highlight some of my favorites.
As I wrote above, Power Query is remarkable in that it allows you to connect to a variety of data sources. So it allows you to download data from CSV, TXT, XML, json files. Moreover, the process of selecting download options for the same CSV files is more flexible and more convenient than it is implemented by standard Excel tools: the encoding is often selected correctly and the column separator character can be specified.
Combining files in a folder
Power Query is able to take data from the specified folder and merge their contents into single tables. This can be useful, for example, if you periodically receive some specialized reports for a specific period of time, but the data for analysis is needed in the general table. Gif
Text functions
For columns from text in Power Query, by clicking on the buttons on the Ribbon, you can use such functions as:
- Split a column by character or number of characters. And unlike Excel, you can specify the maximum number of columns, as well as the direction from where you need to count the characters - on the left, on the right.
- Change the register of cells in a column
- Count the number of characters in the column cells.
Numeric Functions
For columns with numeric values by clicking on the buttons on the Ribbon, you can apply:
- Arithmetic operations
- Erect to degree, calculate logarithms, factorials, roots
- Trigonometric operations
- Round to preset values
- Determine parity, etc.
Functions for working with dates, time and duration
For columns with date and time values by clicking on the buttons on the Ribbon, you can apply:
- Automatic determination of the format of the entered date (in excel c this is a big pain)
- Retrieve in one click the number of the month, day of the week, the number of days or hours in the period, etc.
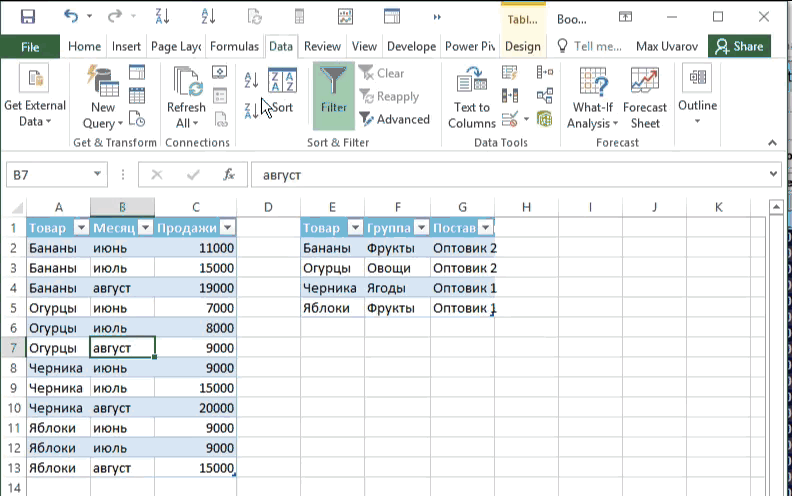
Unpivot - Pivot
In the Power Query interface, there is a “Unpivot” function, which in one click allows you to bring data with one metric laid out in columns in periods into a form that will be convenient for use in pivot tables (I understand that it is difficult to write - see an example). Also, there is a function with the reverse action of Pivot. Gif

Operation Merge - Death of WRT
The VLOOKUP function is one of the most used functions in MS Excel. It allows you to pull data into one table from another table using a single key. And just for this function in Power Query there is a much more convenient alternative - the operation Merge. With this operation, the connection of tables of several tables into one key (simple or composite key, when you need to find a match across several columns) is performed in just 7 mouse clicks without keyboard input.
The Merge operation is an analogue of join in sql, and it can be configured to join different types - Inner (default), Left Outer, Right Outer, Full Outer.
Upd. I was told here that Power Query doesn’t know how to do the Aproximate join, but it does. True, out of the box there are no alternatives. Gif
Connect to various databases. Query Folding.
Power Query is also remarkable for being able to cling to a wide variety of databases - from MS SQL and MySQL to Postgres and HP Vertica. At the same time, you do not even need to know SQL or another database language, because A preview of the data is displayed in the Power Query interface and all those operations that are performed in the interface are transparently translated into the database query language.
Power Query also has the concept of Query Folding: if you are connected to a compatible database (currently MS SQl), then Power Query will try to perform heavy data processing operations on the server side and take only processed data to itself. This feature drastically improves the speed of many treatments.
Programming language "M"
Power Query add-on is an interpreter of a new, scripted, specialized for working with data, M programming language.
For each action that we perform with the data in the Power Query GUI, we write a new line of code to the script. Reflecting this, in a panel with a sequence of actions (area 3), a new step is created with a talking name. Due to this, using the panel with a sequence of actions, we can always see how the data looks at us at each processing step, we can add new steps, change the settings of the applied operation at a specific step, change their order or delete unnecessary steps. Gif
Also, we can always see and edit the code of the written script itself. And it will look like this:
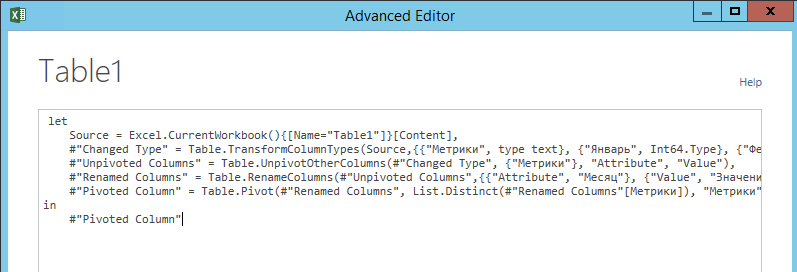
The M language, unfortunately, is not similar to the formula language in Excel or to MDX and, fortunately, is not similar to Visual Basic. However, it is very easy to learn and opens up tremendous possibilities for manipulating data that is not available using the graphical interface.
Downloading data from Yandex.Metrics, Google Analytics and other Api
Having mastered the “M” language a bit, I was able to write programs in Power Query that can connect to the Yandex.Metrics and Google Analytics API and take data from there with the specified settings. I put the PQYandexMetrika and PQGoogleAnalytics programs in the open source on the githab under the GPL license. I urge to use. And I will be very happy if these programs are updated by enthusiasts.
Google Analytics has quite a lot of such exporters in different implementations, but for Yandex.Metrica, as far as I know, my exporter was the first publicly available, and even free :)
Power Query can generate headers for post and get requests and retrieve data from the Internet. Because of this, with the proper level of skill, Power Query can be connected to almost any API. In particular, for my research, I jerk data on customer phone calls from the CallTouch API, from the Rescuetime computer monitoring service API, and parse the web pages I need to retrieve relevant information.
Once again about repeatability and about applications
As I wrote above, the Power Query script is a repeatable sequence of manipulations applied to the data. This means that once you have set up the processing you need, you can apply it to new files by changing just one step in the script - specifying the path to the new file. Thanks to this, you can get rid of a huge amount of routine and free up time for productive work - data analysis.
I do web analytics and contextual advertising. And it just so happened that since I met Power Query in its interfaces, I spend more time than in Excel itself. It's more comfortable for me. At the same time, my consumption of another great add-in in MS Excel, PowerPivot, has also increased.
Here are some of the tasks I do using Power Query:
- parse semantics for Fat projects,
- I make frequency dictionaries,
- I create web analytic dashboards and reports for analyzing specific cuts,
- Restoring the achievement of goals in web analytics systems, if they are not configured on the project,
- I smooth the prediction of probability with the methods of Andrey Belousov (+ Bayes :),
- I do an audit of contextual advertising on data from K50 statistics,
- And many other different ad-hoc analysis tasks that need to be done only once
Here is the bi system that I talked about on Yac / M 2015 ( video ) I did with full Power Query and loaded the data inside PowerPivot.
A few words about localization
On the Microsoft website for users from Russia, Power Query is downloaded by default with the interface translated into Russian. Fortunately, localizers did not get to the translation into Russian of the programming language (as it is done with the language of formulas in excel), however, the life of users with ambiguous translations made it very difficult. And I urge you to download, install and use the English version of Power Query. Believe me, it will be much clearer.
Related Links
Official resources in English:
- Download English version of Power Query
- M Formula Help
- Microsoft Technet Forum branch about Power Query
At the time of writing the article in Russian, there is practically no information on Power Query, and what I found is shown below:
- Import data from spreadsheets to Google Spreadsheets
- Power BI. Get data from REST API
- Advanced Excel, Power Pivot and Power Query Facebook Community
- Updated page in the Marketing-wiki about Power Query
In English:
- Video demonstrating Power Query features at TechEd North America
- Blog Chris Webb, perhaps the most complete resource with examples of using Power Query
- Book Chris Webb - Power Query for Power BI and Excel
- Ken Puls blog
- The course "Excel for Internet Marketing"
- Ken Puls and Miguel Escobar - M is for Data Monkey
Source: https://habr.com/ru/post/271019/
All Articles