Analysis of price changes in Russian online stores
In the last couple of years, I was quite interested in the issue of pricing in Russian online stores. Every time an online store declares a big discount, a doubt creeps into the soul ... Is there really such a big discount? Was the price really crossed out now?
Sharp changes in the dollar at the end of 2014. added fuel to the fire. I really wanted to get an answer to the question of how prices depend on the dollar in reality.
In the end, I decided to do away with these questions and collect a history of price changes in Russian online stores. According to the cut results of the work + some interesting patterns.
Some technical details
Currently, there are several dozens of parsers written in python in the system.
It seemed to me very wasteful to store data in the forehead, I decided to keep only price changes. If the price does not change - records in the database are not created, this approach saves resources very well. Currently, the table has only 200,000,000 rows, which is not so much for data on ~ 100,000 products in> 1,000 stores over 8 months.
MySQL 5.6 is used as storage. Recently, I had to move to SSD, since regular HDDs on Hetzner did not cope with the heavy load on the recording.
In this article I would like to describe the interesting patterns found in the analysis of the collected data:
1. Synchronous price change
Having collected the base for several months, I decided to analyze the correlation coefficient between the offers of the same product from different stores. For this, a python + pandas script was quickly scribbled. Pandas in this case greatly helped by the presence of the resample function.
')
sql = """ SELECT pr.date, pr.shopitemid, price from prices AS pr JOIN shopitems AS si ON pr.shopitemid = si.id WHERE si.itemid = 1 AND si.shopid > 10 AND si.last_price IS NOT NULL ORDER BY pr.date """ df = pd.read_sql_query(sql, engine) for item in df['shopitemid'].unique(): x= df[df['shopitemid'] == item] nans = x.isnull().sum()['price']/float(len(x)) if nans > 0.2 or len(x['price'].unique()) < 10 or \ x['date'].min() > (datetime.now() - relativedelta(months=3)): df = df.drop(df[df['shopitemid'] == item].index) df = df.dropna() df = df.pivot(index='date', columns='shopitemid', values='price') df = df.fillna(method='pad') df = df.dropna() df = df.resample('24h', fill_method='pad', how='last', loffset='24h') mtrx = df.as_matrix().T columns = df.columns.values corr = np.corrcoef(mtrx) z = np.where(corr > 0.90) for x,y in zip(z[0],z[1]): if x<y: print columns[x],columns[y] myplot(mtrx[x]) myplot(mtrx[y]) plt.show() Let us analyze the history of price changes on the example of the refrigerator Indesit SB 185.
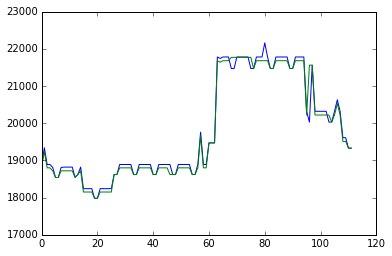
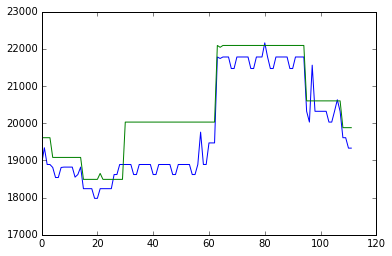
The output was quite interesting graphics such as:
More graphics

Here you can see this chart in a more convenient format.
In this example, it can be seen that the price of the three shops changes absolutely synchronously within 8 months. I see such probable reasons for this phenomenon:
- Two of the three use automatic pricing systems based on competitors' prices.
- Stores are somehow connected organizationally and have access to a common database of prices.
2. The emergence of a new smartphone.
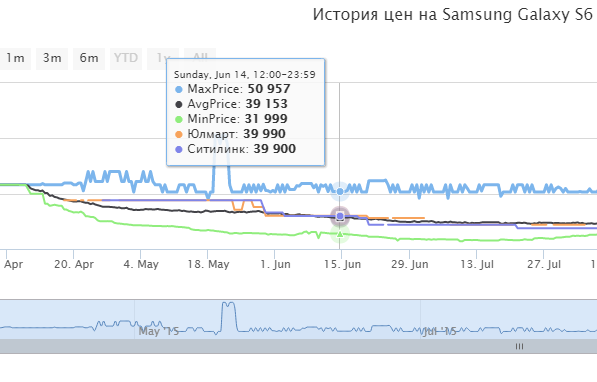
At the time of analysis, I came across a price chart for the Samsung Galaxy S6.

It seemed to me an interesting moment of the appearance of the phone.
First week: one or two sentences with a high price.
Further, within two months, the rest of the stores are gradually connected and the price range becomes significant.
3. Cheapest online shopping for each product category
Having collected a fairly large price base, the idea was to form the TOP 10 cheapest stores for each category of goods.
Let us analyze the principles of the formation of this list on the example of the Refrigerators category:
We run over each product category.
For each store selling this product, we award points from 0-expensive to 1-cheap.
Score calculation algorithm score = (maxprice-price) / (maxprice-minprice)
We calculate the average of the points scored by each store.
Remove stores selling very few products in this category.
For example, for the category of TVs, get the following list:
| Title | Number of points | Rating on Yandex.Market | Number of ratings on Yandex.Market |
| RED BUTTON | 0.877 | five | 697 |
| Toptel | 0,854 | five | 1358 |
| Pleer.ru | 0.853 | four | 52711 |
| Greenbook | 0.853 | five | 200 |
| CSO | 0.832 | five | 4009 |
| Technosteps.ru | 0.832 | five | 294 |
| Soundbreeze | 0.812 | five | 662 |
| ELECTROGOR | 0,808 | five | 6445 |
| DIGITAL | 0.805 | five | 460 |
| ELECTROSON | 0,804 | five | 1664 |
4. Why did I write all this?
As a feedback from a respected community, I would very much like to receive your ideas on the analysis of this dataset.
What else can you analyze, what interesting patterns to try to find?
To give everyone the opportunity to see the price history, especially soon Black Friday, I sketched out a simple web-face with the ability to search for goods. You can play here , I hope, will not fall.
UPD 12/01/2015: Added the ability to be notified when the price drops below a certain threshold.
Source: https://habr.com/ru/post/270895/
All Articles