How to use the Internet and modern technology people with visual impairment. Yandex research
Today, November 13, is the International Day of the Blind . It is dedicated to the birthday of the teacher Valentin Gayui , who, in 1784, opened the first school for blind children in his world with personal funds. This is not a holiday, but a memorable date, designed to remind society of the existence of a number of people with visual impairments. In the modern world, most of the lives of people moved to on-line, which opened up new opportunities for people with disabilities, but also gave rise to new challenges.
In order to work with computer devices and use the Internet, people with visual impairments use assistive technologies, which are actually their white cane in the digital space. However, the work of such users with computer equipment has its own specifics compared with ordinary sighted people. In particular, among them the most popular are other devices, operating systems and browsers, rather than in the market as a whole. This means that when thinking about the availability of their services for the blind, these features should be taken into account.
')
The problem is that information about the technical preferences of the blind and visually impaired is often simply not available. There are relevant studies of the English-speaking audience, but there is no such information on Runet. Therefore, we decided to conduct a study of technical preferences of users of Runet with visual impairments, the most important results of which we want to share with everyone.
For example, people with visual impairments are not so willing to abandon a personal computer in favor of mobile devices, among them a lot of Internet Explorer fans, and a large number of them have not forgotten what Symbian is, but at the same time, the proportion of iOS users among them higher than in the whole Runet, so that everything is not as simple as someone might have thought.
This study will help to find out the most common devices for users with visual impairments, operating systems, browsers, as well as assistive technologies that provide the ability to work with computer equipment. This information will be useful to technicians who are directly involved in adapting interfaces and testing their availability to identify preferred user configurations. In addition, the data will also be useful to product managers to most effectively prioritize the work on accessibility.
It is important to note that in the research process in a number of aspects significant differences in the specifics of the English-speaking and Russian-speaking audiences were identified, so this should be especially taken into account when supporting projects oriented to the Runet market.
In the period from May 15 to June 15, 2015, Yandex conducted a survey of people with visual impairments, designed to determine the interests and preferences of this category of users. During the month, 549 completed questionnaires were received. Given that, according to various estimates, the total number of Russian-speaking computer users with serious visual impairment (on the verge of total blindness) varies from 14 to 32 thousand people, there is reason to believe that the survey covers from 1.7% to 3.9% of the target audience that is sufficient to extrapolate the results of the study to the whole mass of such users.
The survey was already the second, but in 2015 the research methodology underwent major changes, so for most points a direct comparison of the results is impossible. In this regard, such a comparison was made only in respect of some points for which such an operation was recognized as correct.
Warnings and notes:
Compared to the study for 2014, there is a noticeable increase in the share of touchscreen smartphone users (from 56% to 66.5%), as well as a decrease in the share of push-button mobile phone users (from 33% to 25%). At the same time, the share of users of personal computers stably remains at the level of 97% and does not show any tendency to decrease.
In the “Other” category users indicated set-top boxes, players, and various specialized devices, such as Braille organizers.

The sum of shares that goes beyond 100% shows that some of the audience uses several operating systems for personal computers at once. Moreover, Linux-based systems are more common than OS X, which is a characteristic feature of the Russian-language market, since in similar studies in the English-language market, the share of Linux is much lower and loses to OS X.
In the “Other” category, individual respondents mistakenly recorded mobile operating systems, so in reality, some alternative platforms are practically not used.
Note: this question allowed only one answer.
The prevalence of the Firefox browser is also a characteristic feature of the Russian-language market, since similar studies of the English-speaking audience show the leadership of Internet Explorer. A possible explanation for this feature may be a slower update rate of the Windows system for Russian-speaking users, which forces the use of third-party browsers, since the built-in Internet Explorer is becoming outdated and is no longer supported by modern websites. Unfortunately, past research has shown that users themselves, as a rule, find it difficult to answer which version of software they have installed, therefore testing this hypothesis is difficult.
The high performance of Firefox as an additional browser is most likely due to the existence of Webvisum, a specialized plug-in that provides free automatic CAPTCHA recognition, which is extremely popular among blind users. As a result, even if Firefox is not used as the main browser, it is resorted to to help with CAPTCHA, since in most cases the test is graphical, and therefore inaccessible to blind people.
A significant increase in the share of Google Chrome and Yandex Browser as additional browsers, compared with their shares as the main ones, can be explained by the less perfect support of these browsers by screen readers. Apparently, users are interested in these browsers, but are not yet ready to use them as the main ones.
The sum of shares that goes beyond 100% shows that some of the audience uses several mobile operating systems at once. Most likely, most of them complement an outdated Symbian device with a modern Android or iOS device, using Symbian as a regular phone, and a modern smartphone for other multimedia tasks. The popularity of such a use case may be due to the continued commitment of many blind people to push-button devices to perform simple everyday tasks.
It should be noted that in the distribution of shares by mobile operating systems, there is a fundamental discrepancy with similar studies of the English-speaking market, in which iOS occupies more than two thirds, and Android only about one-fifth. Apparently, the high popularity of Android among Russian-speaking users with visual impairments, primarily due to economic factors.
6. What assistive technologies do you use during your work?
The sum of shares, going beyond 100%, shows that some users combine various assistive technologies. At the same time, the share of users working with screen zooming and image modification is probably much higher, however, these people often do not associate themselves with the community of people with disabilities, so only a small part of them was targeted.
Braille displays are extremely expensive devices, moreover, according to existing estimates, only about 10-15% of blind people have the skills to read Braille Braille, so the share of using tactile displays of 9.8% is actually quite large. Given the increase in the number of late blind people working with computers who rarely learn Braille, in the future we can even expect a drop in this indicator.

Note: this question allowed only one answer.
Considering that the named screen access programs are specific to specific operating systems, we can conclude that users with visual impairments primarily work in the Windows environment, and OS X and Linux are used as the main platform for significantly less (even less than their shares in the table). 2). Moreover, it can be stated that OS X, despite the smaller share in Table 2, is used as the main platform more often than Linux.
In the previous study, users were asked only one question, within which they could specify all the screen access programs that they use (without division into basic and additional). Then the survey showed that NVDA is used by 82.7% of users, and JAWS is only 77.9%. As part of the 2015 methodology, it was possible to reveal that JAWS is still more often used as the main screen access program, but NVDA is indeed familiar to a larger number of users, since summing up the respondents from tables 7 and 8 gives the same general advantage in favor of the free program NVDA.

In general, the ratio of screen access program shares, which are typical for specific platforms, is quite consistent with the distribution of shares for mobile operating systems from Table 5. Moreover, despite the relatively large number of screen access programs for Android, the absolute leader in the person of TalkBack stands out. At the same time, it is noticeable that Symbian users quite actively use two screen access programs at once.
As already noted, the Braille display is an extremely expensive device, and its price is directly dependent on the length of the line. The fact that the most common displays are of medium size indirectly indicates that the price is not the main factor when choosing such a device. It can be assumed that the majority of users of Braille displays are people to whom these devices were provided under government programs, under which average-size displays are purchased. This may mean that mainly blind people use displays in specially equipped workplaces, and not at home.
The huge bias towards the built-in functions of the screen magnification, apparently, is caused by quite low user requests for the functionality of such tools. This may mean that a substantial part of the advanced functionality that is provided by commercial third-party software is not claimed by a mass audience of visually impaired users.
Based on the results obtained, one can draw the following practically significant conclusions for developers, testers and project managers:
All this does not mean that less common operating systems and browsers should not be taken into account in ensuring accessibility. This only allows you to more effectively prioritize when adapting your products, but ideally, accessibility should be ensured for all possible user configurations.
A similar study of the English-speaking market of assistive technology for users with visual impairments has been conducted by the American company WebAIM since the end of 2008. Those interested in this question can familiarize themselves with all Screen Reader User Survey at the following links:
In order to work with computer devices and use the Internet, people with visual impairments use assistive technologies, which are actually their white cane in the digital space. However, the work of such users with computer equipment has its own specifics compared with ordinary sighted people. In particular, among them the most popular are other devices, operating systems and browsers, rather than in the market as a whole. This means that when thinking about the availability of their services for the blind, these features should be taken into account.
')
The problem is that information about the technical preferences of the blind and visually impaired is often simply not available. There are relevant studies of the English-speaking audience, but there is no such information on Runet. Therefore, we decided to conduct a study of technical preferences of users of Runet with visual impairments, the most important results of which we want to share with everyone.
For example, people with visual impairments are not so willing to abandon a personal computer in favor of mobile devices, among them a lot of Internet Explorer fans, and a large number of them have not forgotten what Symbian is, but at the same time, the proportion of iOS users among them higher than in the whole Runet, so that everything is not as simple as someone might have thought.
This study will help to find out the most common devices for users with visual impairments, operating systems, browsers, as well as assistive technologies that provide the ability to work with computer equipment. This information will be useful to technicians who are directly involved in adapting interfaces and testing their availability to identify preferred user configurations. In addition, the data will also be useful to product managers to most effectively prioritize the work on accessibility.
It is important to note that in the research process in a number of aspects significant differences in the specifics of the English-speaking and Russian-speaking audiences were identified, so this should be especially taken into account when supporting projects oriented to the Runet market.
Preliminary information
In the period from May 15 to June 15, 2015, Yandex conducted a survey of people with visual impairments, designed to determine the interests and preferences of this category of users. During the month, 549 completed questionnaires were received. Given that, according to various estimates, the total number of Russian-speaking computer users with serious visual impairment (on the verge of total blindness) varies from 14 to 32 thousand people, there is reason to believe that the survey covers from 1.7% to 3.9% of the target audience that is sufficient to extrapolate the results of the study to the whole mass of such users.
The survey was already the second, but in 2015 the research methodology underwent major changes, so for most points a direct comparison of the results is impossible. In this regard, such a comparison was made only in respect of some points for which such an operation was recognized as correct.
Warnings and notes:
- Most of the questions on the questionnaire allowed the possibility of specifying several answers, so the percentages in such points in the total are not equal to 100%. In addition, in questions that suggested only one answer, the amount of shares may slightly deviate from 100% due to rounding.
- The sum of all the answers to some questions may not coincide with the total number of respondents, since some questions were asked only with certain answers to previous ones.
- The study cannot represent all users with visual impairments, although during the survey a number of measures were taken to take into account the various structural features of the audience and eliminate abuses.
General technologies
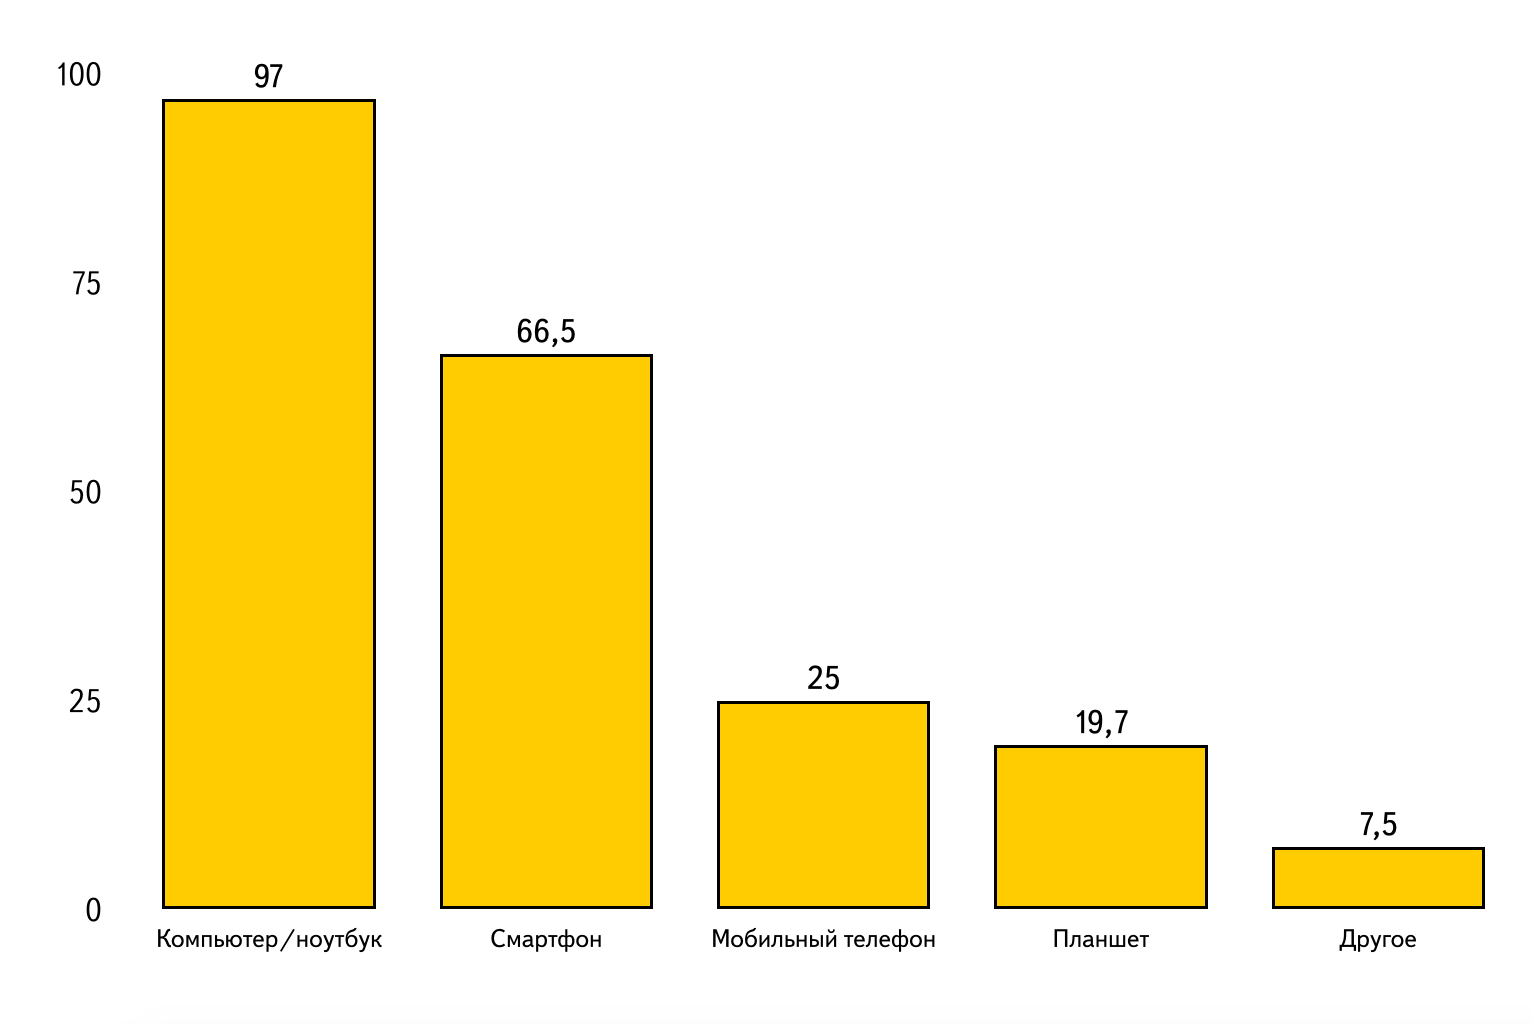
1. Which of the following devices do you use?
| Answer | Share | Respondents |
|---|---|---|
| Stationary computer / laptop | 97% | 531 |
| Smartphone with touchscreen display | 66.5% | 365 |
| Mobile phone | 25% | 138 |
| The tablet | 19.7% | 108 |
| Other | 7.5% | 41 |
Compared to the study for 2014, there is a noticeable increase in the share of touchscreen smartphone users (from 56% to 66.5%), as well as a decrease in the share of push-button mobile phone users (from 33% to 25%). At the same time, the share of users of personal computers stably remains at the level of 97% and does not show any tendency to decrease.
In the “Other” category users indicated set-top boxes, players, and various specialized devices, such as Braille organizers.
2. What operating system is installed on your computer / laptop?
| Answer | Share | Respondents |
|---|---|---|
| Windows | 97.3% | 473 |
| One of the Linux distributions | 6.8% | 33 |
| Mac OS | 5.6% | 27 |
| Other | 3.5% | 17 |
The sum of shares that goes beyond 100% shows that some of the audience uses several operating systems for personal computers at once. Moreover, Linux-based systems are more common than OS X, which is a characteristic feature of the Russian-language market, since in similar studies in the English-language market, the share of Linux is much lower and loses to OS X.
In the “Other” category, individual respondents mistakenly recorded mobile operating systems, so in reality, some alternative platforms are practically not used.
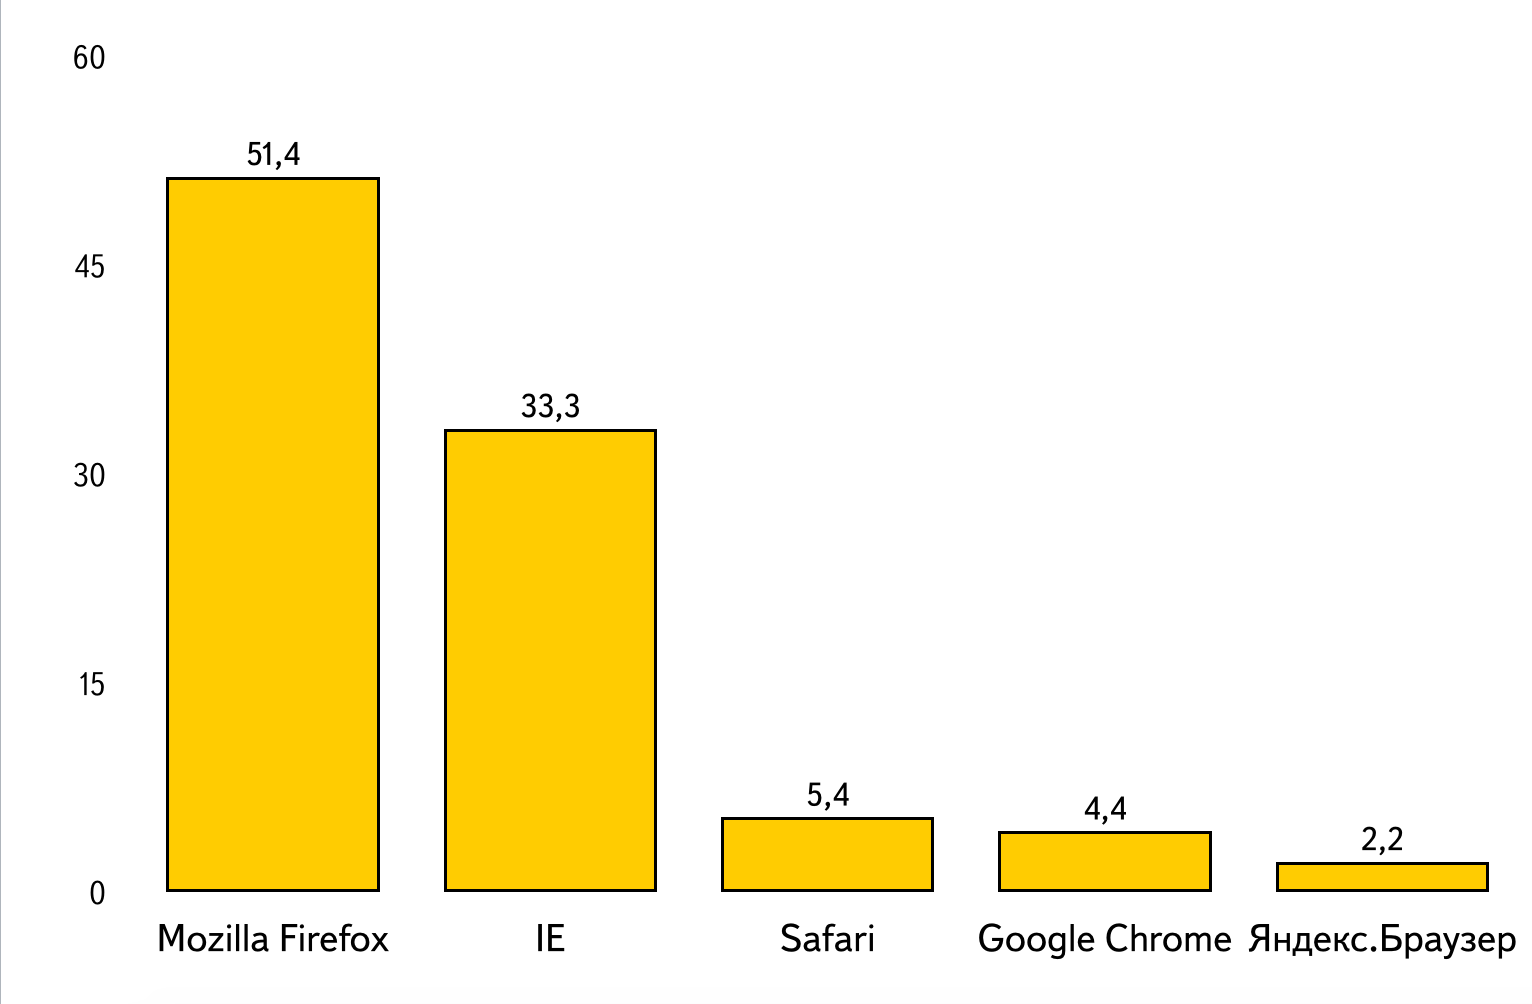
3. Which browser do you use as the main one and use it on your computer / laptop most often?
| Answer | Share | Respondents |
|---|---|---|
| Mozilla firefox | 51.4% | 256 |
| Internet Explorer | 33.3% | 166 |
| Safari | 5.4% | 27 |
| Google chrome | 4.4% | 22 |
| Yandex browser | 2.2% | eleven |
| Other | 3.2% | sixteen |
Note: this question allowed only one answer.
The prevalence of the Firefox browser is also a characteristic feature of the Russian-language market, since similar studies of the English-speaking audience show the leadership of Internet Explorer. A possible explanation for this feature may be a slower update rate of the Windows system for Russian-speaking users, which forces the use of third-party browsers, since the built-in Internet Explorer is becoming outdated and is no longer supported by modern websites. Unfortunately, past research has shown that users themselves, as a rule, find it difficult to answer which version of software they have installed, therefore testing this hypothesis is difficult.
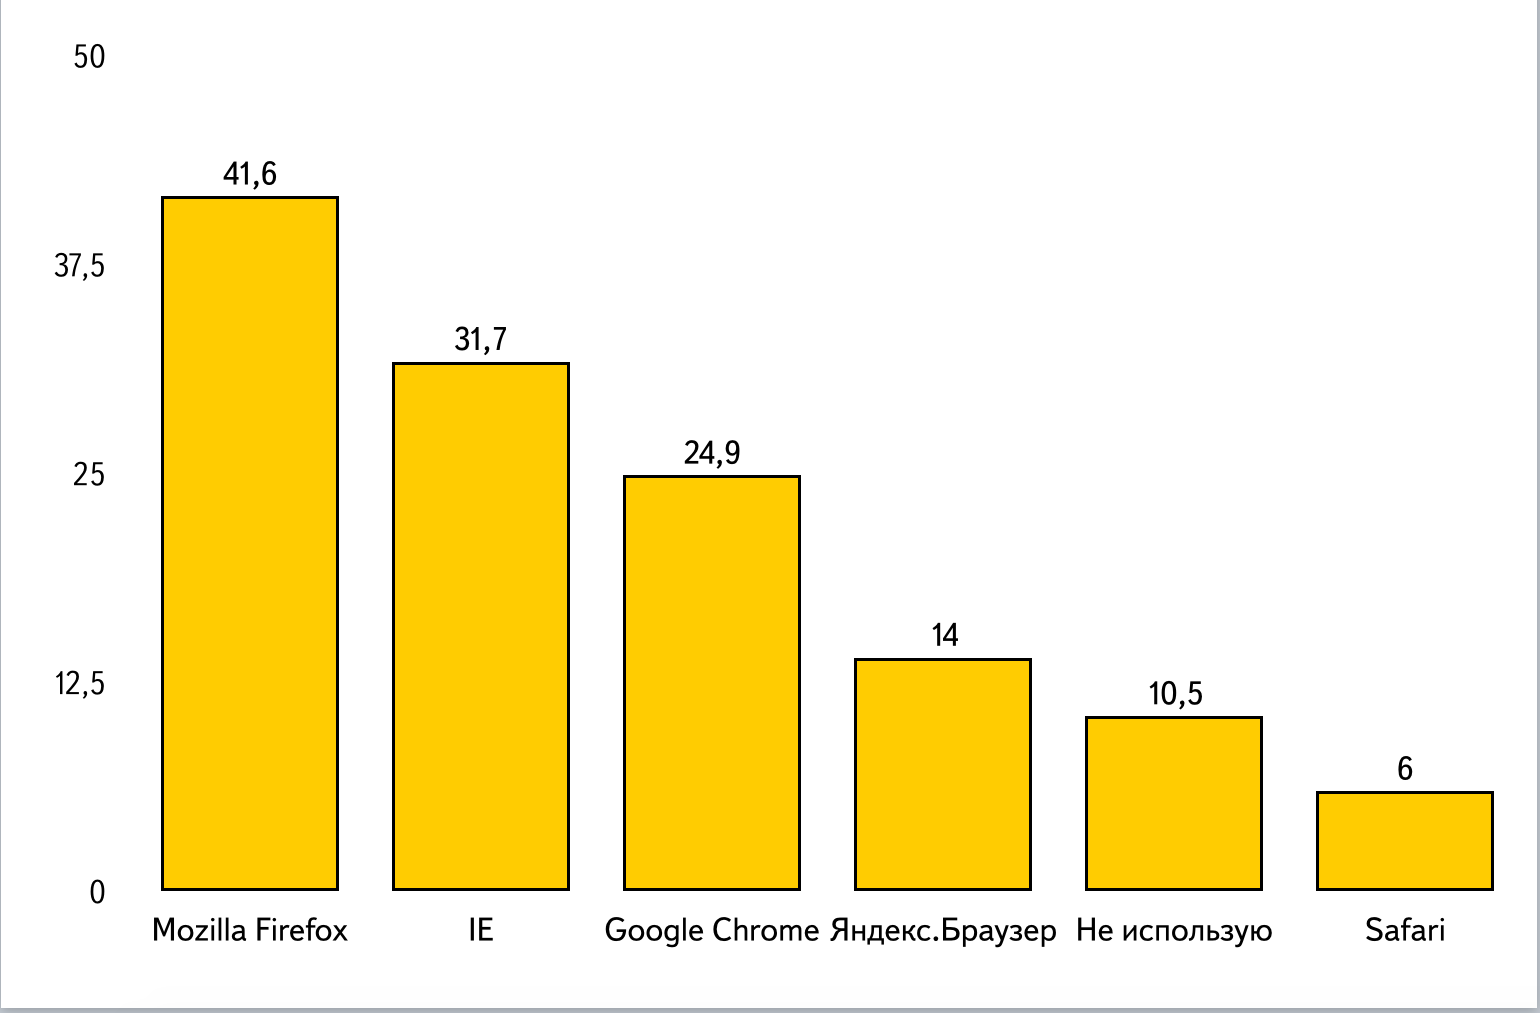
4. Which browser do you use as an auxiliary (optional)?
| Answer | Share | Respondents |
|---|---|---|
| Mozilla firefox | 41.6% | 214 |
| Internet Explorer | 31.7% | 163 |
| Google chrome | 24.9% | 128 |
| Yandex browser | 14% | 72 |
| I do not use an additional browser | 10.5% | 54 |
| Safari | 6% | 31 |
| Other | 3.7% | nineteen |
The high performance of Firefox as an additional browser is most likely due to the existence of Webvisum, a specialized plug-in that provides free automatic CAPTCHA recognition, which is extremely popular among blind users. As a result, even if Firefox is not used as the main browser, it is resorted to to help with CAPTCHA, since in most cases the test is graphical, and therefore inaccessible to blind people.
A significant increase in the share of Google Chrome and Yandex Browser as additional browsers, compared with their shares as the main ones, can be explained by the less perfect support of these browsers by screen readers. Apparently, users are interested in these browsers, but are not yet ready to use them as the main ones.
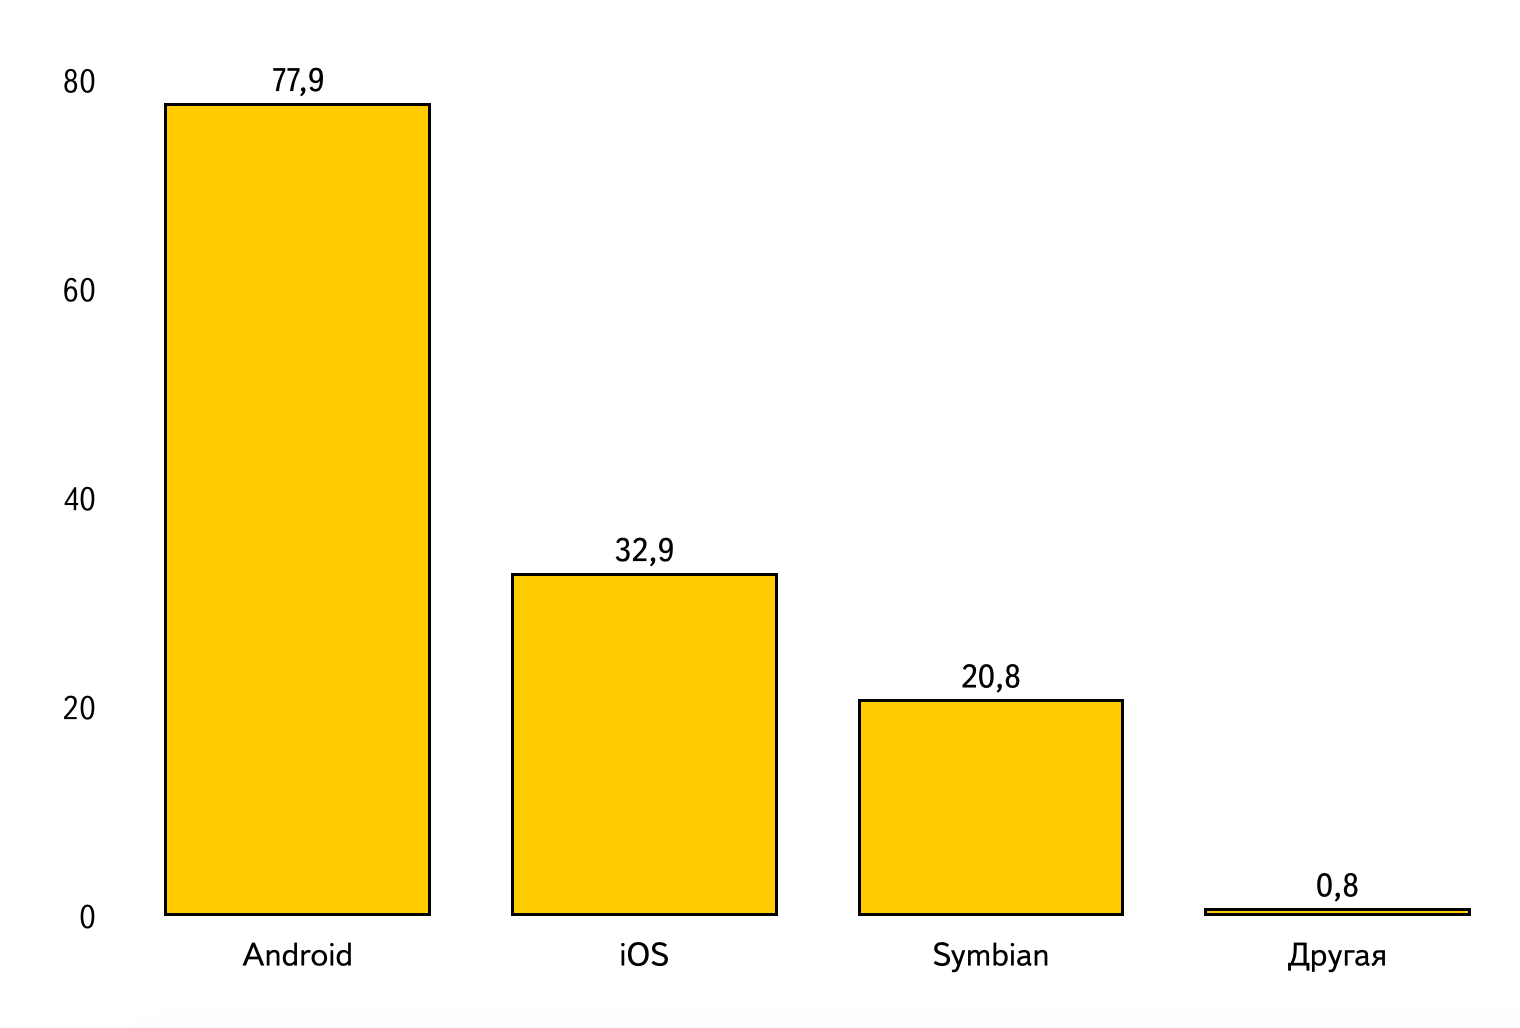
5. What operating system is installed on your tablet / phone?
| Answer | Share | Respondents |
|---|---|---|
| Android | 77.9% | 289 |
| iOS | 32.9% | 122 |
| Symbian | 20.8% | 77 |
| Other | 0.8% | four |
The sum of shares that goes beyond 100% shows that some of the audience uses several mobile operating systems at once. Most likely, most of them complement an outdated Symbian device with a modern Android or iOS device, using Symbian as a regular phone, and a modern smartphone for other multimedia tasks. The popularity of such a use case may be due to the continued commitment of many blind people to push-button devices to perform simple everyday tasks.
It should be noted that in the distribution of shares by mobile operating systems, there is a fundamental discrepancy with similar studies of the English-speaking market, in which iOS occupies more than two thirds, and Android only about one-fifth. Apparently, the high popularity of Android among Russian-speaking users with visual impairments, primarily due to economic factors.
Assistive technology
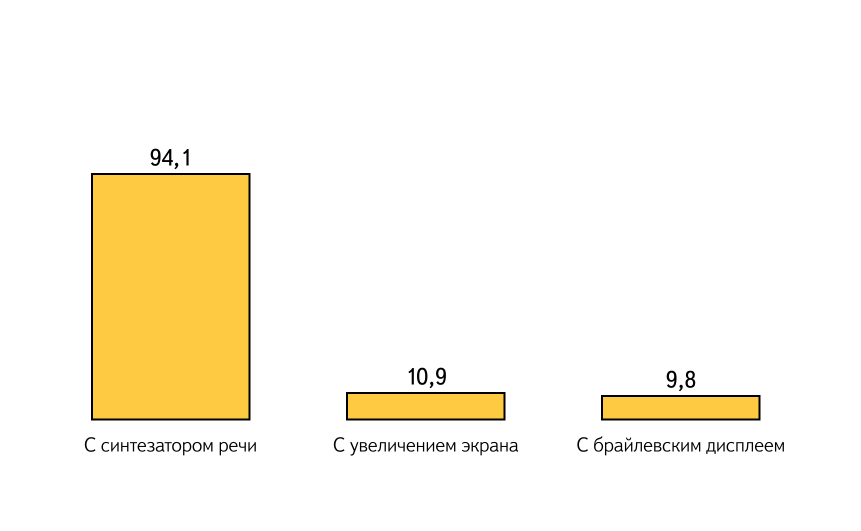
6. What assistive technologies do you use during your work?
| Answer | Share | Respondents |
|---|---|---|
| Speech synthesizer screen access program | 94.1% | 518 |
| Screen zoom and image correction program | 10.9% | 59 |
| Braille display access program | 9.8% | 54 |
| Other | 2% | eleven |
The sum of shares, going beyond 100%, shows that some users combine various assistive technologies. At the same time, the share of users working with screen zooming and image modification is probably much higher, however, these people often do not associate themselves with the community of people with disabilities, so only a small part of them was targeted.
Braille displays are extremely expensive devices, moreover, according to existing estimates, only about 10-15% of blind people have the skills to read Braille Braille, so the share of using tactile displays of 9.8% is actually quite large. Given the increase in the number of late blind people working with computers who rarely learn Braille, in the future we can even expect a drop in this indicator.
7. What screen access program do you use as the main one (you work with it most of the time) on your computer / laptop?
| Answer | Share | Respondents |
|---|---|---|
| JAWS for Windows | 52.5% | 251 |
| Nvda | 37.6% | 179 |
| VoiceOver for Mac Os | 4.6% | 22 |
| Orca | 1.1% | five |
| COBRA | 0.8% | four |
| Narrator (Narrator) | 0.6% | 3 |
| Other | 2.1% | ten |
Note: this question allowed only one answer.
Considering that the named screen access programs are specific to specific operating systems, we can conclude that users with visual impairments primarily work in the Windows environment, and OS X and Linux are used as the main platform for significantly less (even less than their shares in the table). 2). Moreover, it can be stated that OS X, despite the smaller share in Table 2, is used as the main platform more often than Linux.
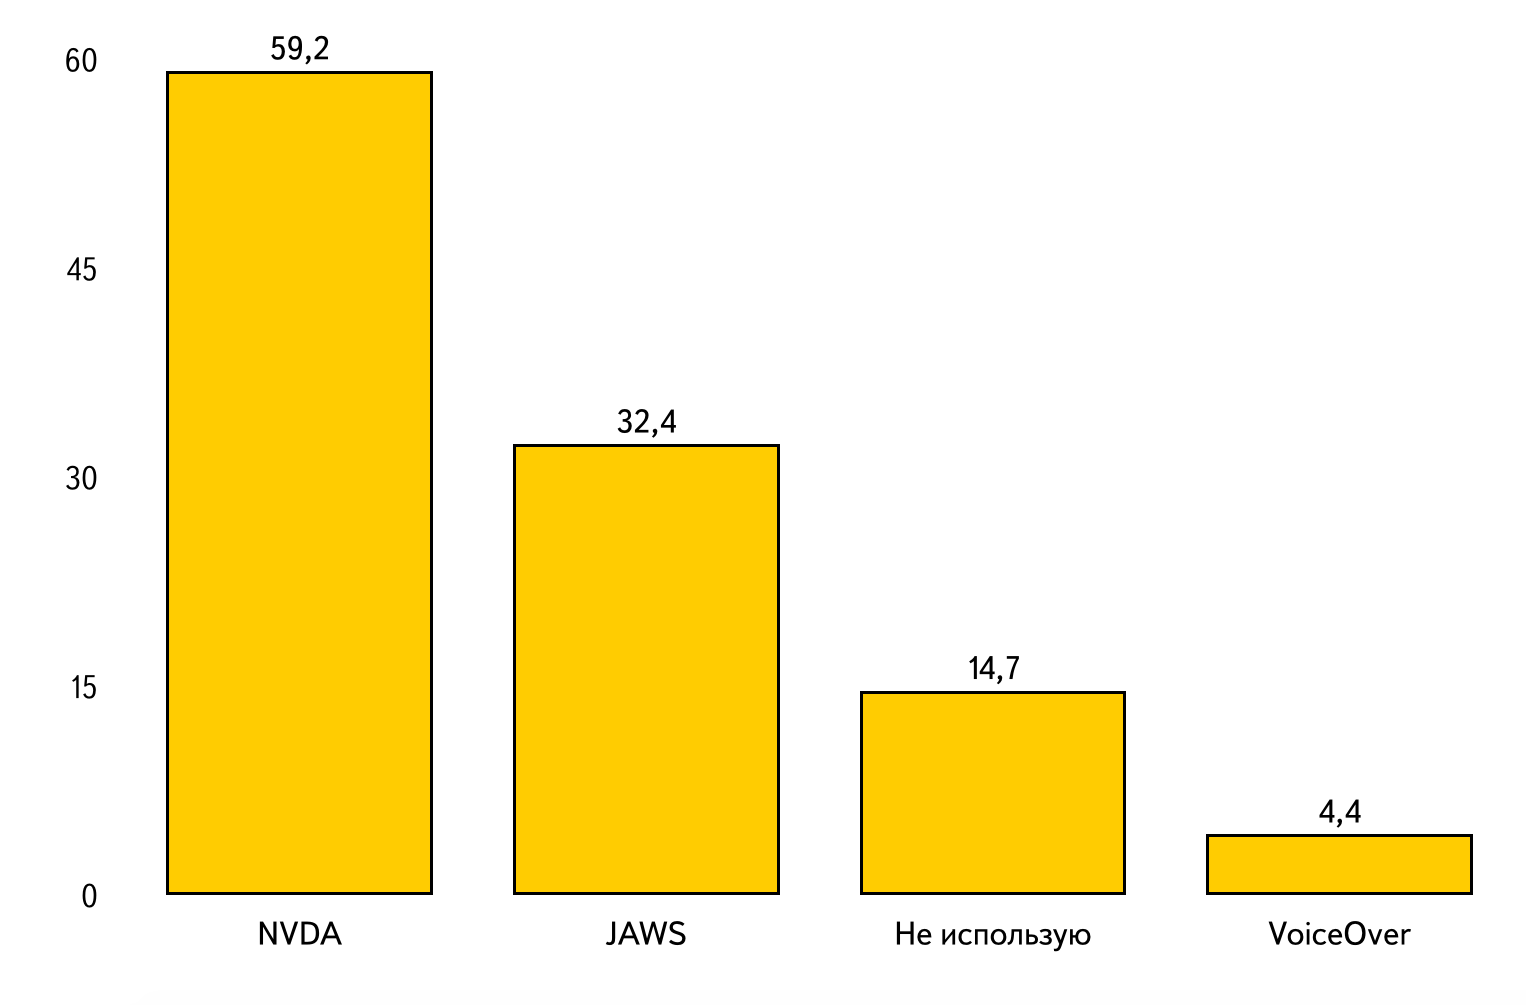
8. What other screen access programs do you use as additional on your computer / laptop?
| Answer | Share | Respondents |
|---|---|---|
| Nvda | 59.2% | 278 |
| JAWS for Windows | 32.4% | 152 |
| I do not use additional screen readers | 14.7% | 69 |
| VoiceOver for Mac Os | 4.4% | 21 |
| Narrator (Narrator) | 4.2% | 20 |
| Orca | 3.8% | 18 |
| Window-eyes | 2.1% | ten |
| COBRA | 0.9% | four |
| Other | 1.7% | eight |
In the previous study, users were asked only one question, within which they could specify all the screen access programs that they use (without division into basic and additional). Then the survey showed that NVDA is used by 82.7% of users, and JAWS is only 77.9%. As part of the 2015 methodology, it was possible to reveal that JAWS is still more often used as the main screen access program, but NVDA is indeed familiar to a larger number of users, since summing up the respondents from tables 7 and 8 gives the same general advantage in favor of the free program NVDA.
9. What screen access programs do you use on a tablet / phone?
| Answer | Share | Respondents |
|---|---|---|
| Talkback | 70.8% | 272 |
| VoiceOver for iOS | 31.7% | 122 |
| Mobile Speak for Symbian | 27.34% | 105 |
| Talk | eleven% | 43 |
| Mobile Accessibility for Android | 6% | 24 |
| Other | 2.9% | eleven |
In general, the ratio of screen access program shares, which are typical for specific platforms, is quite consistent with the distribution of shares for mobile operating systems from Table 5. Moreover, despite the relatively large number of screen access programs for Android, the absolute leader in the person of TalkBack stands out. At the same time, it is noticeable that Symbian users quite actively use two screen access programs at once.
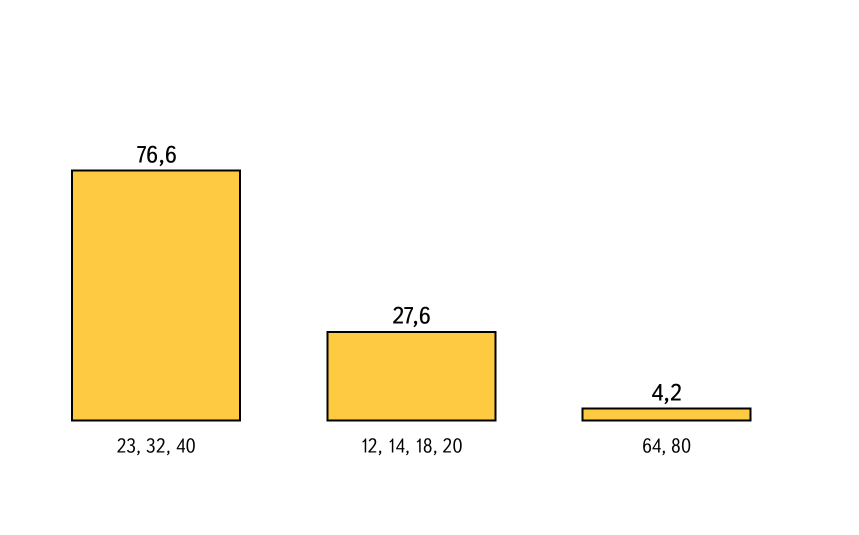
10. Braille displays from which long line do you use?
| Answer | Share | Respondents |
|---|---|---|
| 24, 32, 40 | 76.6% | 36 |
| 12, 14, 18, 20 | 27.6% | 13 |
| 64, 80 | 4.2% | 2 |
As already noted, the Braille display is an extremely expensive device, and its price is directly dependent on the length of the line. The fact that the most common displays are of medium size indirectly indicates that the price is not the main factor when choosing such a device. It can be assumed that the majority of users of Braille displays are people to whom these devices were provided under government programs, under which average-size displays are purchased. This may mean that mainly blind people use displays in specially equipped workplaces, and not at home.
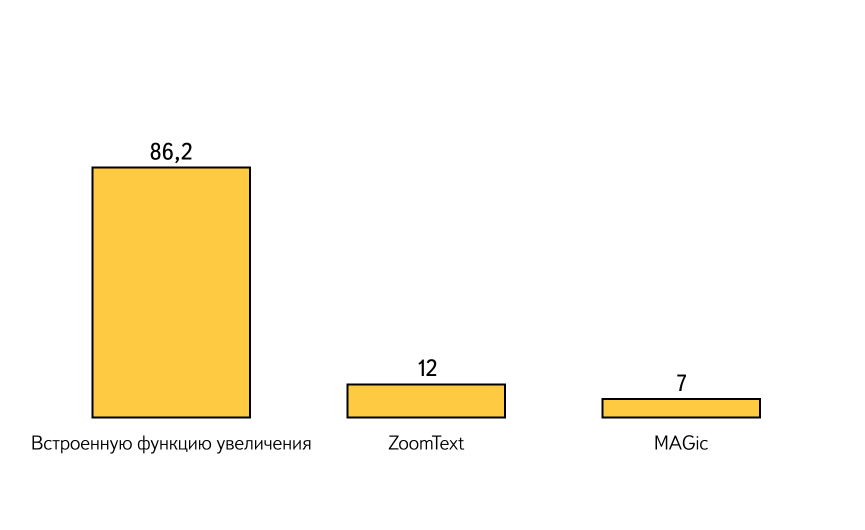
11. What screen zoom and image correction programs do you use?
| Answer | Share | Respondents |
|---|---|---|
| Built-in screen zoom function | 86.2% | 49 |
| ZoomText | 12% | 7 |
| MAGic | 7% | four |
| Other | 5.3% | 3 |
The huge bias towards the built-in functions of the screen magnification, apparently, is caused by quite low user requests for the functionality of such tools. This may mean that a substantial part of the advanced functionality that is provided by commercial third-party software is not claimed by a mass audience of visually impaired users.
Final conclusions
Based on the results obtained, one can draw the following practically significant conclusions for developers, testers and project managers:
- The main priority in ensuring the availability of applications should be given to Windows and Android. It is these platforms that have the highest concentration of visually impaired Russian-speaking users. Nevertheless, the share of iOS is also quite significant, so it’s still not worth delaying the relevant work in this direction.
- The vast majority of the audience of blind users works on PCs with screen access programs JAWS and NVDA , as well as Firefox and Internet Explorer browsers, which determines the existence of four main user configurations that should be focused on when testing accessibility. It makes sense to include the rest of the user configurations in the testing process at the final stages, and leave the least common ones at the mercy of feedback.
- On mobile operating systems, there is one dominant screen access program: TalkBack on Android and VoiceOver on iOS. That is, when testing, it makes sense to focus on these assistive technologies. Nevertheless, in the foreseeable future, we can expect the popularity of the recently appeared ShinePlus program for Android (Russified only on October 1, 2015), however, in the absence of advanced expertise on accessibility, it does not make sense to spray in this direction.
- When testing the availability of interfaces for the visually impaired, you should first use the built-in screen modification tools, as this is the most common technology.
All this does not mean that less common operating systems and browsers should not be taken into account in ensuring accessibility. This only allows you to more effectively prioritize when adapting your products, but ideally, accessibility should be ensured for all possible user configurations.
English Market Research
A similar study of the English-speaking market of assistive technology for users with visual impairments has been conducted by the American company WebAIM since the end of 2008. Those interested in this question can familiarize themselves with all Screen Reader User Survey at the following links:
Source: https://habr.com/ru/post/270775/
All Articles