Analysis of shopping carts in retail
Task No. 1 for a retailer is to understand who exactly makes purchases in a store, study the behavior of customers, identify typical models, and with the help of this knowledge, influence the quantity and quality of purchases.
The solution is possible using such approaches:
Paraphrasing the second approach - what goods did the buyer put in his basket?
Market Basket Analysis is a set of analytical approaches for understanding customer behavior, product selection, identifying associations and relationships between products on each check, and the likelihood of purchasing goods together.
')
For the analysis data from checks of a trading network are used:
There is an identification of typical shopping baskets and actions, with reference to dates, days of the week, time of purchase, cost of checks.
The retailer, using this information, answers many questions, for example:
There is a large selection of algorithms for basket analysis, from the main ones we single out Apriori, Eclat, FP-growth. We will dwell on the analysis of possibilities and the difference of algorithms in the following publications.
Each of the algorithms from the totality of checks identifies association rules (recurring relationships between the goods in the baskets).
When analyzing shopping carts and determining the relationship between products, the association rules are as follows:
“If the buyer buys item X, then with a certain probability he buys item Y.”
The source data for the association rule:
X and Y - 2 products, categories or product groups.
X - is defined as the key product, the reason;
Y - accompanying goods, consequence.
For an example of using the Associative Rules, take 10 checks with 4 such goods: Milk, Bread, Fish, Eggs:
Using this data we will accept and consider the rule:
“If they buy Milk and Bread (X), then they will buy Eggs (Y)”.
The probability of purchase is determined using the following calculations:
Support (Support) - calculated for a single product / pair, shows the ratio of the number of checks with the selected product / pair and the total number of checks.
The combination of 3 selected products of Bread Milk and Eggs in one check means:
Support X = number of checks for Milk and Bread / total number of checks = 2/10 = 0.2
Support X and Y = number of checks in which X and Y are found / total number of checks = 1/10 = 0.1
Support shows the effect of the selected rule on all purchases that are analyzed. The larger the indicator, the more often the rule works for the general data set.
Confidence - shows the ratio of checks X and Y to the number of checks in which they buy only the reason - X.
Those. What is the likelihood that if Milk and Bread are already in the shopping cart, he will also buy Eggs.
Confidence = support X and Y / support X = 0.1 / 0.2 = 0.5
In our case, this is a 50% chance, because of the two checks with Milk and Bread, one contains also Eggs.
When analyzing pairs of goods, we also use the correlation coefficient . It determines how similar the sales of two products are.
There are 3 options for the correlation of sales of goods:
Analysis of shopping carts provides information on the combination of products in typical baskets. But, often this information is too obvious or already known to the retailer based on its experience or the popularity of the goods. The definition of implicit links between products will be important in the analysis of baskets.
For this BI Datawiz.io allows you to filter shopping carts by periods, days of the week and time intervals . Identify typical baskets on weekdays and weekends, in different seasons, periods before holidays, i.e. purposefully structure checks for given parameters.
Filtering at the cost of checks allows you to determine the typical baskets of different price categories, for example, what goods fall into checks from 30 to 50 UAH., From 500 to 1 thousand UAH.
Another aspect is the analysis of shopping carts by categorization levels .
Categorization is the distribution of goods in different product groups. For example, “Milk and dairy products” is a top-level category, it is divided into subcategories - dairy and fermented milk products. Fermented milk products are divided into yoghurts, kefir, ryazhenka, etc. different brands and brands. The lower level of categorization is the specific name of the product.
The service allows you to analyze typical baskets for different levels of categorization. For example, at the top level of categorization they buy low alcohol drinks with cigarettes, snacks, etc.
Brand analysis provides data on the entry of brands into typical baskets. So, they buy Obolon beer with Lyuks chips, and Lvovskoye beer from Lays.
Analysis of items in typical baskets allows you to determine the specific features of consumer behavior. For example, the purchase of 250g yogurt “Molokia” 1.2% and rolls with cottage cheese - lunch office worker.
Interesting results are obtained by analyzing the combination of specific products with brands or categories. It affects the purchasing habits of customers, advertising, to some extent, even public opinion and traditions.
The combination of several types of filtering in the analysis of shopping carts makes it possible to structure the information on online purchases that a retailer needs, to properly target promotional activities, and as a result, to increase profits.
The location of goods on the trading floor, promotions, the appearance of goods on the shelves and other factors affect the entry of goods into the basket.
This should be taken into account using and using the results of the analysis to eliminate erroneous data. For example, the goods that are placed near the cash register are bought because they caught the eye while the person was standing in line, therefore it is not logical to use pairs with such goods for analysis.
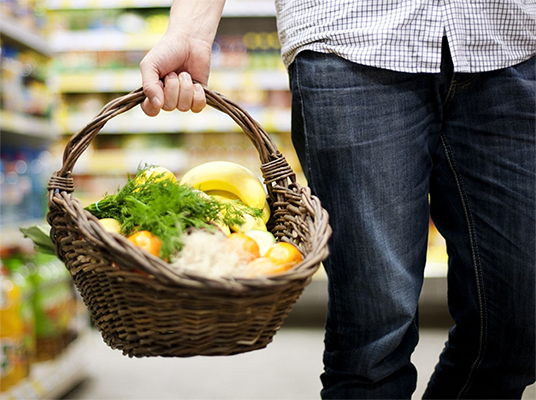
We will analyze alcohol sales in the supermarket chain using the BI Datawiz.io service.
The task is to identify typical baskets with alcohol, identify other products in these baskets, the optimal time for sales of a particular type and brands of alcohol.
For the analysis of the alcohol group we start with the following indicators:
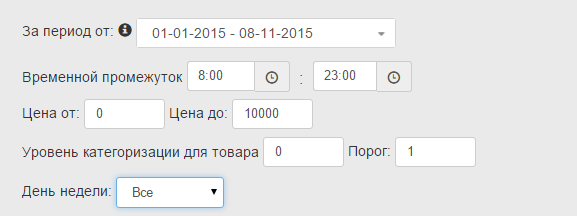
The period is the current year.
The time period is according to the shop opening hours from 8 am to 11 pm
The cost of the basket is not limited.
The threshold is 1%; it eliminates pairs of goods with the support of less than one percent.
Level of categorization for the product of the investigation - 0.
All days of the week.
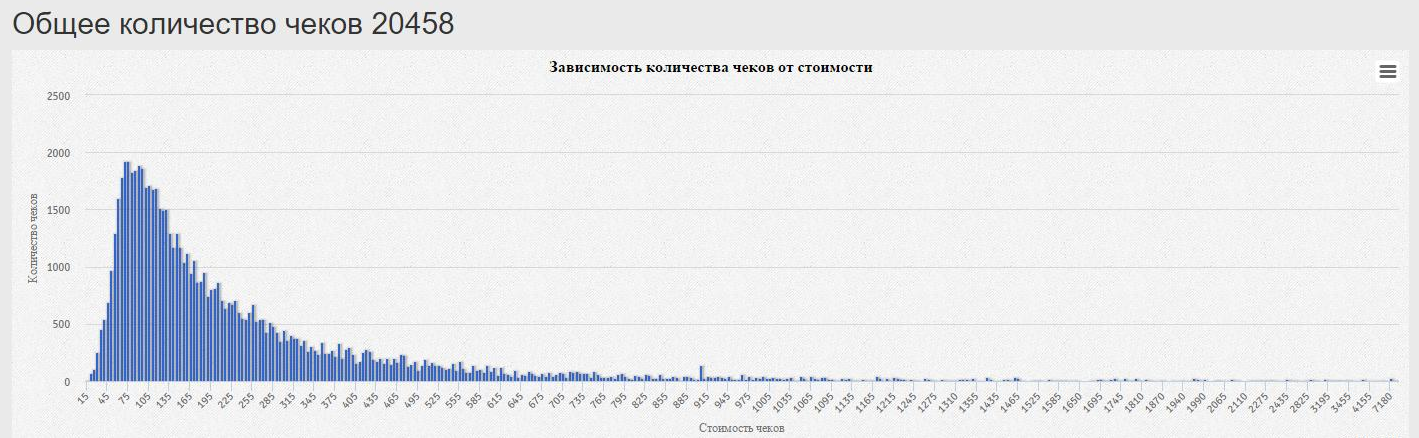
As you can see, for the current year of checks with alcohol was 20458.
The graph shows the distribution of checks with alcohol at a cost with an interval of 5 UAH .:
The largest number of checks 1922 - with the cost of 75 hryvnia.
The main number of checks with alcohol falls into the price category from 50 to 200 UAH.
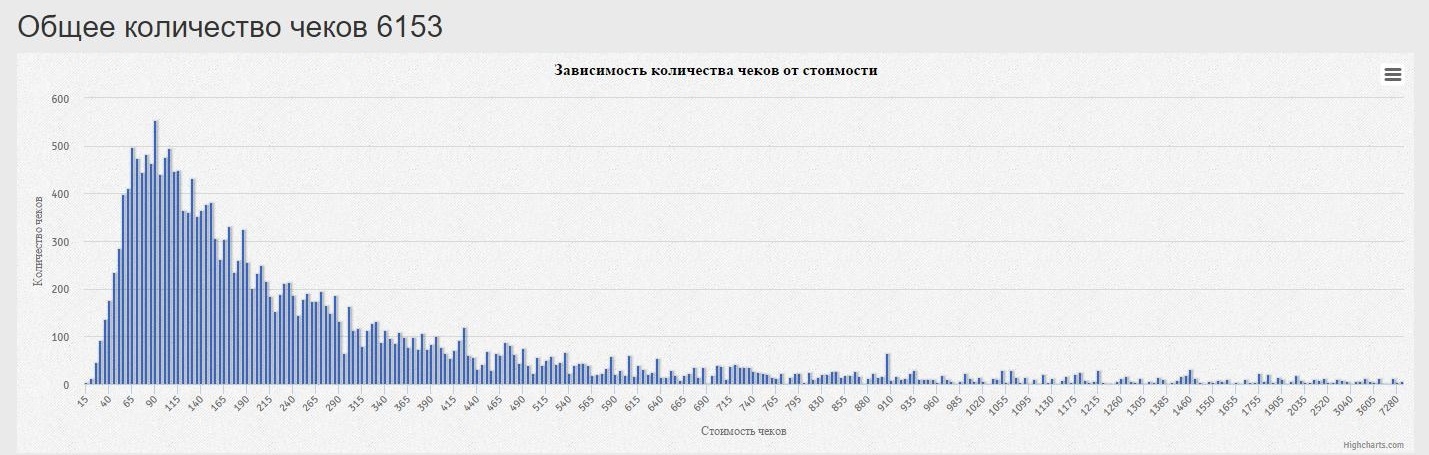
Shopping time
What time does the store buy the most alcohol?
Let's analyze the number of purchases in 3 selected time intervals:
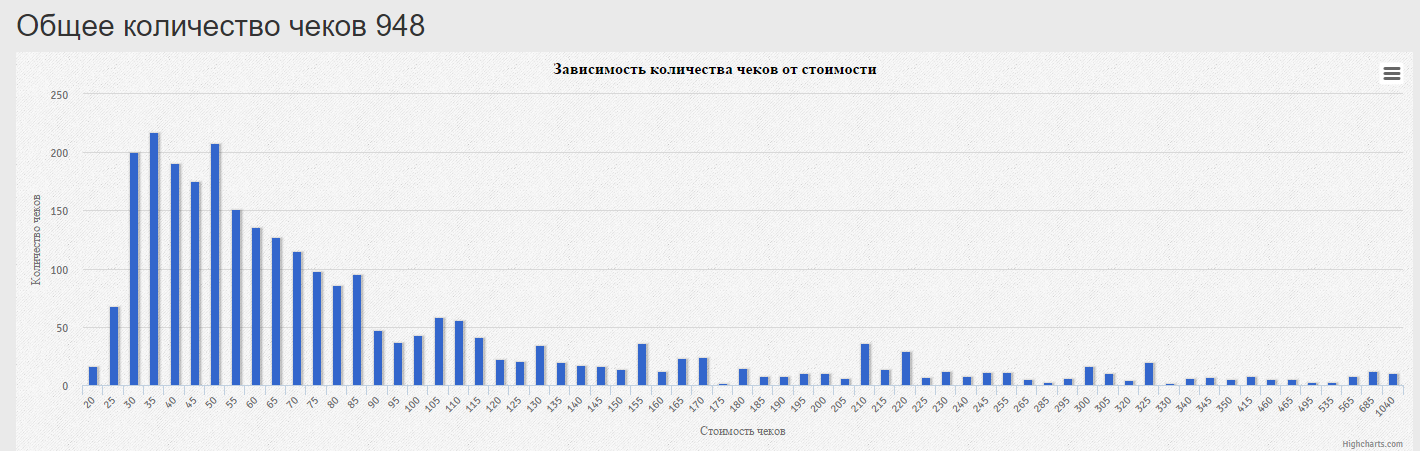
In the morning from 8 to 13 hours in the trading network - 6153 checks with Alcohol.
Price category (as seen on the chart) from 50 to 170 UAH.
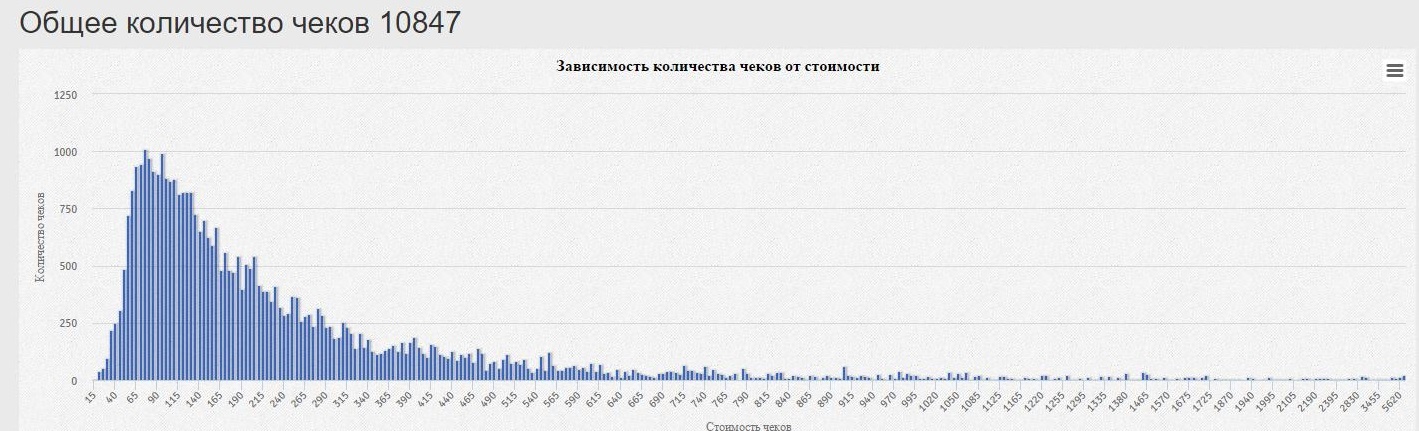
The second time interval from 13 to 18 hours - 10847 checks. Price category from 45-255 hryvnia.
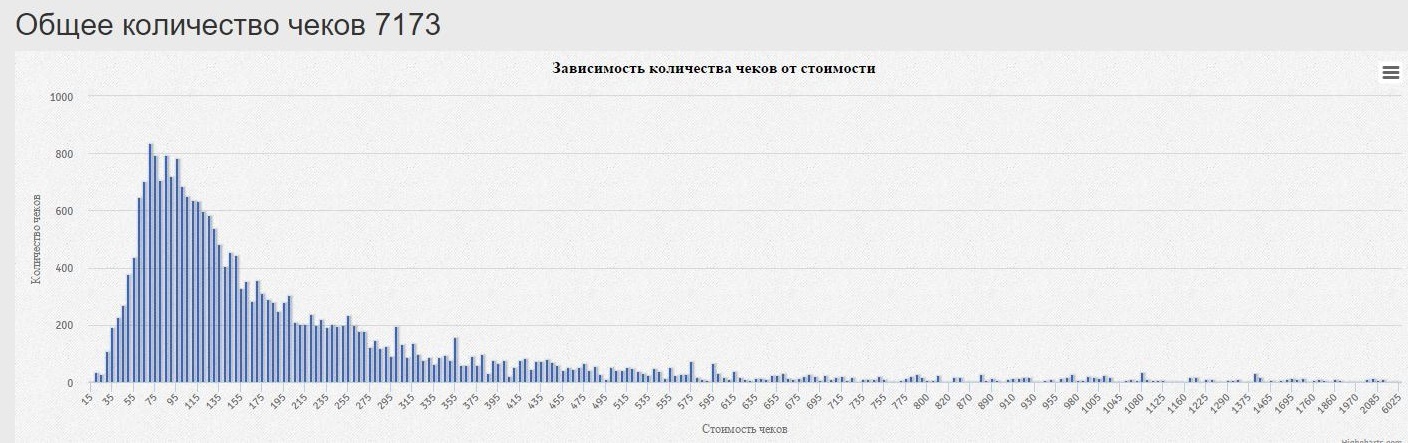
After work hours from 18 to 23 hours - only 7173 checks. Price category - 40-170 UAH.
Conclusions: it would seem, strong alcohol would have to buy more in the evenings after work, but not here. The maximum number of purchases is at lunchtime, at the same time the cost of typical baskets is the highest.
Related Products
Products associated with alcohol are quite predictable. The most popular cigarettes, beer, low alcohol drinks, water.
Let's try to narrow the search by setting filters on Frankivka Gorka vodka, Saturday morning.
The use of the Categorization Level parameter for the product of a consequence makes it possible to analyze pairs of products for different levels of categories. Get information about what brands, categories buy with a particular product. To do this, you just need to set the desired level of categorization.
In this case, we use the third level of categorization and determine which categories of products are purchased with a specific vodka brand.
The most popular checks - up to 100 UAH.
Associated goods to “Frankivska Gorkіlka” on Saturday morning pasta and cereals, beer, canned fish.
We would call these baskets - “Breakfast Bachelor”.
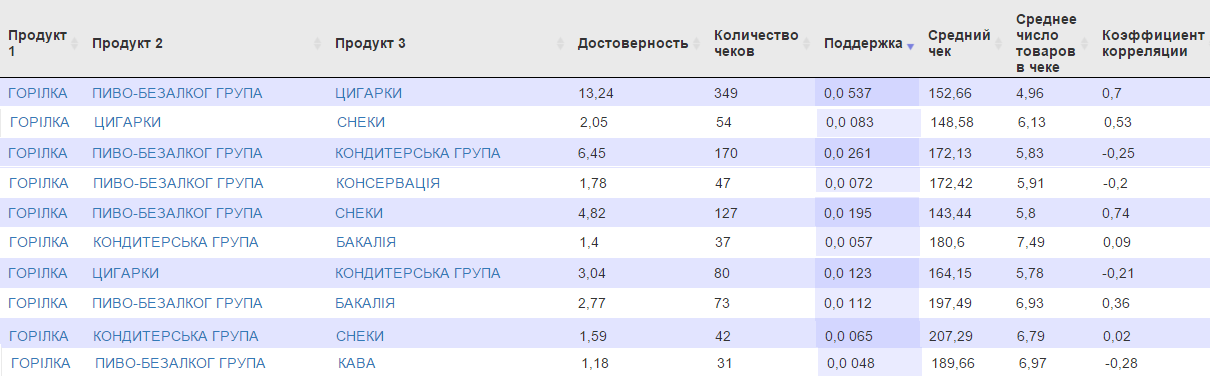
Let's look at typical baskets with vodka on Saturday and Friday evenings, this includes more expensive brands, and other types of alcohol, cigarettes, confectionery, sweet water and energetics are in pairs with them.
The picture below shows combinations of three products in such typical baskets.
Basket cost
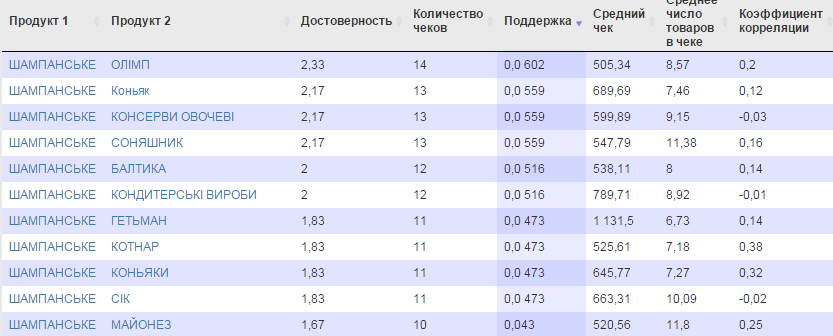
Analyze checks from 200 UAH. where champagne goes.
As can be seen in the picture, typical baskets from 200 UAH. with champagne include several types of alcohol, i.e. Most likely these are purchases for family celebrations and gatherings.
Although a couple of items of champagne and seeds are baffling to us.
Shopping for the holidays
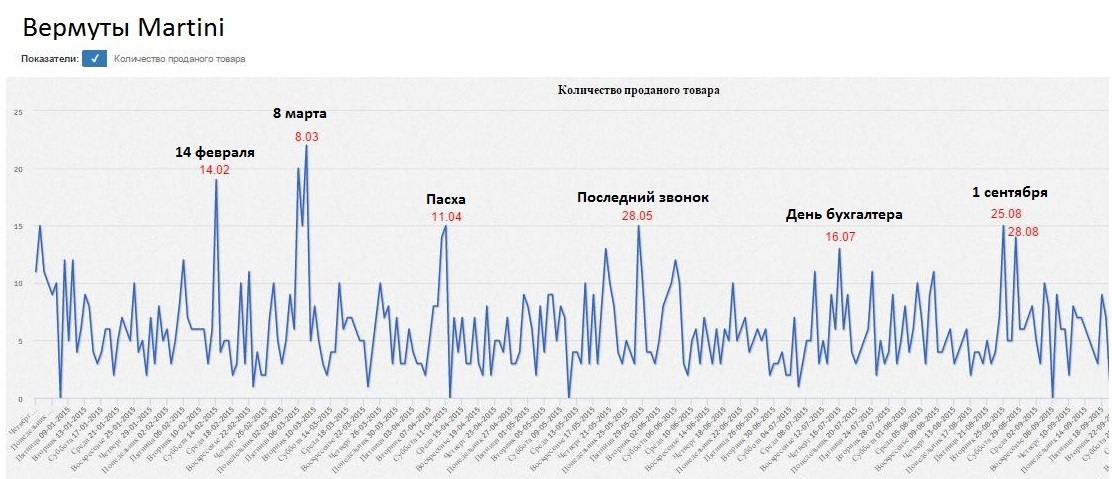
The easiest way to illustrate the cyclical shopping for the holidays is with the example of vermouths.
Initially, vermouth - ladies drink, and as the sales schedule shows, it is also a festive drink.
At the third level of categorization, couples with vermouths get such goods as expensive candy boxes, confectionery, other alcohol, sweet water. Again, this is a shopping for a feast.
In order to analyze which brands buy vermouths use other levels of categorization.
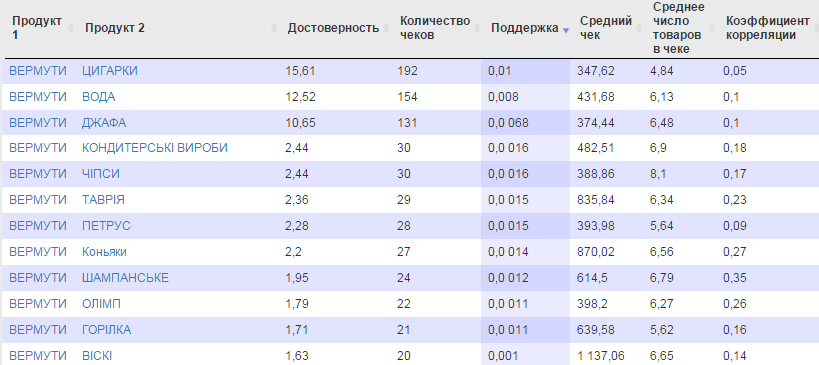
At level 5 categorization, we obtain the results as in the picture below.
As you can see, vermouths are buying with specific brands:
Such information significantly helps the retailer to properly target promotional activities.
What else is interesting, almost any strong alcohol our buyer takes with one of the types of cola.
Cola with strong drinks gives a high correlation.
Couples of goods and dependences can be clearly seen on sales graphs.
The sales of cola are highlighted in blue, the sales of alcohol in yellow, the sales of a pair of goods in red.
Cola and alcohol sales graphs are similar. Promotions for the sale of any strong alcohol and cola will always be successful.
Analysis of shopping carts is an important component of working with data in retail. BI Datawiz.io allows you to fully analyze all available information about purchases in the trading network.
Are your checks still dead weight?
The solution is possible using such approaches:
- analysis of data from loyalty programs and other forms of studying persons and customer behavior;
- analysis of data on purchases and transactions.
Paraphrasing the second approach - what goods did the buyer put in his basket?
Market Basket Analysis is a set of analytical approaches for understanding customer behavior, product selection, identifying associations and relationships between products on each check, and the likelihood of purchasing goods together.
')
For the analysis data from checks of a trading network are used:
- the list of goods that are included in the check;
- date of purchase;
- purchase time;
- check cost
There is an identification of typical shopping baskets and actions, with reference to dates, days of the week, time of purchase, cost of checks.
The retailer, using this information, answers many questions, for example:
- What to buy on Friday night?
- What typical baskets are on a Saturday morning?
- What buy strong alcohol?
- What products fall into the basket from 200 UAH.?
- What brands are included in Martini vermouth checks?
There is a large selection of algorithms for basket analysis, from the main ones we single out Apriori, Eclat, FP-growth. We will dwell on the analysis of possibilities and the difference of algorithms in the following publications.
Each of the algorithms from the totality of checks identifies association rules (recurring relationships between the goods in the baskets).
When analyzing shopping carts and determining the relationship between products, the association rules are as follows:
“If the buyer buys item X, then with a certain probability he buys item Y.”
The source data for the association rule:
X and Y - 2 products, categories or product groups.
X - is defined as the key product, the reason;
Y - accompanying goods, consequence.
For an example of using the Associative Rules, take 10 checks with 4 such goods: Milk, Bread, Fish, Eggs:
- milk, bread;
- bread;
- a fish;
- milk, bread, eggs;
- bread, eggs, fish;
- eggs, fish;
- bread;
- milk, fish;
- milk, fish;
- eggs, fish.
Using this data we will accept and consider the rule:
“If they buy Milk and Bread (X), then they will buy Eggs (Y)”.
The probability of purchase is determined using the following calculations:
Support (Support) - calculated for a single product / pair, shows the ratio of the number of checks with the selected product / pair and the total number of checks.
The combination of 3 selected products of Bread Milk and Eggs in one check means:
Support X = number of checks for Milk and Bread / total number of checks = 2/10 = 0.2
Support X and Y = number of checks in which X and Y are found / total number of checks = 1/10 = 0.1
Support shows the effect of the selected rule on all purchases that are analyzed. The larger the indicator, the more often the rule works for the general data set.
Confidence - shows the ratio of checks X and Y to the number of checks in which they buy only the reason - X.
Those. What is the likelihood that if Milk and Bread are already in the shopping cart, he will also buy Eggs.
Confidence = support X and Y / support X = 0.1 / 0.2 = 0.5
In our case, this is a 50% chance, because of the two checks with Milk and Bread, one contains also Eggs.
When analyzing pairs of goods, we also use the correlation coefficient . It determines how similar the sales of two products are.
There are 3 options for the correlation of sales of goods:
- correlation coefficient is higher than 0, positive correlation, graphs of sales of goods are similar or identical;
- correlation coefficient 0 - the graphs of sales of goods vary significantly;
- the correlation coefficient is below 0, the negative correlation, the diagrams of sales of goods are opposite, the sales of one product increase, the second product fall.
Analysis of shopping carts provides information on the combination of products in typical baskets. But, often this information is too obvious or already known to the retailer based on its experience or the popularity of the goods. The definition of implicit links between products will be important in the analysis of baskets.
For this BI Datawiz.io allows you to filter shopping carts by periods, days of the week and time intervals . Identify typical baskets on weekdays and weekends, in different seasons, periods before holidays, i.e. purposefully structure checks for given parameters.
Filtering at the cost of checks allows you to determine the typical baskets of different price categories, for example, what goods fall into checks from 30 to 50 UAH., From 500 to 1 thousand UAH.
Another aspect is the analysis of shopping carts by categorization levels .
Categorization is the distribution of goods in different product groups. For example, “Milk and dairy products” is a top-level category, it is divided into subcategories - dairy and fermented milk products. Fermented milk products are divided into yoghurts, kefir, ryazhenka, etc. different brands and brands. The lower level of categorization is the specific name of the product.
The service allows you to analyze typical baskets for different levels of categorization. For example, at the top level of categorization they buy low alcohol drinks with cigarettes, snacks, etc.
Brand analysis provides data on the entry of brands into typical baskets. So, they buy Obolon beer with Lyuks chips, and Lvovskoye beer from Lays.
Analysis of items in typical baskets allows you to determine the specific features of consumer behavior. For example, the purchase of 250g yogurt “Molokia” 1.2% and rolls with cottage cheese - lunch office worker.
Interesting results are obtained by analyzing the combination of specific products with brands or categories. It affects the purchasing habits of customers, advertising, to some extent, even public opinion and traditions.
The combination of several types of filtering in the analysis of shopping carts makes it possible to structure the information on online purchases that a retailer needs, to properly target promotional activities, and as a result, to increase profits.
The location of goods on the trading floor, promotions, the appearance of goods on the shelves and other factors affect the entry of goods into the basket.
This should be taken into account using and using the results of the analysis to eliminate erroneous data. For example, the goods that are placed near the cash register are bought because they caught the eye while the person was standing in line, therefore it is not logical to use pairs with such goods for analysis.
Sample shopping cart analysis
We will analyze alcohol sales in the supermarket chain using the BI Datawiz.io service.
The task is to identify typical baskets with alcohol, identify other products in these baskets, the optimal time for sales of a particular type and brands of alcohol.
For the analysis of the alcohol group we start with the following indicators:
The period is the current year.
The time period is according to the shop opening hours from 8 am to 11 pm
The cost of the basket is not limited.
The threshold is 1%; it eliminates pairs of goods with the support of less than one percent.
Level of categorization for the product of the investigation - 0.
All days of the week.
As you can see, for the current year of checks with alcohol was 20458.
The graph shows the distribution of checks with alcohol at a cost with an interval of 5 UAH .:
- horizontally - the cost of checks;
- Vertically - the number of checks.
The largest number of checks 1922 - with the cost of 75 hryvnia.
The main number of checks with alcohol falls into the price category from 50 to 200 UAH.
Shopping time
What time does the store buy the most alcohol?
Let's analyze the number of purchases in 3 selected time intervals:
- from 8 to 13;
- from 13 to 18;
- from 18 to 23.
In the morning from 8 to 13 hours in the trading network - 6153 checks with Alcohol.
Price category (as seen on the chart) from 50 to 170 UAH.
The second time interval from 13 to 18 hours - 10847 checks. Price category from 45-255 hryvnia.
After work hours from 18 to 23 hours - only 7173 checks. Price category - 40-170 UAH.
Conclusions: it would seem, strong alcohol would have to buy more in the evenings after work, but not here. The maximum number of purchases is at lunchtime, at the same time the cost of typical baskets is the highest.
Related Products
Products associated with alcohol are quite predictable. The most popular cigarettes, beer, low alcohol drinks, water.
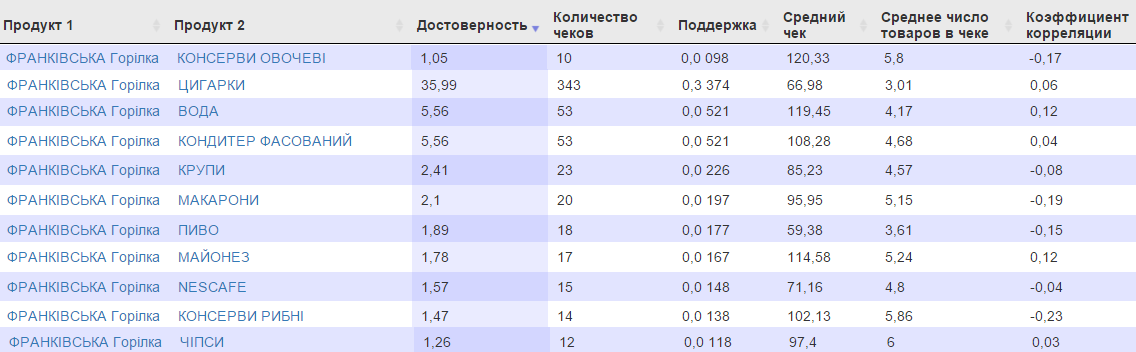
Let's try to narrow the search by setting filters on Frankivka Gorka vodka, Saturday morning.
The use of the Categorization Level parameter for the product of a consequence makes it possible to analyze pairs of products for different levels of categories. Get information about what brands, categories buy with a particular product. To do this, you just need to set the desired level of categorization.
In this case, we use the third level of categorization and determine which categories of products are purchased with a specific vodka brand.
The most popular checks - up to 100 UAH.
Associated goods to “Frankivska Gorkіlka” on Saturday morning pasta and cereals, beer, canned fish.
We would call these baskets - “Breakfast Bachelor”.
Let's look at typical baskets with vodka on Saturday and Friday evenings, this includes more expensive brands, and other types of alcohol, cigarettes, confectionery, sweet water and energetics are in pairs with them.
The picture below shows combinations of three products in such typical baskets.
Basket cost
Analyze checks from 200 UAH. where champagne goes.
As can be seen in the picture, typical baskets from 200 UAH. with champagne include several types of alcohol, i.e. Most likely these are purchases for family celebrations and gatherings.
Although a couple of items of champagne and seeds are baffling to us.
Shopping for the holidays
The easiest way to illustrate the cyclical shopping for the holidays is with the example of vermouths.
Initially, vermouth - ladies drink, and as the sales schedule shows, it is also a festive drink.
At the third level of categorization, couples with vermouths get such goods as expensive candy boxes, confectionery, other alcohol, sweet water. Again, this is a shopping for a feast.
In order to analyze which brands buy vermouths use other levels of categorization.
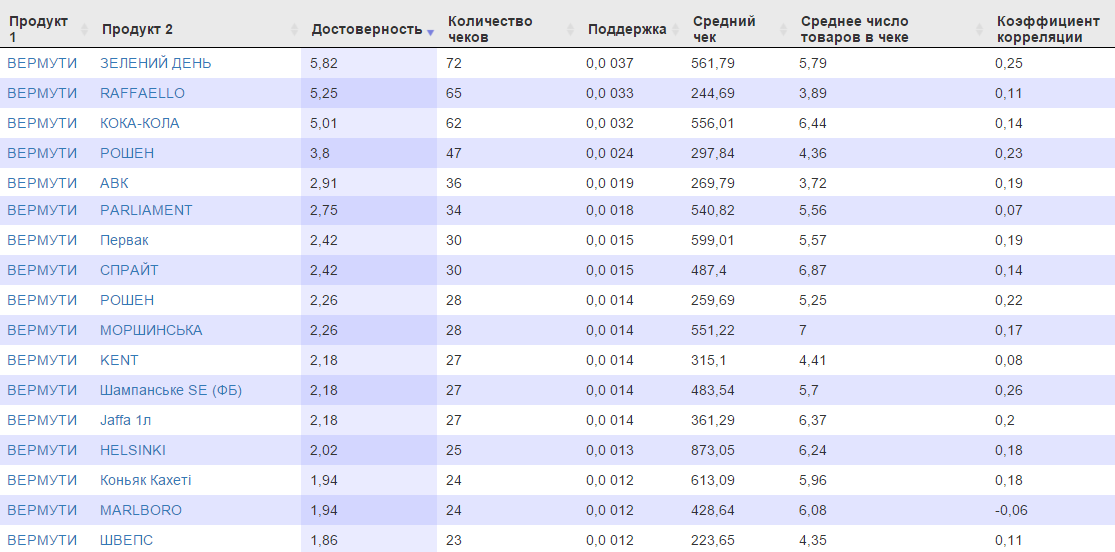
At level 5 categorization, we obtain the results as in the picture below.
As you can see, vermouths are buying with specific brands:
- Confectionery Roshen, Raffaello, AVK;
- vodka Green Day, Pervak, Helsinki;
- cigarettes Parliament, Kent, Marlboro.
Such information significantly helps the retailer to properly target promotional activities.
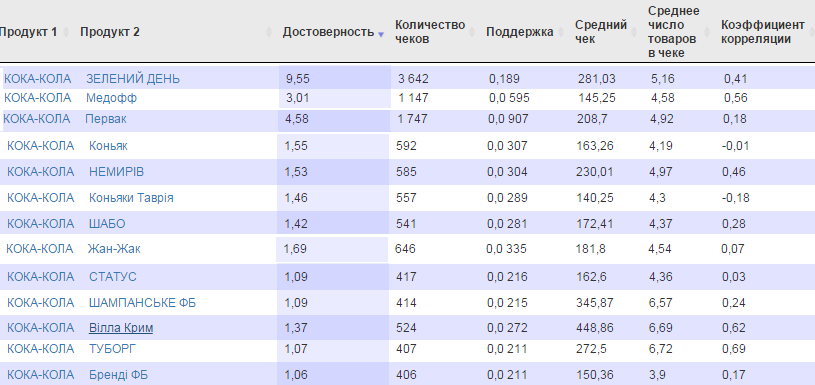
What else is interesting, almost any strong alcohol our buyer takes with one of the types of cola.
Cola with strong drinks gives a high correlation.
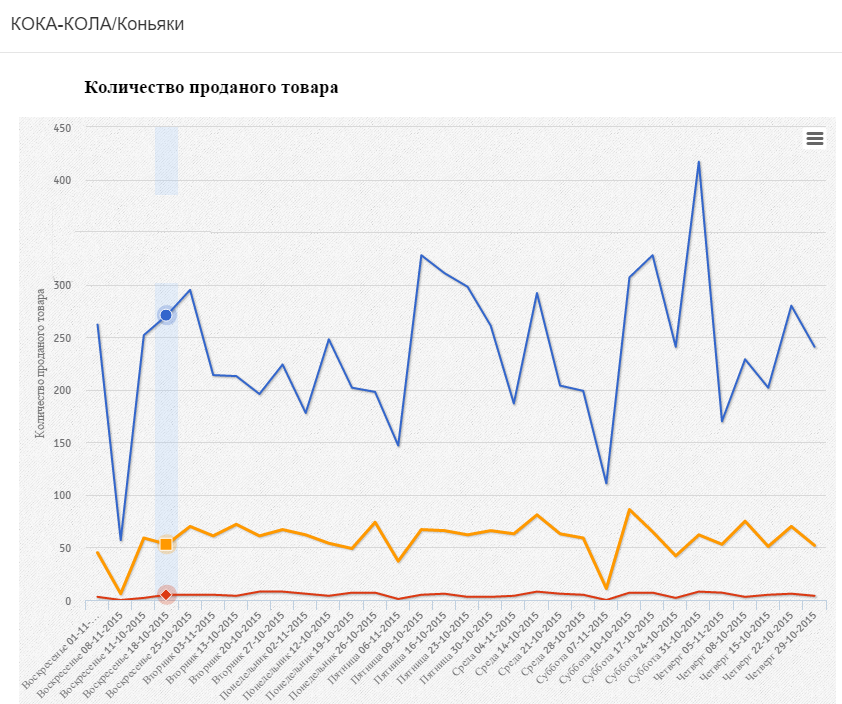
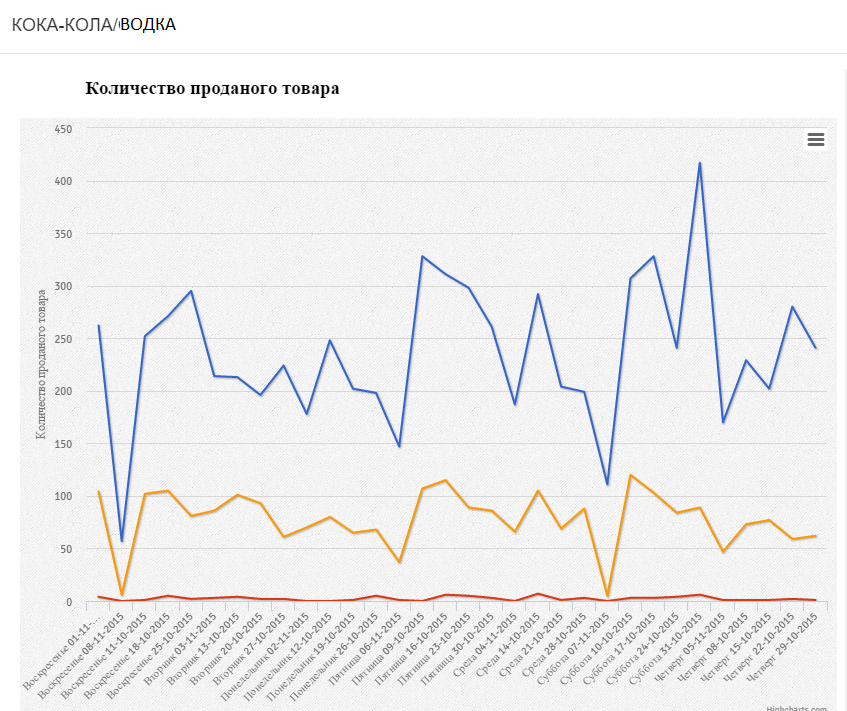
Couples of goods and dependences can be clearly seen on sales graphs.
The sales of cola are highlighted in blue, the sales of alcohol in yellow, the sales of a pair of goods in red.
Cola and alcohol sales graphs are similar. Promotions for the sale of any strong alcohol and cola will always be successful.
How does shopping cart analysis use retailer?
- To optimize the display of goods. For example, place paired products nearby to increase the likelihood of purchase. Or, on the contrary, the goods are more likely to be purchased, at a distance from each other, and between them is the third desired product.
- To select promotional items. A good idea for promotional activities is to give a discount on expensive sweets, such as Raffaello, when buying vermouths before the holidays.
- For targeted marketing activity. Formation of special offers for different groups of customers on key and related products.
- To understand the needs of customers at different times and days of the week, offers the right range.
- For action to increase the number of articles in shopping baskets and the average check.
Analysis of shopping carts is an important component of working with data in retail. BI Datawiz.io allows you to fully analyze all available information about purchases in the trading network.
Are your checks still dead weight?
Source: https://habr.com/ru/post/270503/
All Articles