The system of counting visitors to the store: as Google Analytics, only on infrared sensors - and tricky statistics that you can not see
In the 1940s, you needed a special grandmother who counts people at the entrance to the store. In the 1950s, the camera was the height of progress, the film from which could later be analyzed. In the late 80s, infrared sensors or simply opening-closing counters on reed switches began to spread in the USA and Europe (including Germany). Now technologies are slowly drifting to detecting your broadcast Wi-Fi and Bluetooth packets (network search search), in order to track phone movements with an accuracy of 3 centimeters. Plus, the importance of recognizing the flow of people from video systems is growing.
But let me tell you about that invisible work, which is done on the basis of ordinary counters of a person’s passage, as in a turnstile. Only without a well-aimed blow to the balls.
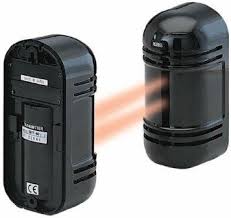
The easiest implementation after the reed switch - the intersection of the IR beam
')
It may seem that in addition to counting visitors in the store, such things are not needed for anything. However, if you stick with them the entire shopping center, even a simple linear analytics gives a lot of useful things. For example, a competent shopping center for tracking flows knows that the store has ceased to please its audience - and it understands numerically who the new tenant should be in charge of.
This, in my opinion, is the best example of the fact that even data as simple as a log can be used ten times more efficiently than usual if you attach your head.
The simplest and cheapest implementation is a turnstile, when all the logic is done in the receiver of the beam, and the radiator should simply shine into it according to the principle of a flashlight. An interruption of the beam is fixed for a time longer than an accidental trigger (for example, a wave of the arm through the control zone). The second version is simply an IR sensor, similar to that used to control room penetration (fixing the averaged IR background through the Fresnel lens, which allows to receive consecutive pulses when a person moves through the visibility zone). There are also implementations based on ordinary cameras. Industrial systems are distinguished from those collected by craftsmen by the degree of accuracy, delays and ease of removal of indicators. Well, the ability to network and integrate into other building subsystems.
If the shopping center shares with tenants data about the sensors of the entrance to the building itself and you see visits to your store, this allows you to consider a very important thing - to separate seasonal, weather and other fluctuations from advertising, deterioration of service, and so on.
It's simple. You can see that this week the number of your visitors in the store fell by 10.6%. This is probably bad, you think. Then look at the counter of the entrance to the shopping center itself - and there is a drop of 24%. It becomes clear that this is still a growth, not a fall. Either the shift worked more efficiently than before, or the advertisement worked.
Next, you can take a look at the accumulated data. For example, the same week in the past and before last years. You are interested in not only absolute figures, but also the ratio of those who came to the mall and those who came to the store (entrance conversion). This allows you to get another pivot point for the decomposition of demand - that is, mathematically calculate the effectiveness of these types of advertising, where there is no way to understand where a person comes from. In short, the principle is this: you need to clear the signal from noise - seasonal changes, weather influence, all kinds of closed metro stations, product impact and so on, and get the reference schedule "how it should be sold" - in fact, the mathematical forecast of the past period. We predict the actual data already received in order to understand the difference between “should be” and “so in reality”. And to compare the forecast with deviations more error, and this will be the effectiveness of advertising, for example.
Having 15 points and using different methods of advertising, you can create a system of equations that allows you to quickly understand the most effective combination of methods. Having one outlet you just have to go through the options and their combinations and do decomposition - this is much slower, but you still do not move blindly. And the difference between the intuitive and experimental approach is just one device.
A good shopping center also gives you the opportunity to see what is happening on the floors and in the zones of the floors. Because the sensors are cheap, and the data from them are valuable. For example, you can see that the whole children's theme sags - or because of some problems in navigation, people leave the floor. Useful clarifications.
The basic example of analytics is to evaluate whether it is worth paying for rent in this place. Knowing about your conversion from the stream and the average bill, you can estimate what 250 thousand rubles for 20 square meters is - damn expensive or very profitable. The problem is that no one will give you data before signing the contract, so you need to stand and count as hands, and on different days and at different hours. But this is the base metric.
Already in place, it is very convenient to calculate the weekly and hourly fluctuations of the flow on the counter. For example, our peak often falls on 16-17 and 18-19 - it was then that most people are in stores. This means you can create an optimized schedule for sellers - one works in full shift, the second - half shift, and it goes, for example, a couple of hours before the peak and ends a couple of hours before closing. This is your savings (you get the right number of sellers and do not leave them idle in moments without people) and the convenience of the seller - according to such schedules (where there are changes) you can work, for example, part time worker or a person with a flexible schedule for another job. Such is the cloud service sellers, very characteristic of the current economy.
Naturally, weekly fluctuations make it clear that for the weekend, for example, you need to put reinforced shifts. This is usually understandable, but strength is in historical data. You can raise, for example, the cases of holidays in the middle of the week and see what it changes in a shift, so as not to call extra people or, conversely, not to leave one seller to be torn apart by a crowd of buyers.
Tracking the flow allows you to understand how interesting your store is for the audience at the mall. For example, if many people pass by the principle of “just walking” (high productivity), this is one calico. If many people come in, and you have high synergy in the zone - another one. This data is useful for sharpening the model and scaling it. And understanding where and how you will work well. To know whether to meddle in these places.
Seeing the entrances-exits in each zone, one can understand what is interesting for people in this particular shopping center. For the shopping center itself, this is a reason to more accurately select tenants (in a shopping center with sensors, as a rule, there are far more applications than free seats). Again, you can calculate the ratio of the interestingness of the zone to its area - this is suggestive.
You can also build a relative attractiveness - your share in relation to the total area share (or to a competitor with a share - even if the entrance sensor is not fumbling, no one has forbidden people to count with hands). Plus, regular withdrawal of checks from a pair of key stores in the zone (there are printed continuously uniformly increasing numbers that are required by the standard) - and you know exactly what is wrong with you and what can be done better. A successful idea of someone on the floor can turn into something that we then digest, catch up with and overtake, and then scale it across the country.
One of the problems of the same Google. Analytics in retail is that you do not know the conversion of conversions from the site to the store. If a person just looked at the product, and then went down to the point, then you will never understand that he did just that. More precisely, you never know how many such people. We have the opportunity to "quietly" open a control store and follow the transitions from the site for a week or two, but this is a luxury of scale.
So, conversion is important. For example, at one of the latest conferences, the dude from Yulmart told the following scheme: when they do not have a shop in the city, roughly speaking, conversion on the website into a sale is 1% for analytics. As soon as there is a point where you can throw the TV in the face of the seller with a shout: “What the hell is this?” - the conversion grows to 1.5%. Open a large store with a showroom - even higher, etc. It is often convenient and useful to compare it with the conversion from the pedestrian flow, that is, the ratio of those that have passed your point to those who have come and have come to those who have bought it. Gives an understanding of how an assortment matrix affects demand, for example.
Despite the extreme simplicity of the device itself (a set of sensors and software that corrects the inputs-outputs of sellers), shopping malls of the third generation and higher do a lot of good statistics. Specifically, each time you come to the shopping center purposefully at one point, and then go for the products, once you come, you can statistically identify and understand what happened. And to conclude that this tenant attracts people to the mall. Or, on the contrary, it costs you to "vote with your feet" and walk past a fashion store in a chain of the same - as its rating immediately drops a bit.
Taking into account how little this topic is developed, I want to say that even extremely “wooden” fair data can be used creatively. And that, we do not always know what to do even with such simple sets. Therefore, every time I hear about Big Data at retail conferences, I think that I should first learn how to cope with what I already have.
But let me tell you about that invisible work, which is done on the basis of ordinary counters of a person’s passage, as in a turnstile. Only without a well-aimed blow to the balls.
The easiest implementation after the reed switch - the intersection of the IR beam
')
It may seem that in addition to counting visitors in the store, such things are not needed for anything. However, if you stick with them the entire shopping center, even a simple linear analytics gives a lot of useful things. For example, a competent shopping center for tracking flows knows that the store has ceased to please its audience - and it understands numerically who the new tenant should be in charge of.
This, in my opinion, is the best example of the fact that even data as simple as a log can be used ten times more efficiently than usual if you attach your head.
What do people think
The simplest and cheapest implementation is a turnstile, when all the logic is done in the receiver of the beam, and the radiator should simply shine into it according to the principle of a flashlight. An interruption of the beam is fixed for a time longer than an accidental trigger (for example, a wave of the arm through the control zone). The second version is simply an IR sensor, similar to that used to control room penetration (fixing the averaged IR background through the Fresnel lens, which allows to receive consecutive pulses when a person moves through the visibility zone). There are also implementations based on ordinary cameras. Industrial systems are distinguished from those collected by craftsmen by the degree of accuracy, delays and ease of removal of indicators. Well, the ability to network and integrate into other building subsystems.
Entrance to the mall and entrance to your store
If the shopping center shares with tenants data about the sensors of the entrance to the building itself and you see visits to your store, this allows you to consider a very important thing - to separate seasonal, weather and other fluctuations from advertising, deterioration of service, and so on.
It's simple. You can see that this week the number of your visitors in the store fell by 10.6%. This is probably bad, you think. Then look at the counter of the entrance to the shopping center itself - and there is a drop of 24%. It becomes clear that this is still a growth, not a fall. Either the shift worked more efficiently than before, or the advertisement worked.
Next, you can take a look at the accumulated data. For example, the same week in the past and before last years. You are interested in not only absolute figures, but also the ratio of those who came to the mall and those who came to the store (entrance conversion). This allows you to get another pivot point for the decomposition of demand - that is, mathematically calculate the effectiveness of these types of advertising, where there is no way to understand where a person comes from. In short, the principle is this: you need to clear the signal from noise - seasonal changes, weather influence, all kinds of closed metro stations, product impact and so on, and get the reference schedule "how it should be sold" - in fact, the mathematical forecast of the past period. We predict the actual data already received in order to understand the difference between “should be” and “so in reality”. And to compare the forecast with deviations more error, and this will be the effectiveness of advertising, for example.
Having 15 points and using different methods of advertising, you can create a system of equations that allows you to quickly understand the most effective combination of methods. Having one outlet you just have to go through the options and their combinations and do decomposition - this is much slower, but you still do not move blindly. And the difference between the intuitive and experimental approach is just one device.
A good shopping center also gives you the opportunity to see what is happening on the floors and in the zones of the floors. Because the sensors are cheap, and the data from them are valuable. For example, you can see that the whole children's theme sags - or because of some problems in navigation, people leave the floor. Useful clarifications.
Only the entrance to your store
The basic example of analytics is to evaluate whether it is worth paying for rent in this place. Knowing about your conversion from the stream and the average bill, you can estimate what 250 thousand rubles for 20 square meters is - damn expensive or very profitable. The problem is that no one will give you data before signing the contract, so you need to stand and count as hands, and on different days and at different hours. But this is the base metric.
Already in place, it is very convenient to calculate the weekly and hourly fluctuations of the flow on the counter. For example, our peak often falls on 16-17 and 18-19 - it was then that most people are in stores. This means you can create an optimized schedule for sellers - one works in full shift, the second - half shift, and it goes, for example, a couple of hours before the peak and ends a couple of hours before closing. This is your savings (you get the right number of sellers and do not leave them idle in moments without people) and the convenience of the seller - according to such schedules (where there are changes) you can work, for example, part time worker or a person with a flexible schedule for another job. Such is the cloud service sellers, very characteristic of the current economy.
Naturally, weekly fluctuations make it clear that for the weekend, for example, you need to put reinforced shifts. This is usually understandable, but strength is in historical data. You can raise, for example, the cases of holidays in the middle of the week and see what it changes in a shift, so as not to call extra people or, conversely, not to leave one seller to be torn apart by a crowd of buyers.
Entry to you and entry-exit from the zone
Tracking the flow allows you to understand how interesting your store is for the audience at the mall. For example, if many people pass by the principle of “just walking” (high productivity), this is one calico. If many people come in, and you have high synergy in the zone - another one. This data is useful for sharpening the model and scaling it. And understanding where and how you will work well. To know whether to meddle in these places.
Seeing the entrances-exits in each zone, one can understand what is interesting for people in this particular shopping center. For the shopping center itself, this is a reason to more accurately select tenants (in a shopping center with sensors, as a rule, there are far more applications than free seats). Again, you can calculate the ratio of the interestingness of the zone to its area - this is suggestive.
You can also build a relative attractiveness - your share in relation to the total area share (or to a competitor with a share - even if the entrance sensor is not fumbling, no one has forbidden people to count with hands). Plus, regular withdrawal of checks from a pair of key stores in the zone (there are printed continuously uniformly increasing numbers that are required by the standard) - and you know exactly what is wrong with you and what can be done better. A successful idea of someone on the floor can turn into something that we then digest, catch up with and overtake, and then scale it across the country.
Login to you and the entrance to the site
One of the problems of the same Google. Analytics in retail is that you do not know the conversion of conversions from the site to the store. If a person just looked at the product, and then went down to the point, then you will never understand that he did just that. More precisely, you never know how many such people. We have the opportunity to "quietly" open a control store and follow the transitions from the site for a week or two, but this is a luxury of scale.
So, conversion is important. For example, at one of the latest conferences, the dude from Yulmart told the following scheme: when they do not have a shop in the city, roughly speaking, conversion on the website into a sale is 1% for analytics. As soon as there is a point where you can throw the TV in the face of the seller with a shout: “What the hell is this?” - the conversion grows to 1.5%. Open a large store with a showroom - even higher, etc. It is often convenient and useful to compare it with the conversion from the pedestrian flow, that is, the ratio of those that have passed your point to those who have come and have come to those who have bought it. Gives an understanding of how an assortment matrix affects demand, for example.
Invisible work
Despite the extreme simplicity of the device itself (a set of sensors and software that corrects the inputs-outputs of sellers), shopping malls of the third generation and higher do a lot of good statistics. Specifically, each time you come to the shopping center purposefully at one point, and then go for the products, once you come, you can statistically identify and understand what happened. And to conclude that this tenant attracts people to the mall. Or, on the contrary, it costs you to "vote with your feet" and walk past a fashion store in a chain of the same - as its rating immediately drops a bit.
Taking into account how little this topic is developed, I want to say that even extremely “wooden” fair data can be used creatively. And that, we do not always know what to do even with such simple sets. Therefore, every time I hear about Big Data at retail conferences, I think that I should first learn how to cope with what I already have.
Source: https://habr.com/ru/post/270433/
All Articles