Project Monitoring: Comparative Analysis of Existing Solutions

We offer you a publication based on the speech of Anton Baranov , ITSumma, at the summer conference BitrixSummerFest .
In this post I will tell you what you need to monitor from the very beginning in projects, including high-load ones. Let us analyze the aspects related to open source monitoring systems, in particular Zabbix and Graphite, and also look at several SaaS monitoring solutions.
So, you need to decide from the very beginning for yourself which system parameters need to be monitored. Conventionally, there are three areas of monitoring:
')
- Consumption of resources.
- Work server software.
- Business logic application.
Resources
They are divided into two types: critical and important. Critical are those resources, the lack of which is guaranteed to lead to the inoperability of your application. For example, if the processor is fully loaded, new requests will not be processed quickly. And this may lead to the care of users.
Also critical resources include RAM, disk subsystem bandwidth, network bandwidth. With a shortage of each of these resources, the responsiveness of your service may drop so much that you will start losing your audience.
Important resources are those, according to the dynamics of which changes it can be assumed that problems will soon arise with the project. For example, if you start using a swap file, in most cases this indicates a lack of RAM. In addition, the use of a swap file reduces system performance, and as a result, this can lead to project inaccessibility for users.
The status of the RAID, that is, the disk subsystem, the status of the “health” of the disks themselves, may indicate the imminent occurrence of a failure and loss of information. Also quite important metric is IOPS - the number of I / O operations per second. Pay attention to the AVIO disc - the average response time to disk requests. If, for example, AVIO is about 10 milliseconds, then it's time to think about whether to change a particular disk. It is highly recommended to monitor the number of used sockets on the server, the temperature of the processor and the speed of rotation of the fans.
Especially I draw your attention to the temperature of the processor - there are cases that when the processor overheats, the server simply cannot properly process all incoming requests.
Server software
Here it is necessary to clearly understand what is being monitored and why. That is, you need to be fully aware of what each parameter is needed for, which we put on monitoring, for which we set up notifications, for which it is responsible.
Nginx For this product, RPS is by far the most important feature. This abbreviation stands for requests per second, that is, the number of requests to your site per second.
PHP-FPM . Here you also need to monitor the RPS, the number of active processes, the message that pool PHP-FPM has reached the limit on the number of processes.
Sphinx . This is a full-text search system on sites. Here it is necessary to monitor the number of requests and Fatal Error. The fact is that in Sphinx versions below 3.x, in some cases, errors may be recorded, a log is kept, but the system works, accepts requests and does not respond to them. In this case, we get a very bad situation: it would seem, everything works fine, the requests for Sphinx go, but the site has an empty page with code 200.
MySQL It is necessary to monitor the number of queries to the database: select, update, insert. It is necessary to track the number of processed lines. For example, you have slightly changed the logic of the project and you now use other queries, but you forgot to add the indices. The next parameter to track: column processing speed. For example, if you previously processed 10 million per minute and everything was fine, now all of a sudden, 120 million columns are processed, the disks are working at the limit, everything is slowing down. So the tracking of this parameter can make it clear what the problem is after the next deployment.
You also need to control buffer pool usage and replica status. The status of the replica is very important when a fault tolerant circuit is used. Thus, we monitor that the reserve was in an active state.
Exim . Monitor the size of the mail server queue. If it grows very quickly or does not decrease for a long time, this may indicate that, for example, some mail service has been banned by our server and considers all letters from it as spam.
Business logic
It is necessary to monitor a group of parameters that relate to the business logic of the application. For some reason, many people forget about them, focusing on the server and software logs. In the project itself, you can monitor the components of business processes. For example, the number of new registrations of users who want to make a purchase. In some cases, a reduction in the number may be indirect evidence of some breakdowns in the project.
But if the registration process does not work correctly, the user will not be able to place an order, place a purchase, pay, etc. Therefore, in certain situations, when we are not sure that the registration process has not broken down, it makes sense to monitor the entire process from beginning to end. That is, from the moment a user enters his data until he logs in normally and sees his goods in a basket.
Depending on the adopted business logic on sites that deal with the distribution of applications, it is necessary to monitor, for example, the number of downloads. In advertising projects, it is recommended to track the number of banner impressions, their views, the ratio of views to clicks, etc.
An indirect, but no less important parameter is the availability of the services of the partner companies used in your project. For example, a Java script that is loaded from a third-party server. If the partner is slowed down by the servers, then the Java script will load slowly. This will be especially bad if your site is designed in such a way that without this Java script the page will not load any further. It turns out that the problems of someone else's uncle, and your users suffer.
Also in certain situations, statistics on queries with one or another referrer helps. This is very important for affiliate programs: we can understand where and who is driving traffic. If you or your client assume that somewhere in the code an error has crept in and the statistics are considered to be incorrect, then you can correct it by logs.
How to monitor complex chains of business logic? For example, check the registration form work? You can do this:
- Create a mail server.
- We write a PHP script that goes to the client site and is registered as a regular user.
- After this, the script checks the contents of the mailbox, parses the letter, takes the registration confirmation link from it, passes through it, gets an answer, parses it and logs in with the data with which it registered.
- At the end of all procedures, the script sends to the monitoring system 1 or 0, depending on the results of the test. Naturally, all script actions must be logged in detail.
Problems with the monitoring system
Monitoring can break too. Therefore, it is very important to monitor the performance of the monitoring system itself. This could be some kind of separate script, launched by cron, or some other check. But the most important thing is that it is necessary to check that monitoring is available, it works, sends notifications, checks values, checks them with notifications you have configured, etc. Without this check, at one point, you may find that the graphics appear to be drawn, and the service is already the third day.
Monitoring tools
Let's start with open source systems, Zabbix and Graphite.
Zabbix
The system backend is written in PHP, MySQL, PostgreSQL, SQLite or Oracle can be used as a database for storing metrics. On the client side, either Zabbix agent, SNMP, or some scripts that send data to Zabbix can be used. By “client” is meant the server that we are monitoring.
How is the monitoring process in Zabix:
- Create a host in Zabbix.
- Add a server that will be monitored.
- Install the Zabbix agent on it.
- We set up templates in Zabbix that need to be monitored, for example, Nginx, MySQL. If there are no templates, you can google or write them.
- We configure the agent to send the necessary parameters to Zabbix.
- Configure the web script in order to check the URL on the project.
Nginx monitoring:
- We find and import templates, because Zabbix itself does not have Nginx built-in check.
- On the client side, we write a bash script that will send data from Nginx status to Zabbix in the correct format.
- We register include in Zabbix-agent.
After all these manipulations, Zabbix starts monitoring Nginx.
Notifications in Zabbix are built on the principle of a template. Each of them has metrics for monitoring. For example, RPS, number of requests, etc.
Each metric has a trigger. Say, when monitoring Nginx, we can make a trigger for RPS that will trigger if RPS = 0 for five minutes. When a trigger is triggered, a notification is sent to the mailbox or to any other notification system that we have chosen.
In general, Zabbix is quite complex in configuration. Zabbix server is scaled in the same way as any other web application, that is, we can parallelize databases, web servers. If you wish, you can automate the monitoring of new services. For example, take your favorite configuration management system and configure it so that the new node is automatically added to Zabbix after creation.
Cacti
This is an open source system. MySQL is used as a database backend for internal moments. Information about metrics is stored in rrdtool format, that is, all metrics data, like Cacti itself, is written in PHP. On the client side, an SNMP daemon is used, which sends data to the Cacti server.
How is the monitoring process in Cacti:
- Install snmppd on the server.
- Configuring rocommunity in snmpd - the identifier of this server.
- Add a Cacti host.
As you can see, everything is extremely simple. Difficulties begin further. By default, only the most basic resources can be monitored - CPU, memory, traffic. All other parameters (Nginx, MySQL, mail, etc.) are monitored using third-party plug-ins, which are installed additionally. Even email notifications require a plugin. The same applies to monitoring the URL (the availability of your site), setting notifications for exceeding some values and much more.
The process of creating an alert looks like this:
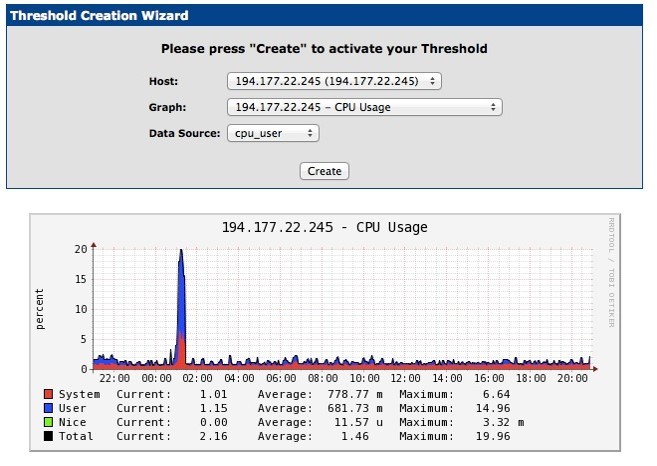
We select the server, schedule and metric. On this graph, for example, we have System, User, Nice metrics, CPU load. A notification is sent when the CPU User is exceeded.
Cacti is not a flexible system. If Zabbix, for example, allows using plugins to send notifications through a variety of systems, including Jabber, Slack, etc., then notifications are sent to Cacti via e-mail only via a separate plug-in.
This is the notification that came to the e-mail:
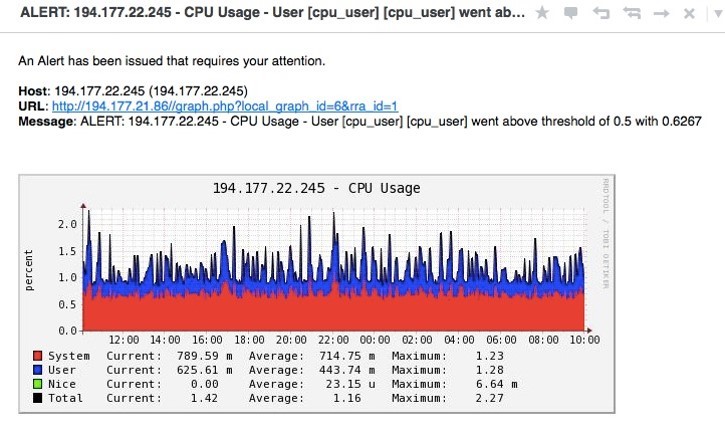
Summarize. Monitoring in Cacti is carried out either through SNMPD, in which we have prescribed sending information to the server through some of our scripts, or using some plug-ins that are installed on the Cacti server itself. Notifications are sent only to e-mail.
With automation, Cacti is also quite bad: there are only clima-scripts from the command line that run on the server side and have poor flexibility. Cacti is scaled as a normal web application, that is, you can horizontally scale MySQL, you can put Nginx, followed by several web nods, etc.
Graphite
This open source system is more interesting than Zabbix and Cacti. The server part of the system consists of three parts - Carbon, Whisper and Graphite web application. The last component is a subsystem for drawing graphs and displaying them on the web.
- Carbon is a demon in which monitoring data flows from clients.
- Whisper is a server-side database that collects monitoring statistics.
- Graphite Web application is a subsystem that displays a beautiful page with graphs in the browser.
On the client side, we can install any software that will send Graphite data in the right format. There are many solutions, you can write your own, if you are ready with something you do not like.
Graphite monitoring is extremely simple:
- We install not the client, for example, collectd.
- We include the necessary plugins.
- Specify which parameters to monitor.
- Configure them accordingly. For example, we register access to MySQL or to the status of Nginx, and we configure data binding in Graphite.
<Plugin mysql> <Database test1> Host "127.0.0.1" User "root" Password "sohW2ax0Eenox9t" Database "test1" MasterStats false </Database> </Plugin> You can monitor anything and anything. If only your application normally sent data to Graphite. This is what a standard junction application looks like, which draws data from Graphite.

If you need more beautiful graphics, you can use other applications.
Notifications are configured quite flexibly. For example, there are solutions that allow you to send notifications via mail, HipChat, Slack, or to your own services. An example of setting up notifications:
"alerts": [ { "name": "Memory", "query": "aliasByNode(collectd.*.memory.memory-free, 1)", "interval": "1minute", "format": "bytes", "rules": ["warning: < 300MB", "critical: < 200MB"] }, Everything is done in text format, after which we reboot the notification system, and it picks up new parameters. An example of a notification that came in the mail:

Graphite is quite a flexible system that allows you to monitor almost anything. It is necessary to configure mainly on the client side, that is, the part that sends the monitoring data to the server. Notifications are configured as you like. Automation is carried out simply in text format.
Graphite scales horizontally. The Whisper storage engine used in it has limitations: when there are a large number of servers (from several dozen), we rest on the limitation of the format itself, and in this case the backend must be changed. But this does not happen often, so initially you can only use Whisper.
If you have many working servers and one monitoring server does not cope with all metrics, then you can use Graphite-relay solution for scaling.
SaaS monitoring
This approach is used when the monitoring server is on the side of the developer company.
As an example, consider the server Density. We register in the service and add our server there. They give us a link by which we download the agent and install it on our server.
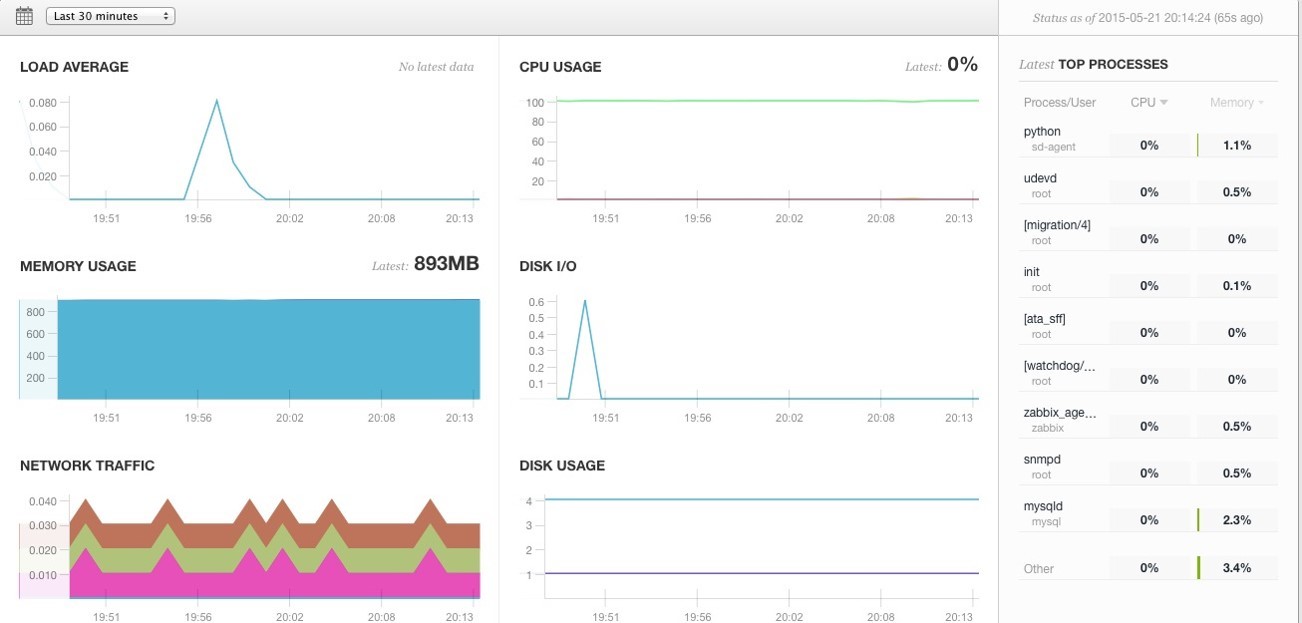
We have our server added to the SaaS service and the Python daemon running on our server. All we need now is to set up this Python daemon: for example, add data for Nginx status and access data for MySQL. After a reboot, in the settings of Server Density, you need to activate the display of graphs for MySQL and Nginx.

When using SaaS monitoring, you can monitor many parameters. For example, the URL of our online store. The response code of the request, the response time, etc. will be monitored. You can create the necessary notifications for us by any parameter.
Most of the SaaS monitoring services are structured as follows: there is a certain web interface through which we add a server, install an agent on our server, and that’s all. No more complicated monitoring steps are required from us. Only in a clear web-interface we set up notifications according to the parameters we need.
Which tool to choose?
The main factors affecting your choice: the number of nodes that need to be monitored and the tasks that are planned to be solved. For example, for a small startup with a single server, the ideal option would be Server Density. For an organization with a distributed network infrastructure and a large number of servers in different cities, Zabbix is the best solution. For a small office, where you need to monitor some basic server indicators, Cacti is perfect.
Source: https://habr.com/ru/post/270341/
All Articles