We create an interactive vector scheme of the Moscow metro
Moscow Metro is changing. Those who wish to imagine a scheme, say, of 1945, will easily collect data from open sources; the question remains with the presentation of the result, - not to show it on a pie chart. In the article I will talk about the main steps in creating a proof-of-concept service that allows you to show the metro scheme, for example, on May 1, 74 years (left) or stations with a depth of more than 30 meters (right) .

It is assumed that the reader is at least superficially familiar with javascript, has an idea of vector graphics and is generally well done (will notice an error or a non-optimal solution and is not too lazy to suggest the best option for comments) .
To make the scheme interactive, we first need the scheme itself. Let's look at what we want to get and analyze the image into simple elements.
')
The most important thing on the diagram is the stations, so let's start with them. Only 3 types: final, transfer and normal. 2 rectangles and a circle. What could be easier? Painstakingly arrange them on the canvas, and some more and turn.
In order to move forward comfortably, I also added their index (numeric) and line to the properties of the stations - just below you will understand what this is done for.
What is the line? This is a set of segments between stations. We have coordinates, indices and station lines - which means we can easily draw segments. Let's go through the stations and we will be guided by the following logic for each of them: if there is a station of the same line, but with an index higher by one, then draw a segment between them.
Take a look at the diagram and try to answer, what 2 segments will not be drawn?
As we shall see, the beginning and end of the segment do not go exactly as we need. For each of the 3 types of stations, we add an offset calculated experimentally. Also, our segments are set straight, but the lines themselves are many where fancifully curved. Perhaps this is the most painstaking part of the work on the project, for a number of segments we will add an exception in behavior. Fortunately, the syntax is simple .
Svg graphics use the layer model, which means that in order to get the desired result, we will make each transition using two curves: a colored one with a thick lower stroke and a white one with a thin one. The total arrangement of the elements is the following, from the lower to the upper: lines, segments of transitions with a color thick outline, stations, segments of transitions with a thin white outline, the substrate of the names of stations, the names of stations.
Display the names and align the text using the text-anchor property. Unfortunately, there is no way to carry out a line break, except by creating an additional element.
Substrate text will make the usual translucent rectangle. We will get the sizes and coordinates of the text using getBBox .
I chose the default colors for stations as their line colors. But what if we want to repaint everything on an arbitrary gradient? It is not as difficult as it may seem.
We have an arbitrary gradient from one color to another, which for convenience we take in the channels, the station value (for example, a depth of 23 meters) and the maximum and minimum possible values (0 for ground stations and 80 for the deepest Victory Park). Calculate the percentage of the station value to the difference of extreme values and the resulting ratio is applicable to the difference of values for each channel. Here it is our color.
The rest of the elements on the page will be painted with a gradient, we have the coordinates and colors of the stations - and that’s all you need.
Here, too, scary. Check if the station value is in the selected range and hide the station if not. When we examine the stations, we will understand what to do with the other elements: if the station is hidden, neither the name, nor the transition to it, nor the segment of the branch should be displayed.
We also see that some stations have the same name. Accordingly, you only need to hide the name when the last of the stations associated with this name is hidden.
It remains to configure the range slider you like. For some reason, I wrote mine.Lazy adequate people advise, for example, this .
The viewBox property will take responsibility for this. The guys from Microsoft wrote an excellent article with examples. To intercept scrolling, I used jQuery Mousewheel . Admittedly, this is not the most trivial task, since when changing the scale, it is necessary to take into account a shift relative to the initial position with a coefficient corresponding to the zoom.
I used a modular architecture (about a dozen or so modules came out) , took Snap.svg to help. The data was loaded dynamically, miscalculated and, since some of the things were done using promises (I used jquery, so I took them from there) , I was even able to add some simple progress to the bar while everything is loading .
The joy lasted until I decided to log in from the phone ... On a very intelligent lumia 1020, the service loaded longer than half a minute. I absolutely forgot about the price of manipulations with dom. We have, for a second, more than a thousand items! Yes, and the manipulations with the viewBox on the mobile device did not work normally.
By a willful decision, we transfer the logic to the server and cache the issue so as not to count each time. Now you can abandon Snap.svg on the client!
It is necessary to close the issue with scaling and the ability to move on mobile. Think about how you would handle it.
What brought the transfer in numbers?
In the process, it turned out that Mozilla Firefox was re-optimized. While other guys regularly display all the graphics, “Mozilla” allows you to skip the render of elements, if the element is not visible to the user - it is closed by a div from the top or just outside the view area of the monitor. As a conscious citizen, I added a bug, which is still unconfirmed, because I cannot satisfy the request to provide the simplest possible testcase , everything works fine on a small number of elements, and the link to the project is probably not enough.
If a representative of “Mozilla” reads this: Guys, it works crookedly regardless of the platform (windows / mac) and version (it is also observed in older versions) , as a matter of fact.
Despite the fact that some dampness has remained in html5, it's time to use it. No need to load the processors of users, adding to every second site "fashionable" effects, which yesterday were in the mailing list for frontend-developers.
But it's time to make convenient transportation schemes and interactive products accessible from any device.
I do not understand why the same Yandex will not transfer J. Metro to a new official scheme that will work everywhere; Mobile users prefer to show links to applications. Stores (applications) are full of customers for social networks and large sites and, in my opinion, there is something wrong in this.
Work on each project involves somewhat idealized expectations, the reality is sobering.
I thought it necessary to bring here a few points:
1. Thanks for the feedback and the first donation on my practice. For the authors (me in particular), this is really important.
2. In the existing independent form the project will not be updated.
I made many mistakes and agree with a number of improvements that can be made. Their implementation would force to abandon what I'm working on now, and the ongoing development of the metro would make the process endless.
3. I will try to answer implementation questions or provide existing information, if needed. Ask in the comments.
We form requirements
- Show stations and lines for the selected date range
- Beauty - “Lebedev Studio” has developed a wonderful scheme ; and take it as a basis.
- The convenience of use.
- To enter values I decided to use range sliders. With them, we will achieve interactivity and change on the fly.
- I'm used to the functionality of map services that allow you to zoom and move the map - we implement it; Especially since our scheme, in fact, is the map.
- Add the ability to share a link to the sample.
It is assumed that the reader is at least superficially familiar with javascript, has an idea of vector graphics and is generally well done (will notice an error or a non-optimal solution and is not too lazy to suggest the best option for comments) .
We display the scheme
To make the scheme interactive, we first need the scheme itself. Let's look at what we want to get and analyze the image into simple elements.
')
Stations
The most important thing on the diagram is the stations, so let's start with them. Only 3 types: final, transfer and normal. 2 rectangles and a circle. What could be easier? Painstakingly arrange them on the canvas, and some more and turn.
1 tip
Save the scheme as a picture, set a low transparency and place it under our svg-canvas, which set the same size. This will simplify the placement of stations.
We get something like this
In order to move forward comfortably, I also added their index (numeric) and line to the properties of the stations - just below you will understand what this is done for.
2 advice
If you are doing something more than proof of concept, take a few hours to write an editor with the ability to drag and drop stations and specify their properties. To service your card will be much easier. Expediency is directly proportional to the number of stations and their properties.
Lines
What is the line? This is a set of segments between stations. We have coordinates, indices and station lines - which means we can easily draw segments. Let's go through the stations and we will be guided by the following logic for each of them: if there is a station of the same line, but with an index higher by one, then draw a segment between them.
Take a look at the diagram and try to answer, what 2 segments will not be drawn?
Answer
1. segment on the annular, connecting the "junior" and "senior" on the station index
2. The segment between the "Exhibition" and "Kiev"
2. The segment between the "Exhibition" and "Kiev"
As we shall see, the beginning and end of the segment do not go exactly as we need. For each of the 3 types of stations, we add an offset calculated experimentally. Also, our segments are set straight, but the lines themselves are many where fancifully curved. Perhaps this is the most painstaking part of the work on the project, for a number of segments we will add an exception in behavior. Fortunately, the syntax is simple .
Here is our intermediate option.
Transitions
Svg graphics use the layer model, which means that in order to get the desired result, we will make each transition using two curves: a colored one with a thick lower stroke and a white one with a thin one. The total arrangement of the elements is the following, from the lower to the upper: lines, segments of transitions with a color thick outline, stations, segments of transitions with a thin white outline, the substrate of the names of stations, the names of stations.
Station names and substrate
Display the names and align the text using the text-anchor property. Unfortunately, there is no way to carry out a line break, except by creating an additional element.
Substrate text will make the usual translucent rectangle. We will get the sizes and coordinates of the text using getBBox .
3 advice
After spending some time looking for a more elegant solution to the underlay of text, on stackoverflow, you will find the suggestion to use a filter. I advise you to use this solution only in the case of a single display of graphics. If further manipulations with graphics are assumed, the filter will behave incorrectly.
Repaint
I chose the default colors for stations as their line colors. But what if we want to repaint everything on an arbitrary gradient? It is not as difficult as it may seem.
We have an arbitrary gradient from one color to another, which for convenience we take in the channels, the station value (for example, a depth of 23 meters) and the maximum and minimum possible values (0 for ground stations and 80 for the deepest Victory Park). Calculate the percentage of the station value to the difference of extreme values and the resulting ratio is applicable to the difference of values for each channel. Here it is our color.
The rest of the elements on the page will be painted with a gradient, we have the coordinates and colors of the stations - and that’s all you need.
We filter
Here, too, scary. Check if the station value is in the selected range and hide the station if not. When we examine the stations, we will understand what to do with the other elements: if the station is hidden, neither the name, nor the transition to it, nor the segment of the branch should be displayed.
4 advice
Use the visibility property, since the opacity, although hiding elements, will leave them selectable and clickable.
We also see that some stations have the same name. Accordingly, you only need to hide the name when the last of the stations associated with this name is hidden.
It remains to configure the range slider you like. For some reason, I wrote mine.
Scale and move
The viewBox property will take responsibility for this. The guys from Microsoft wrote an excellent article with examples. To intercept scrolling, I used jQuery Mousewheel . Admittedly, this is not the most trivial task, since when changing the scale, it is necessary to take into account a shift relative to the initial position with a coefficient corresponding to the zoom.
Almost all
I used a modular architecture (about a dozen or so modules came out) , took Snap.svg to help. The data was loaded dynamically, miscalculated and, since some of the things were done using promises (I used jquery, so I took them from there) , I was even able to add some simple progress to the bar while everything is loading .
The joy lasted until I decided to log in from the phone ... On a very intelligent lumia 1020, the service loaded longer than half a minute. I absolutely forgot about the price of manipulations with dom. We have, for a second, more than a thousand items! Yes, and the manipulations with the viewBox on the mobile device did not work normally.
Fix bugs
From client to server
By a willful decision, we transfer the logic to the server and cache the issue so as not to count each time. Now you can abandon Snap.svg on the client!
Oh no
The self-written gradient generator for svg weighed nothing at all and was elegant, but sometimes it did not work: none of the gradients were applied to some elements, only the color. At the same time, gradients worked with other elements absolutely normal. Tired of the "black magic" I returned the library to the ranks. Still, I'm writing a proof of performance, not a “product.”
It is necessary to close the issue with scaling and the ability to move on mobile. Think about how you would handle it.
I did so
I started by searching for libraries (I stopped at hammer.js ) and even got acquainted with the documentation, but I remembered about TRIZ. Heinrich Altshuller defines an ideal object as an object that does not exist, and its function is performed.
We already have great support for scaling and panning on wearable devices. So ... Yes, I just cut down for phones and tablets manipulation with the viewBox-property.
We already have great support for scaling and panning on wearable devices. So ... Yes, I just cut down for phones and tablets manipulation with the viewBox-property.
What brought the transfer in numbers?
Before
After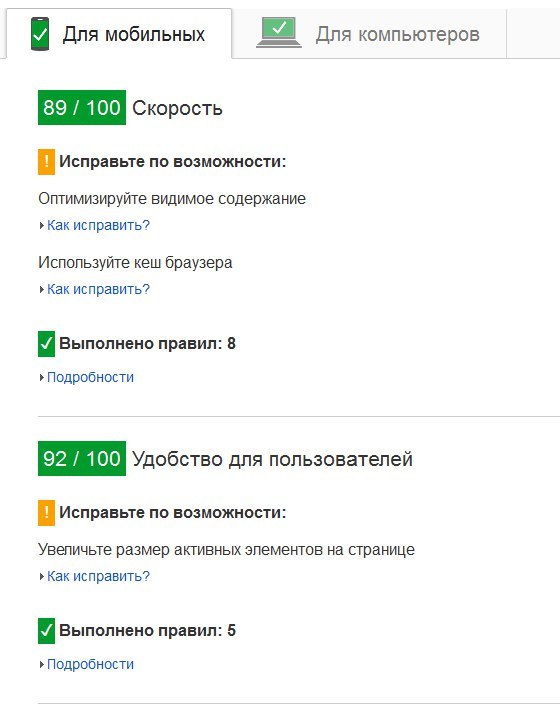
findings
Problems with “Mozilla Firefox”
In the process, it turned out that Mozilla Firefox was re-optimized. While other guys regularly display all the graphics, “Mozilla” allows you to skip the render of elements, if the element is not visible to the user - it is closed by a div from the top or just outside the view area of the monitor. As a conscious citizen, I added a bug, which is still unconfirmed, because I cannot satisfy the request to provide the simplest possible testcase , everything works fine on a small number of elements, and the link to the project is probably not enough.
If a representative of “Mozilla” reads this: Guys, it works crookedly regardless of the platform (windows / mac) and version (it is also observed in older versions) , as a matter of fact.
As a conclusion
Despite the fact that some dampness has remained in html5, it's time to use it. No need to load the processors of users, adding to every second site "fashionable" effects, which yesterday were in the mailing list for frontend-developers.
But it's time to make convenient transportation schemes and interactive products accessible from any device.
I do not understand why the same Yandex will not transfer J. Metro to a new official scheme that will work everywhere; Mobile users prefer to show links to applications. Stores (applications) are full of customers for social networks and large sites and, in my opinion, there is something wrong in this.
UPD
Work on each project involves somewhat idealized expectations, the reality is sobering.
I thought it necessary to bring here a few points:
1. Thanks for the feedback and the first donation on my practice. For the authors (me in particular), this is really important.
2. In the existing independent form the project will not be updated.
I made many mistakes and agree with a number of improvements that can be made. Their implementation would force to abandon what I'm working on now, and the ongoing development of the metro would make the process endless.
3. I will try to answer implementation questions or provide existing information, if needed. Ask in the comments.
Source: https://habr.com/ru/post/270293/
All Articles