Accelerate OSB
The article was prepared by Dmitry Ovcharenko, architect of the Department of Applied Financial Systems of Jet Infosystems
Starting to develop a proxy service on the Oracle Service Bus, you should take into account the conditions of use of this service. For example, if the process being developed will be involved in many popular operations or used by a large number of users. In the case of, for example, requesting information for the first page after the user’s login to the site, you should immediately follow the optimal code considerations in terms of performance.
In the process of writing transformations and all references to the paths within the message, do not be lazy to specify [1] after each node in the XPath
')
This will allow the expression to be treated as a reference to single elements of the structure, rather than to multiple elements, as is generally understood.
If some elements hidden in the depth of the structure are used repeatedly in the transformations, their value should be written to the variable inside the XQuery transformation, which can be further used:
At the same time, in Message Flow, the creation of unnecessary variables should be avoided, and , but not
  because the OSB paradigm itself welcomes the transformation of the message. Each new variable will be allocated memory, which takes time, and optimizing its consumption will also help in optimizing performance.
The basic processing of a message (Message Flow) from an OSB point of view is a call to a single business service using (or similar actions) and transfer of information to the requesting party with the required conversions. In this case, the processing of the incoming flow before calling the business service goes in one thread (Thread), after the call the flow returns to the free pool, the response of the business service is processed in another, new one, received from the pool. With this process, blocking and idle threads do not occur.
If without additional calls using not to do, Service Callout should be given quick lightweight requests, understanding that each call to Service Callout will require the allocation of a separate thread for it from the pool, and the main thread will be idle at this time. With this approach, blocking is possible, and to avoid them, you can use separate thread pools provided by the Work Manager mechanism. About Work Manager will tell later.
During operation, our ideally written proxy service began to slow down, people go to the site for ages, get upset and go to smash the service bus.
It is not always the bus that is to blame for slow work, real systems lie under business services, and they can process requests in a difficult and slow way. To catch them in such a negative is simple. It is enough to use the Pipeline Monitoring mechanism. It is enabled for proxies and business services in the Operational Settings tab -> Monitoring -> Enable Pipeline Monitoring at (select Service) level or above
The choice of the Aggregation Interval parameter corresponds to the time period over which data will be recorded and averaged from the current moment. For the monitoring of industrial solutions, you can choose large intervals - a day or more, for load testing - comparable with the test time.
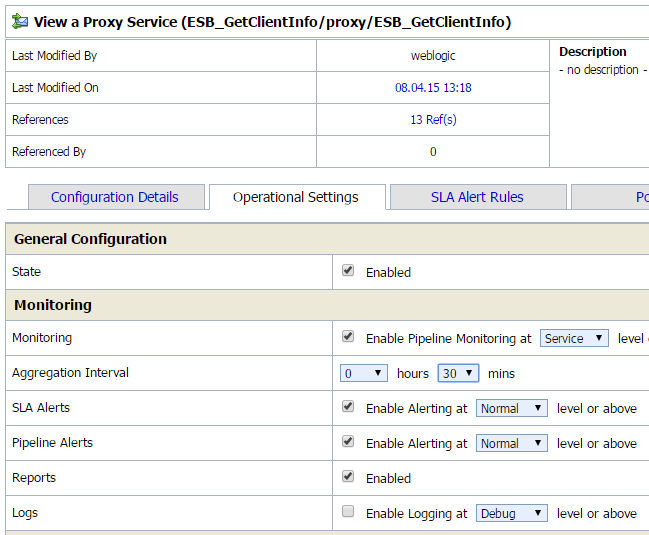
At the same time, to speed up the work, you should disable logging as within the service using , and external - in the tab Operational Settings. Logs not only consume a lot of space in the industrial system, but also significantly slow down the process and may even cause blocking of threads.
The results of the included monitoring can be seen in the screen Operations -> Service Health
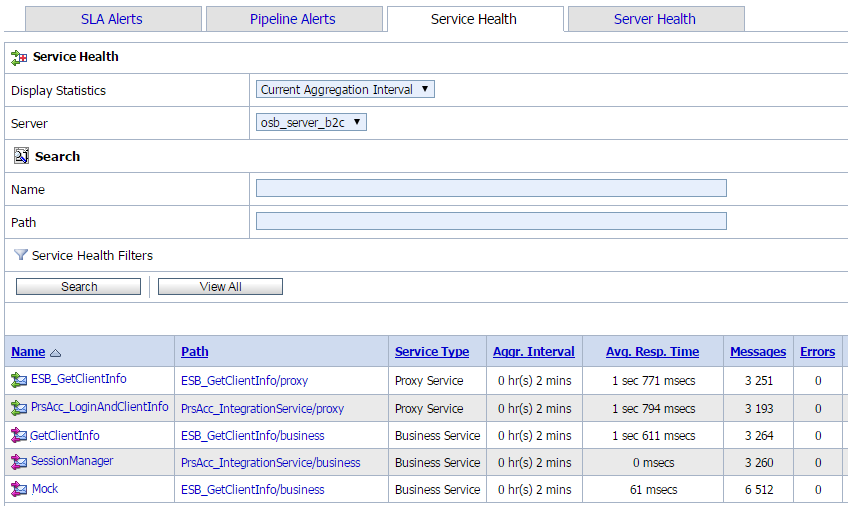
In the screenshot above, we see that the SessionManager call is executed almost instantly, which is not surprising, since this is a small Java application deployed in the same WebLogic domain. The Mock business service runs on average within 61 milliseconds, but GetClientInfo takes more than one and a half seconds - this is a large business application with lots of data, you have to tinker to speed up the request. Against such timings, the delay introduced by the OSB is minimal.
The OSB Deployment Wizard will ask you whether to install the application in an industrial mode, we will not abandon the factory optimizations, and after installing the first thing, we will give the OSB server more memory, leaving the operating system gigabytes, and the rest of the managed servers will have the same initial and final memory by value
The remaining parameters — the MaxPermSize or Garbage Collector settings — will not give significant performance gains.
The second essential mechanism that can save services sinking in the flow of requests is Work Manager. Go to the WebLogic console, select Environment -> Work Managers.
Create separate Work Manager for the most popular proxy services, especially for those used by other services in Service Callout, specify Minimum Threads Constraint, for example 40 (this number is selected during the load tests) and tick Ignore Stuck Threads. This is normal for OSB and recommended by the vendor.
And if our poor popular proxy services sink so much that they affect other integration processes that lack resources, consider using Work Managers with the Capacity Constraint parameter - they will not allow simultaneous requests to be performed for more than the specified number. Exceeding requests will be dropped without processing.
Assign the created Work Manager OSB proxy services. Work Manager is selected in the HTTP Transport Configuration -> Dispatch Policy section.
Instead of concluding, we note that without a load test, tuning performance is not easy; you cannot play with the parameters on a working industrial system. There are many products to load web services. The initial is to recommend SOAP-UI, it is able to give a sufficient number of requests to track the results of the configuration. If you need more advanced solutions - HP Load Runner or Oracle Application Testing Suite - they will take time to deal with them, and you may need to ask a professional tester to write a test for you while you put down [1] after each node in xpath.
We welcome your constructive comments.
Anticipating the problem
Starting to develop a proxy service on the Oracle Service Bus, you should take into account the conditions of use of this service. For example, if the process being developed will be involved in many popular operations or used by a large number of users. In the case of, for example, requesting information for the first page after the user’s login to the site, you should immediately follow the optimal code considerations in terms of performance.
In the process of writing transformations and all references to the paths within the message, do not be lazy to specify [1] after each node in the XPath
')
$Get_Client_Info_Output/ns1:ListOfContact[1]/ns1:Contact[1]/ns1:rName[1] This will allow the expression to be treated as a reference to single elements of the structure, rather than to multiple elements, as is generally understood.
If some elements hidden in the depth of the structure are used repeatedly in the transformations, their value should be written to the variable inside the XQuery transformation, which can be further used:
let $name := $Get_Client_Info_Output/ns1:ListOfContact[1]/ns1:Contact[1]/ns1:rName[1] At the same time, in Message Flow, the creation of unnecessary variables should be avoided, and
, but not because the OSB paradigm itself welcomes the transformation of the message. Each new variable will be allocated memory, which takes time, and optimizing its consumption will also help in optimizing performance.The basic processing of a message (Message Flow) from an OSB point of view is a call to a single business service using
(or similar actions) and transfer of information to the requesting party with the required conversions. In this case, the processing of the incoming flow before calling the business service goes in one thread (Thread), after the call the flow returns to the free pool, the response of the business service is processed in another, new one, received from the pool. With this process, blocking and idle threads do not occur.If without additional calls using
not to do, Service Callout should be given quick lightweight requests, understanding that each call to Service Callout will require the allocation of a separate thread for it from the pool, and the main thread will be idle at this time. With this approach, blocking is possible, and to avoid them, you can use separate thread pools provided by the Work Manager mechanism. About Work Manager will tell later.Confronted with trouble
During operation, our ideally written proxy service began to slow down, people go to the site for ages, get upset and go to smash the service bus.
It is not always the bus that is to blame for slow work, real systems lie under business services, and they can process requests in a difficult and slow way. To catch them in such a negative is simple. It is enough to use the Pipeline Monitoring mechanism. It is enabled for proxies and business services in the Operational Settings tab -> Monitoring -> Enable Pipeline Monitoring at (select Service) level or above
The choice of the Aggregation Interval parameter corresponds to the time period over which data will be recorded and averaged from the current moment. For the monitoring of industrial solutions, you can choose large intervals - a day or more, for load testing - comparable with the test time.
At the same time, to speed up the work, you should disable logging as within the service using
, and external - in the tab Operational Settings. Logs not only consume a lot of space in the industrial system, but also significantly slow down the process and may even cause blocking of threads.The results of the included monitoring can be seen in the screen Operations -> Service Health
In the screenshot above, we see that the SessionManager call is executed almost instantly, which is not surprising, since this is a small Java application deployed in the same WebLogic domain. The Mock business service runs on average within 61 milliseconds, but GetClientInfo takes more than one and a half seconds - this is a large business application with lots of data, you have to tinker to speed up the request. Against such timings, the delay introduced by the OSB is minimal.
But if you need faster
The OSB Deployment Wizard will ask you whether to install the application in an industrial mode, we will not abandon the factory optimizations, and after installing the first thing, we will give the OSB server more memory, leaving the operating system gigabytes, and the rest of the managed servers will have the same initial and final memory by value
-Xms10G -Xmx10G. The remaining parameters — the MaxPermSize or Garbage Collector settings — will not give significant performance gains.
The second essential mechanism that can save services sinking in the flow of requests is Work Manager. Go to the WebLogic console, select Environment -> Work Managers.
Create separate Work Manager for the most popular proxy services, especially for those used by other services in Service Callout, specify Minimum Threads Constraint, for example 40 (this number is selected during the load tests) and tick Ignore Stuck Threads. This is normal for OSB and recommended by the vendor.
And if our poor popular proxy services sink so much that they affect other integration processes that lack resources, consider using Work Managers with the Capacity Constraint parameter - they will not allow simultaneous requests to be performed for more than the specified number. Exceeding requests will be dropped without processing.
Assign the created Work Manager OSB proxy services. Work Manager is selected in the HTTP Transport Configuration -> Dispatch Policy section.
Load
Instead of concluding, we note that without a load test, tuning performance is not easy; you cannot play with the parameters on a working industrial system. There are many products to load web services. The initial is to recommend SOAP-UI, it is able to give a sufficient number of requests to track the results of the configuration. If you need more advanced solutions - HP Load Runner or Oracle Application Testing Suite - they will take time to deal with them, and you may need to ask a professional tester to write a test for you while you put down [1] after each node in xpath.
We welcome your constructive comments.
Source: https://habr.com/ru/post/269649/
All Articles