Duke, take out the trash! - Part 1
Surely, you have already read more than one review of garbage collection mechanisms in Java and setting up options such as Xmx and Xms has become a routine for you. But do you really understand in detail what is happening under the hood of your virtual machine at the moment when it comes time to get rid of unnecessary objects in memory and your ideally optimized method starts running several times longer than it should be? And do you know what features give you the latest versions of Java to optimize the responsible work of garbage collection, often greatly affecting the performance of your application?
Let's try in a few articles to go from the description of the basic ideas underlying all garbage collectors to the analysis of the algorithms and tweaking of various Java HotSpot VM collectors (do you know that there are four such collectors?). And most importantly, consider how this knowledge can be used in practice.
It should immediately make a reservation that all of the following applies to the HotSpot virtual machine. So if you see a reference to the JVM in the text, then we are talking about this implementation. But the basic principles apply to third-party virtual machines, although they may differ in some details.
')
And I need it?
Reasonable question. Far from any program for trouble-free work requires fine-tuning the garbage collector. Very often, allocating it the necessary amount of memory is sufficient. In the end, a rare user will notice that the response of the program from time to time takes a hundred or two milliseconds longer than usual.
But it is possible that the amount of memory used by your program is such that its cleaning takes seconds, or even tens of seconds. Or your service is tied with a hard SLA , and you cannot afford to scatter tens of milliseconds to the right and left. Or curiosity does not allow you just to close your eyes to the fact that your program does something in its depths, and you do not know what. In these cases, let's understand.
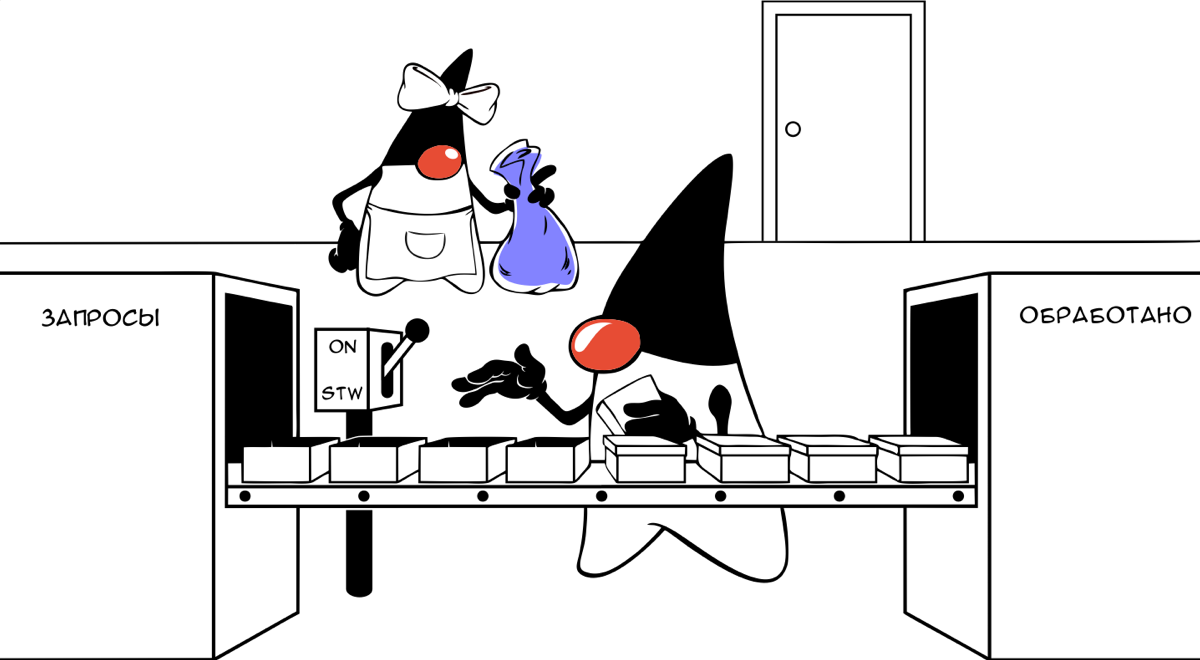
Divide and rule
Before proceeding directly to the issues of cleaning our Augean stables, let's look at their general structure and determine what we would like to focus on.
The JVM divides the memory it uses into two areas: a heap , in which application data is stored, and a non-heap , in which program code and other auxiliary data are stored.
If your application does not generate new classes by itself and does not deal with constant loading / unloading of classes, then the non-heap state in the long term will be close to static and little optimizable. In this regard, we will not consider the mechanisms for the functioning of the non-heap area here, but focus on the area where our efforts will bring the greatest benefit.
All objects that are explicitly or implicitly created by a Java application are placed on the heap. Over the optimization of the placement of objects and their processing algorithms, language developers with automatic garbage collection have been fighting from the first day of their creation. And at least in the near future, this battle will continue, because the volume of data being processed is growing, and the requirements for garbage collection in different applications are very different, which makes the creation of a single ideal collector is not a trivial matter. Our job is to follow the situation and try to extract as much as possible from the available tools.
From generation to generation
Pursuing their goals (which may vary and which we will definitely consider below), various garbage collectors use different approaches to memory organization and its cleaning, but they share a common feature - they all rely on a weak hypothesis about generations . In general, the generational hypothesis states that the probability of death as a function of age decreases very quickly. Its application to garbage collection in particular means that the vast majority of objects live extremely shortly. By human standards, most even in kindergarten will not go. It also means that the longer an object has lived, the higher the likelihood that it will live on.
Most applications have a distribution of lifetimes of objects, schematically described approximately as a curve:
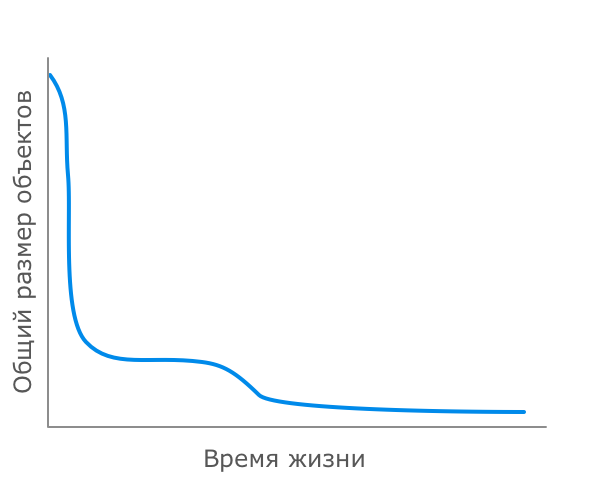
The vast majority of objects are created for a very short time, they become unnecessary almost immediately after their first use. Iterators, local method variables, boxing results and other temporary objects, which are often created implicitly, fall into this category, forming a peak at the very beginning of the graph.
Next are the objects created to perform more or less long calculations. Their lives are a little more diverse - they usually walk along different methods, transforming and enriching themselves in the process, but after that they become unnecessary and turn into garbage. Thanks to such objects, a small bump appears on the graph following the peak of temporary objects.
And, finally, old-timers who survive almost everyone are permanent program data, often loaded at the very beginning and living a long and happy life until the application stops.
Of course, each application is unique in its own way, so in each particular case this schedule will vary, change proportions, anomalies will appear on it, but most often the form is exactly that. Remember this graph, it is still useful to us when performing optimizations.
All this led the developers to the idea that first of all it was necessary to focus on cleaning up those objects that were created quite recently. It is among them that most often there are a

This is where the idea of separating objects into younger generation and older generation arises. In accordance with this division, garbage collection processes are divided into a minor assembly (minor GC) , affecting only the younger generation, and a full assembly (full GC) , which can affect both generations. Small assemblies are performed quite often and remove the bulk of dead objects. Complete assemblies are performed when the current amount of memory allocated to the program is close to exhaustion and a small assembly is no longer necessary.
At the same time, the separation of objects by generations is not just conditional, they are physically located in different regions of memory. Objects from the younger generation, as they survive in garbage collections, are transferred to the older generation. In the older generation, the object can live until the application ends, or it will be deleted in the process of one of the complete garbage collections.
Are you fast, cheap or high quality?
Intuitively, it is desirable to have a garbage collector that would get rid of unnecessary objects as quickly as possible, clearing the way for young people and ensuring a quiet and peaceful existence for long-livers. But the work of the garbage collector is not free, it is paid for by computer resources and delays in program execution. Therefore, before moving on, let's look at the criteria used in the assessment of collectors.
Traditionally, the following factors are taken into account when determining the performance of a garbage collector:
- Maximum delay - the maximum time for which the collector suspends the execution of the program to perform a single assembly. Such stops are called stop-the-world (or STW ).
- Bandwidth is the ratio of the total program runtime to the total idle time caused by garbage collection over a long period of time.
- Consumed resources - the amount of processor resources and / or additional memory consumed by the collector.
It is clear that to achieve the improvement of all three parameters simultaneously is almost impossible. Reducing the maximum delay time leads to increased garbage collection, reducing throughput. Or you have to use more clever algorithms to save bandwidth, which often increases resource consumption. And so on.
Therefore, when setting up garbage collectors, developers usually focus on optimizing one or two parameters, trying not to degrade the others much, but sacrificing them if necessary.
Memento mori
Lord, give me a place to put what you still need,
Give me the courage to remove what is no longer useful,
And give me the wisdom to distinguish one from the other.
- Prayer of garbage collectors
Another important question that I would like to make out before moving on is the definition of the very concept of garbage, that is, of dead objects.
As we have already found out above, the path of most objects from the moment of creating and executing their mission to the moment of turning into garbage is rather short. But there are factors that can delay him in the world of the living a little longer than we would like.
We all know that it is impossible to consider an object to be alive simply by the fact that there are links to it from other objects. Otherwise, the recipe for immortality in the JVM would be to disgraceful is simple and would consist in the presence of reciprocal links from at least two objects to each other, and in the general case - in the presence of a cycle in the graph of connectedness of objects. With such an approach and a limited amount of memory, a more or less serious program would not have worked for a long time, so the JVM does a good job of tracking loops in object graphs.
But it is also impossible to simply say that an object is dead and can only be deleted on the basis that there are no more used objects referring to it (directly or indirectly) in the program, since the division of objects into generations introduces its own corrections.
Consider this situation: We have a young object A and an object B referring to it, already deserving of a place in the older generation. At some point in time, we didn’t need both of these objects and we reset all our references to them. Obviously, object A could be removed to the nearest small garbage collection, but in order to get this knowledge, the collector would have to look through all the older generation and understand that object B referring to A is also garbage, and therefore both can be recycled. . But the analysis of the older generation is not included in the small assembly plan, since it is a relatively expensive procedure, so object A will be considered alive during a small assembly.

Thus, most often, for the purposes of small garbage collection, an object is considered dead and recyclable, if it is impossible to reach it by reference either from objects of the older generation or from so-called roots (roots) , which include links from thread stacks, static members of classes
By the way, the time from the moment when we no longer need the object to the time it was actually removed from memory is called promptness and is sometimes considered as an additional factor in assessing the efficiency of the collector.
Under the microscope
So, we have already received a basic understanding of what garbage collectors are doing and by what criteria they can be evaluated. Now I would like to figure out how to look inside the virtual machine, so that we have the opportunity to observe the work of its hidden mechanisms.
Tools for monitoring memory and garbage collection processes should be divided into two groups:
- internal, which are part of the program that we are monitoring,
- external, connected to the process of the program under study from the outside.
The problem with memory monitoring tools is that, by the very fact of observing the memory and garbage collection, as in quantum mechanics or in psychology, they influence the behavior of the test subject. Below I will give an example of such a change in behavior, but for now you just need to remember that whatever tool you use, you should check its calibration with at least a simple example: run a program that does nothing, and monitor it.
Internal tools
As for the internal monitoring tools, here we can either ask the JVM to display information about the assemblies produced with different levels of detail (in stdout or in the log file), or independently refer to MXBeans returning information about the state of memory and garbage collections and handle it as we like.
The following options are available in JVM HotSpot that control the output of garbage collection information (these are the main options that work for all collectors):
| Enables the garbage collection logging mode in stdout. | |
| Specifies the name of the file to which garbage collection information should be logged. Has priority over -verbose: gc . | |
| Adds timestamps to build information (as the number of seconds since the program began). | |
| Includes advanced garbage collection information. | |
| When the application starts, it outputs to stdout the values of all options specified explicitly or set by the JVM itself. This also includes options related to garbage collection. It is often useful to look at the values assigned to them. |
If you want to collect data from your application yourself, then you can use the corresponding MXBeans for this. Here is an example of a simple class that allows you to display the current state of various memory regions, as well as information about garbage collections, which can be used as a basis if you want to develop your own monitoring:
MemoryUtil.java
public class MemoryUtil { private static final int NORM_NAME_LENGTH = 25; private static final long SIZE_KB = 1024; private static final long SIZE_MB = SIZE_KB * 1024; private static final long SIZE_GB = SIZE_MB * 1024; private static final String SPACES = " "; private static Map<String, MemRegion> memRegions; // private static class MemRegion { private boolean heap; // , private String normName; // , public MemRegion(String name, boolean heap) { this.heap = heap; normName = name.length() < NORM_NAME_LENGTH ? name.concat(SPACES.substring(0, NORM_NAME_LENGTH - name.length())) : name; } public boolean isHeap() { return heap; } public String getNormName() { return normName; } } static { // memRegions = new HashMap<String, MemRegion>(ManagementFactory.getMemoryPoolMXBeans().size()); for(MemoryPoolMXBean mBean: ManagementFactory.getMemoryPoolMXBeans()) { memRegions.put(mBean.getName(), new MemRegion(mBean.getName(), mBean.getType() == MemoryType.HEAP)); } } // private static NotificationListener gcHandler = new NotificationListener() { @Override public void handleNotification(Notification notification, Object handback) { if (notification.getType().equals(GarbageCollectionNotificationInfo.GARBAGE_COLLECTION_NOTIFICATION)) { GarbageCollectionNotificationInfo gcInfo = GarbageCollectionNotificationInfo.from((CompositeData) notification.getUserData()); Map<String, MemoryUsage> memBefore = gcInfo.getGcInfo().getMemoryUsageBeforeGc(); Map<String, MemoryUsage> memAfter = gcInfo.getGcInfo().getMemoryUsageAfterGc(); StringBuilder sb = new StringBuilder(); sb.append("[").append(gcInfo.getGcAction()).append(" / ").append(gcInfo.getGcCause()) .append(" / ").append(gcInfo.getGcName()).append(" / ("); appendMemUsage(sb, memBefore); sb.append(") -> ("); appendMemUsage(sb, memAfter); sb.append("), ").append(gcInfo.getGcInfo().getDuration()).append(" ms]"); System.out.println(sb.toString()); } } }; /** * stdout . */ public static void printUsage(boolean heapOnly) { for(MemoryPoolMXBean mBean: ManagementFactory.getMemoryPoolMXBeans()) { if (!heapOnly || mBean.getType() == MemoryType.HEAP) { printMemUsage(mBean.getName(), mBean.getUsage()); } } } /** * . */ public static void startGCMonitor() { for(GarbageCollectorMXBean mBean: ManagementFactory.getGarbageCollectorMXBeans()) { ((NotificationEmitter) mBean).addNotificationListener(gcHandler, null, null); } } /** * . */ public static void stopGCMonitor() { for(GarbageCollectorMXBean mBean: ManagementFactory.getGarbageCollectorMXBeans()) { try { ((NotificationEmitter) mBean).removeNotificationListener(gcHandler); } catch(ListenerNotFoundException e) { } } } private static void printMemUsage(String title, MemoryUsage usage) { System.out.println(String.format("%s%s\t%.1f%%\t[%s]", memRegions.get(title).getNormName(), formatMemory(usage.getUsed()), usage.getMax() < 0 ? 0.0 : (double)usage.getUsed() / (double)usage.getMax() * 100, formatMemory(usage.getMax()))); } private static String formatMemory(long bytes) { if (bytes > SIZE_GB) { return String.format("%.2fG", bytes / (double)SIZE_GB); } else if (bytes > SIZE_MB) { return String.format("%.2fM", bytes / (double)SIZE_MB); } else if (bytes > SIZE_KB) { return String.format("%.2fK", bytes / (double)SIZE_KB); } return Long.toString(bytes); } private static void appendMemUsage(StringBuilder sb, Map<String, MemoryUsage> memUsage) { for(Entry<String, MemoryUsage> entry: memUsage.entrySet()) { if (memRegions.get(entry.getKey()).isHeap()) { sb.append(entry.getKey()).append(" used=") .append(entry.getValue().getUsed() >> 10) .append("K; "); } } } } External tools
In nature, there are a huge number of tools that allow you to connect to the Java process and in a convenient form to obtain information about the state of the memory and the processes of garbage collection. This includes the VisualVM utilities (with the VisualGC plugin) and Java Mission Control and various tools / plugins for the IDE and some programs like JProfiler or YourKit and many more that are included in the JVM HotSpot distribution.
You can choose what you prefer to use, but as mentioned above, be sure to check the impact of your instrument and its settings on the experimental application. Here is an example of how VisualVM affects the behavior of a program, the entire executable code of which consists of suspending the execution of the main thread:

See this growing chart at the top? This is almost 8 MB of garbage data per minute brought in by monitoring. If you need a general idea of how the collector works, or if a dozen megabytes of data per minute for your program is less than the permissible measurement error, then this behavior can be forgiven for the tool. But if you are fine tuning and you have every megabyte counted, then it’s better to choose something less voracious.
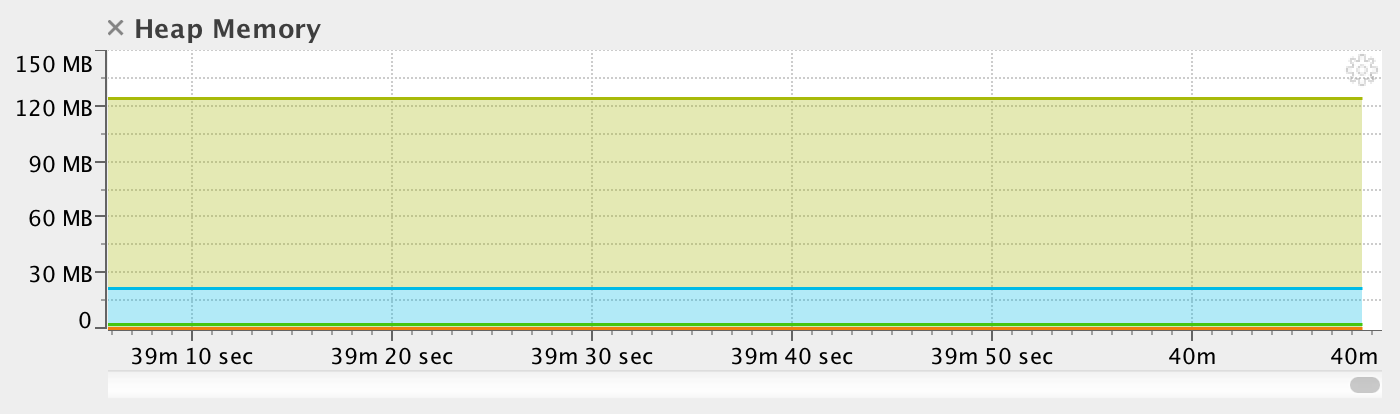
Ideally, your tool should display a graph of memory usage by a comatose program like this:
As an option, pay attention to the internal monitoring tools described above, they are initially lightweight, and if you need to add advanced functions, you can influence their voracity themselves.
And you can see all?
Well, since you have reached this place and even the long enumeration of obvious things in the previous paragraphs did not stop you, then you really should be interested. Let's take a look at what HotSpot gives us out of the box.
As already mentioned, the principles of garbage collection described above are common to all collectors. But at the same time there are noticeable differences between the collectors, manifested in the answers to the following questions:
- How many heap regions are used, what is their purpose and size? How do these sizes change dynamically?
- How does the transfer of objects from the younger generation to the older?
- Which of the garbage collection works are performed in parallel with the work of the main program, and which ones lead to its stop?
- How does the garbage collector automatically adjust to the required performance parameters? Which of them gives priority?
- What are the possibilities for setting up a collector?

Java HotSpot VM provides developers with a choice of four different garbage collectors:
Serial (serial) - the easiest option for applications with a small amount of data and not demanding to delays. It is rarely used, but on weak computers it can be selected by the virtual machine as the default collector.
Parallel (parallel) - inherits approaches to the assembly from the sequential collector, but adds parallelism in some operations, as well as the ability to automatically adjust to the required performance parameters.
Concurrent Mark Sweep (CMS) - aims to reduce maximum delays by performing part of the garbage collection work in parallel with the main streams of the application. Suitable for working with relatively large amounts of data in memory.
Garbage-First (G1) - created to gradually replace the CMS, especially in server applications running on multiprocessor servers and operating with large amounts of data.
In the following articles we will examine in detail each of these assemblers, trying to adhere to a general plan: a brief description, operating principles, STW situations (this is stop the world, if you have forgotten), ways of tuning, advantages and disadvantages. Having obtained this knowledge, we will see what to do with them in real life.
Part 2 - Serial GC and Parallel GC assemblers →
Part 3 - CMS GC and G1 GC assemblers →
Source: https://habr.com/ru/post/269621/
All Articles